
Journal of Geo-information Science >
A Measure of Urban Green Index in Urban Areas Based on Moving Window Method
Received date: 2015-07-15
Request revised date: 2015-09-14
Online published: 2016-04-19
Copyright
Urban green space is an important element of ecological networks. Conservation policies urge the protection of urban green space in cities possessed by dense buildings and focus on the improvement of intercommunity relationships among the green space plots within different areas. Urban green space forms an indispensable part of urban ecosystems. Quantifying the urban green space is of substantial importance for urban planning and development. In order to solve the problem of measuring the proximity of residents to green space (PRG), this paper proposed a method of urban green index (UGI) based on multi-spectral remote sensing data and Lidar data (LiDAR), which provide the accurate information of urban buildings and green spaces. In this study, the urban green index of the central pixel is developed based on calculating the area of urban green space and a fixed window area. The results show that the urban green index can be an effective method to measure the proximity of residents to green space and its spatial distribution characteristics. It avoids the edge effects generated by grid method, overcomes the discontinuity problem occurred in the buffer space, and could obtain the urban green index of any point in the region. At the same time, the newly constructed model can be used to identify the key protection regions that will have typical demonstration effects. The input parameters of the model can be obtained from the remote sensing images, which are easier to obtain than from the field measurements. Therefore, it could be considered to be a new method for studying the urban green space and could offer effective technical assistances to urban planning and management. The quantitative evaluation of the urban green space will provide the scientific support to urban greening and urban environmental protection. This study exploits the advantages of multi-source remote sensing data with high ground resolution in extracting building and vegetation information.
WU Jun , MENG Qingyan , ZHAN Yulin , GU Xingfa , ZHANG Jiahui . A Measure of Urban Green Index in Urban Areas Based on Moving Window Method[J]. Journal of Geo-information Science, 2016 , 18(4) : 544 -552 . DOI: 10.3724/SP.J.1047.2016.00544
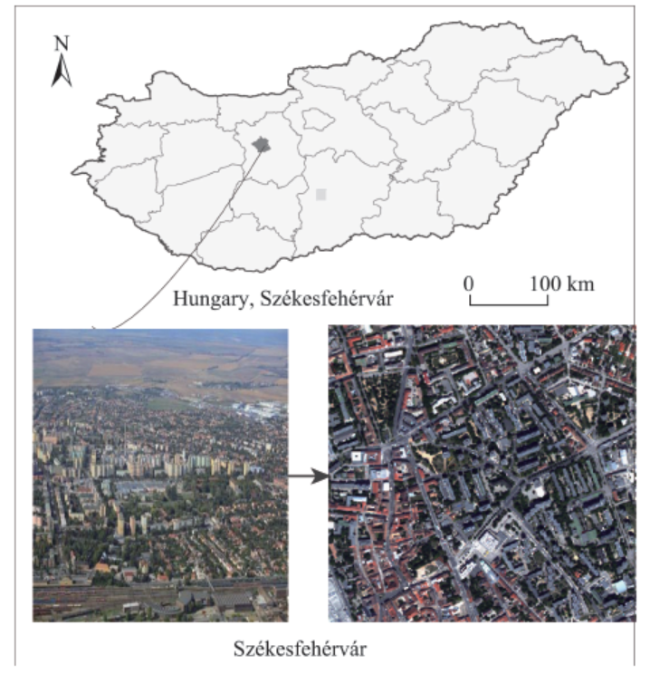
Fig. 1 Sketch map of the study area图1 研究区示意图 |
Tab. 1 Parameters of TopoSys表1 TopoSys系统参数 |
| 数据 | 参数信息 | 采集日期 |
|---|---|---|
| TopoSys Inc. 多光谱数据和LiDAR点云 数据 | 空间分辨率 RGBI:0.5 m 空间分辨率 LiDAR:1 m 水平精度<±0.5 m 垂直精度<±0.15 m 投影:匈牙利EOV投影 模式:First and Last Echo,RGBI 影像块:4块2000 m×2000 m | 2008-5-30 |
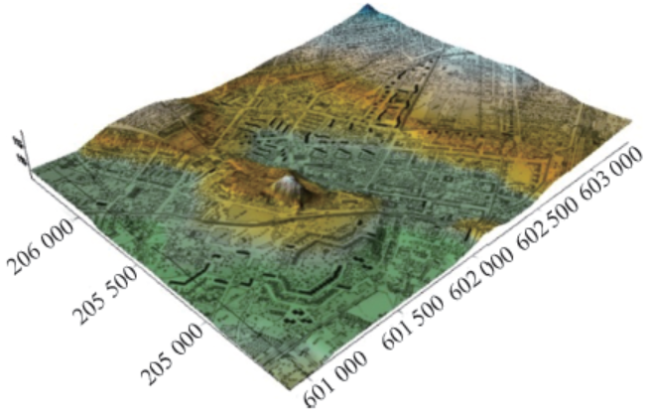
Fig. 2 Digital Terrain Model图2 数字地形模型(DTM) |
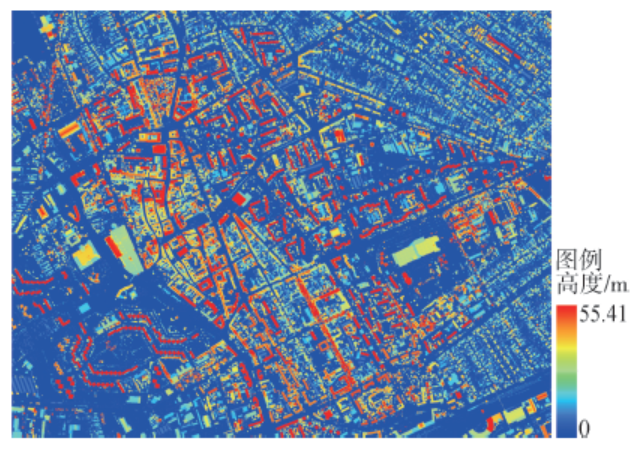
Fig. 3 Digital Surface Model图3 数字地面模型(DSM) |
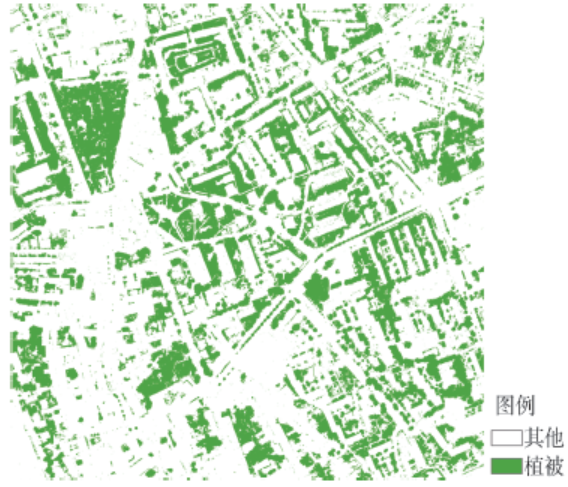
Fig. 4 Urban green spaces图4 城市绿地提取结果 |
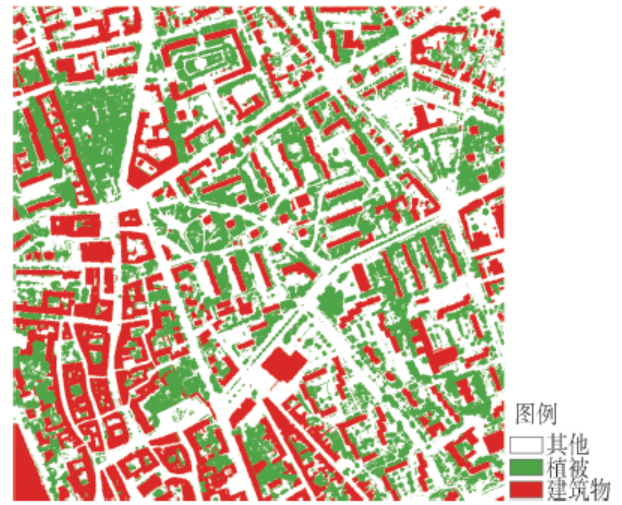
Fig. 5 Urban green spaces and buildings图5 城市绿地与建筑物分布图 |
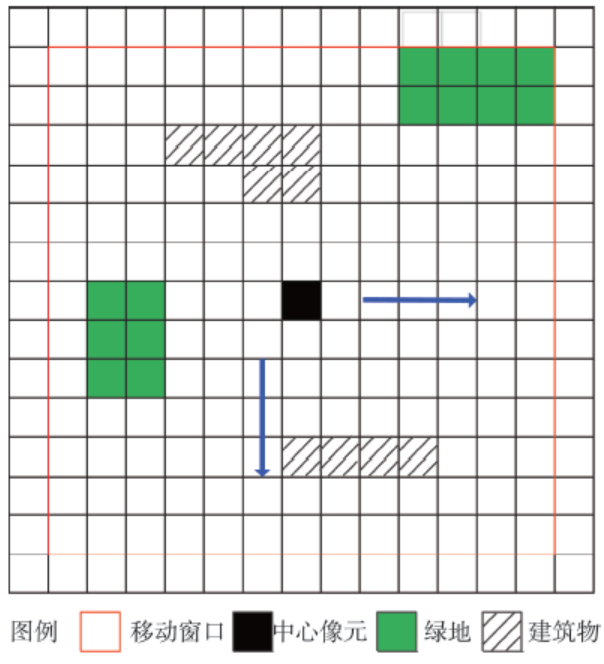
Fig. 6 Moving window diagram图6 移动窗口示意图 |
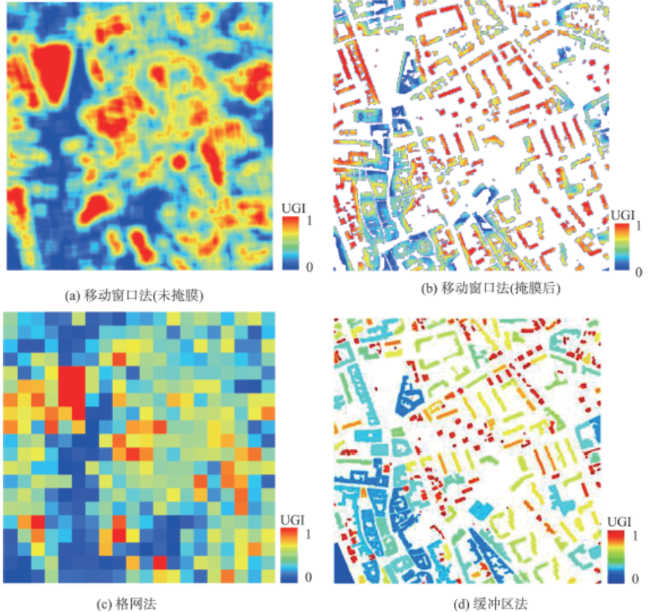
Fig. 7 Urban green index图7 城市绿度遥感度量指数分布图 |
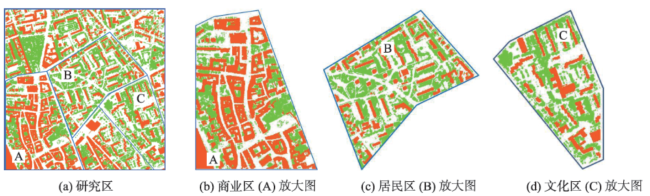
Fig. 8 Three functional domains in the study area图8 研究区域功能区分布图 |
Tab. 2 Statistical table of the three methods表2 3种方法功能区度量结果统计表 |
| 特征值 | 研究区 | A区 | B区 | C区 | |
|---|---|---|---|---|---|
| 格网法 | 中值 | 0.35 | 0.15 | 0.37 | 0.32 |
| 平均值 | 0.32 | 0.19 | 0.35 | 0.31 | |
| 标准差 | 0.17 | 0.18 | 0.16 | 0.17 | |
| 缓冲区法 | 中值 | 0.44 | 0.21 | 0.36 | 0.35 |
| 平均值 | 0.29 | 0.17 | 0.37 | 0.36 | |
| 标准差 | 0.21 | 0.19 | 0.15 | 0.17 | |
| 移动窗口法 | 中值 | 0.36 | 0.15 | 0.36 | 0.37 |
| 平均值 | 0.31 | 0.12 | 0.35 | 0.33 | |
| 标准差 | 0.23 | 0.19 | 0.14 | 0.15 |
Tab. 3 Spatial distribution characteristics of urban green index (%)表3 3种绿度指数空间分布特征(%) |
| 研究区 | A区 | B区 | C区 | ||||||||||||
|---|---|---|---|---|---|---|---|---|---|---|---|---|---|---|---|
| 范围 | GUGI | BUGI | MUGI | GUGI | BUGI | MUGI | GUGI | BUGI | MUGI | GUGI | BUGI | MUGI | |||
| [0,0.25) | 31.2 | 33.1 | 31.4 | 44.2 | 39.2 | 47.3 | 14.6 | 19.2 | 26.6 | 17.1 | 20.3 | 28.9 | |||
| [0.25,0.50) | 36.3 | 35.3 | 31.6 | 34.1 | 37.3 | 26.5 | 40.7 | 32.3 | 34.2 | 41.3 | 34.4 | 37.4 | |||
| [0.50,0.75) | 23.8 | 23.7 | 25.4 | 17.1 | 19.6 | 17.2 | 29.8 | 39.4 | 29.4 | 31. | 33.9 | 20.6 | |||
| [0.75,1.00) | 8.7 | 7.9 | 11.6 | 4.6 | 3.9 | 9.0 | 14.9 | 9.1 | 9.8 | 10.2 | 12.4 | 13.1 | |||
| 总计 | 100 | 100 | 100 | 100 | 100 | 100 | 100 | 100 | 100 | 100 | 100 | 100 | |||
Tab. 4 Parse list of the sample region表4 样区分析表 |
| 位置点 | 格网法 | 移动窗口法 | 缓冲区法 | 备注 |
|---|---|---|---|---|
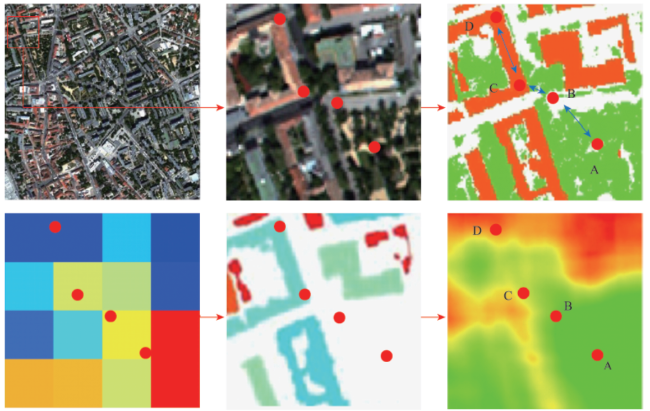
| A | 0.67 | 0.73 | - | A、B点在格网法中处于同一格网中;C、D属于同一建筑物2个点;dAB> dBC |
| B | 0.67 | 0.52 | - | |
| C | 0.46 | 0.43 | 0.39 | |
| D | 0.05 | 0.17 | 0.39 |
Fig. 9 Sample region图9 样区示例图 |
The authors have declared that no competing interests exist.
| [1] |
[
|
| [2] |
|
| [3] |
|
| [4] |
|
| [5] |
[
|
| [6] |
[
|
| [7] |
|
| [8] |
|
| [9] |
|
| [10] |
CuttsB,
|
| [11] |
|
| [12] |
|
| [13] |
[
|
| [14] |
[
|
| [15] |
|
| [16] |
[
|
| [17] |
[
|
| [18] |
[
|
| [19] |
[
|
/
| 〈 |
|
〉 |