
Journal of Geo-information Science >
Compound Cluster Center Based Multiple Linear Regression Color Normalization Method for Remote Sensing Image
Received date: 2015-12-15
Request revised date: 2016-04-12
Online published: 2016-05-10
Copyright
Due to the impacts of phonological change, sensor distortion, variation of atmospheric conditions and a lot of other factors, the images acquired at different time points for the same area are affected by color differences, Color normalization tries to eliminate /reduce color differences between different images and obtain seamless mosaic result. However, the traditional band-by-band normalization methods ignore the correlation between different bands and corrected each band independently, which may lead to new color distortion. To solve this problem, this paper presents a compound cluster center based multiple linear regression color normalization method for remote sensing image. Firstly, the source image and the reference images are primarily normalized based on the mean and variation values for every band and a new feature vector is constructed. Then, the compound clusters, which are extracted by unsupervised compound classification, are used to model the variation relationship between the two images. Afterwards,the outliers in every cluster may induce suddencolor change between the images of different time, so the outliers is identified and excluded. Last, the mapping relationship between the source image and the reference image is established with respect to the centers of clusters andall bands of source image are corrected simultaneously. The proposed method has been applied to two datasets with different land cover and spatial resolution, and results show that the proposed method can obtain color consistency result. Compared with the result of traditional method, our method over performsin preserve color and overall precision.
WU Wei , CHENG Xi , GU Guomin . Compound Cluster Center Based Multiple Linear Regression Color Normalization Method for Remote Sensing Image[J]. Journal of Geo-information Science, 2016 , 18(5) : 615 -621 . DOI: 10.3724/SP.J.1047.2016.00615
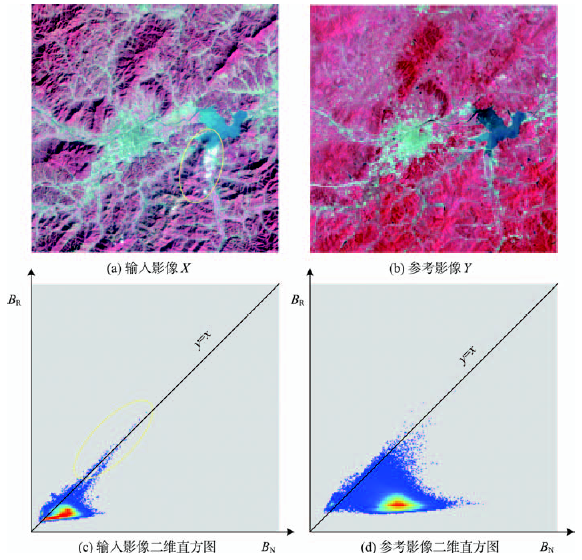
Fig. 1 The principles of multiple dimension histogram specification图1 多维直方图规定化原理 |

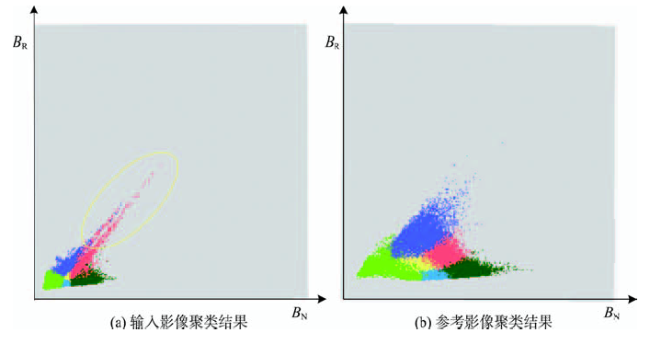
Fig. 2 The result of compound classification图2 复合聚类结果 |
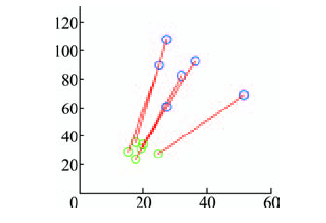
Fig. 3 The figure indicating the mapping method of color normalization图3 色彩归一化方程建立方法示意图 |
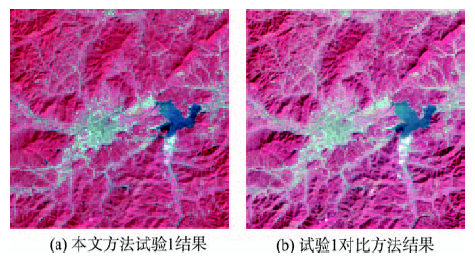
Fig. 4 The result of experiment 1图4 试验1处理结果 |
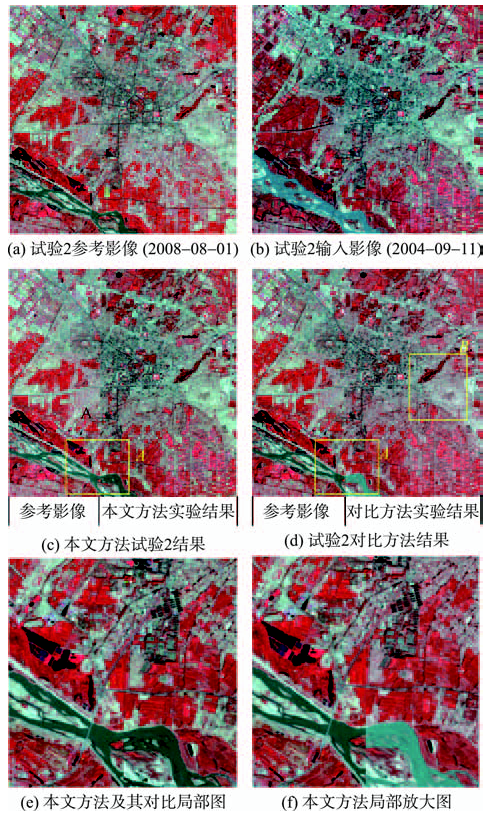
Fig. 5 The original image and result of experiment 2图5 试验2原始影像及其处理结果 |
Tab. 1 The comparison of experiment results表1 试验结果比较 |
| SR | R | C | ||||||||
|---|---|---|---|---|---|---|---|---|---|---|
| BN | BR | BG | BN | BR | BG | BN | BR | BG | ||
| 试验1 | 本文方法 | 129 | 110 | 82 | 7.9 | 6.9 | 9.5 | 0.95 | 0.91 | 0.89 |
| 对比方法 | 109 | 85 | 63 | 10.5 | 9.6 | 11.6 | 0.75 | 0.77 | 0.84 | |
| 试验2 | 本文方法 | 160 | 141 | 127 | 11.3 | 13.1 | 12.5 | 0.82 | 0.85 | 0.84 |
| 对比方法 | 128 | 115 | 105 | 14.6 | 13.5 | 0.80 | 0.79 | |||
The authors have declared that no competing interests exist.
| [1] |
|
| [2] |
|
| [3] |
|
| [4] |
|
| [5] |
|
| [6] |
|
| [7] |
|
| [8] |
|
| [9] |
|
| [10] |
[
|
| [11] |
|
| [12] |
[
|
| [13] |
[
|
| [14] |
|
| [15] |
[
|
| [16] |
|
| [17] |
|
| [18] |
|
| [19] |
|
| [20] |
|
/
| 〈 |
|
〉 |