
Journal of Geo-information Science >
Real-time Rendering and Interactive Visualization of Remote Sensing Big Data
Received date: 2015-12-15
Request revised date: 2016-02-01
Online published: 2016-05-10
Copyright
Data visualization is an important service in remote sensing applications. To address the problems that it is difficult for the static pre-built map tile service to meet the requirements of professional data view, map configuration, spatial analysis and other applications, this paper presented a solution architecture for the real-time rendering and interactive visualization of remote sensing big data. Firstly, on the rendering nodes, a rendering-tile structure for image was constructed to improve the reading speed of remote sensing images. Secondly, on the visualization servers, a data-computing load balancing strategy was proposed to optimize the rendering efficiency of map tiles. Thirdly, a set of service interfaces for the interactive visualization was designed for the front ends of services. Compared with the traditional technology, this solution can not only achieve the real-time rendering and the interactive visualization of remote sensing data, but also obtain an equivalent service performance to the pre-built tile map service. Finally, based on the above solutions, an interactive visualization prototype system of remote sensing data was developed and was applied into the demonstrations of the real-time viewing of remote sensing images, the visualized computing and the visualized analysis.
Key words: RS big data; WMTS; real-time rendering; interactive visualization
ZHOU Ya'nan , ZHAO Wei , FAN Ya'nan . Real-time Rendering and Interactive Visualization of Remote Sensing Big Data[J]. Journal of Geo-information Science, 2016 , 18(5) : 664 -672 . DOI: 10.3724/SP.J.1047.2016.00664
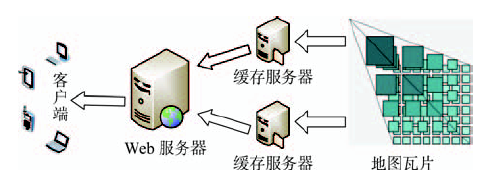
Fig. 1 Pre-built map tile service图1 基于预生成地图瓦片的地图服务 |
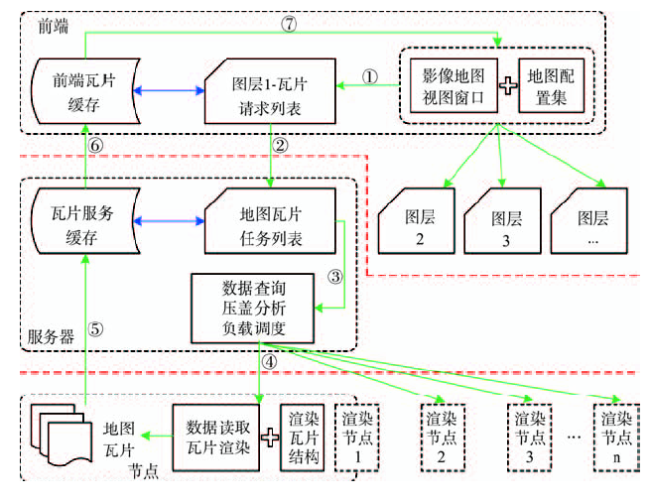
Fig. 2 Flowchart of real-time rendering and interactive visualization图2 实时渲染与交互可视化技术流程 |
Tab. 1 Timings of each step in the map tile service表1 地图瓦片服务各环节耗时比例 |
| 接收请求 | 元数据查询 | 请求下发 | 数据块检索 | 数据块读取 | 瓦片渲染 | 结果返回 | |
|---|---|---|---|---|---|---|---|
| 耗时比例/(%) | 6~9 | 13~16 | 5~7 | 15~17 | 27~33 | 20~24 | 4~9 |
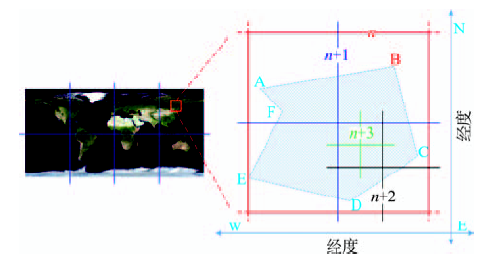
Fig. 3 Spatial partition of an image图3 影像数据空间划分示意 |
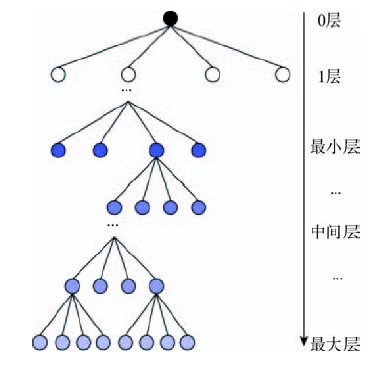
Fig. 4 Quad-tree structure of an image tile pyramid图4 影像渲染瓦片的四叉树层次结构 |
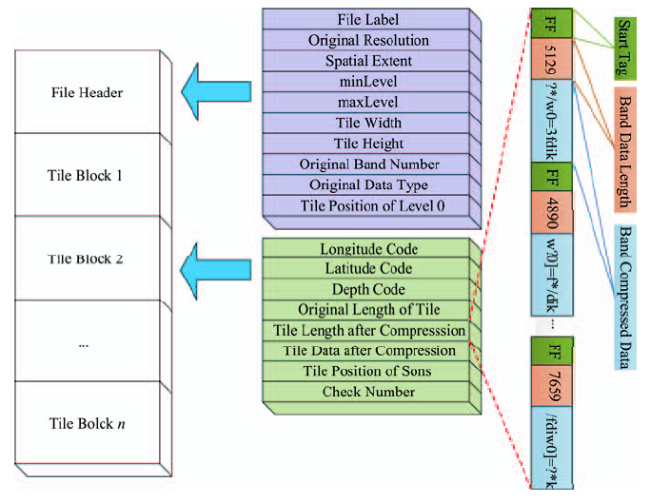
Fig. 5 Storage of image tile pyramid图5 影像瓦片金字塔存储结构 |
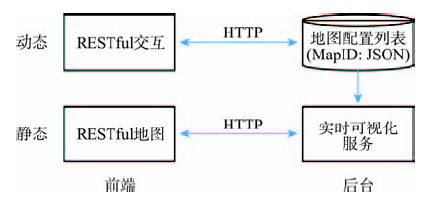
Fig. 6 Design of the real-time interactive map server图6 动态交互地图服务的整体设计 |
Tab. 2 Server interfaces of the interactive maps表2 交互地图的服务接口 |
| 名称 | RESTful接口 | 描述 |
|---|---|---|
| 新建空白地图 | POST:http://mapserver/rastermap/ | 创建一个新的地图,并返回地图的唯一标示字符串 |
| 配置地图 | PUT:http://mapserver/rastermap/{mapid} | 将交互前端生成的地图配置集更新到服务后台实现地图配置 |
| 删除地图 | DEL:http://mapserver/rastermap/{mapid} | 删除已有的影像地图 |
| 缓存地图瓦片 | POST:http://mapserver/tilecache/{mapid} | 生成地图的瓦片缓存,以供静态地图服务用 |
| 载入地图 | GET:http://mapserver/rastermap/{mapid} | 载入已有的地图配置 |
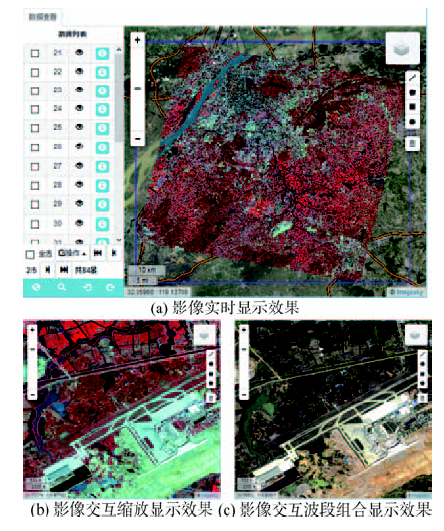
Fig. 7 Demonstration of the data real-time viewing图7 数据实时查看示范 |
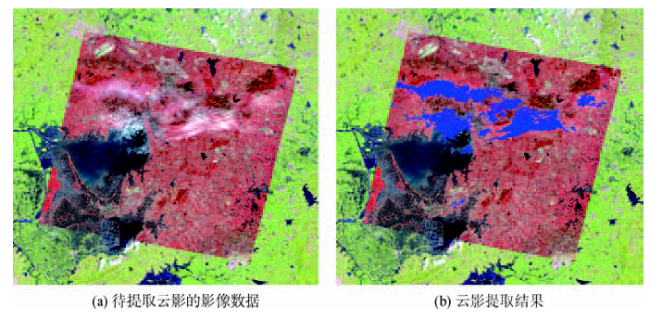
Fig. 8 Demonstration of the visual computing of remote sensing图8 遥感数据可视化计算——云影提取 |
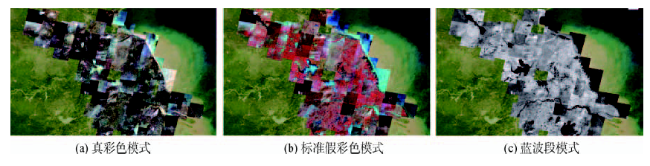
Fig. 9 Demonstration of the visual analysis of remote sensing图9 遥感数据可视化分析——波段组合 |
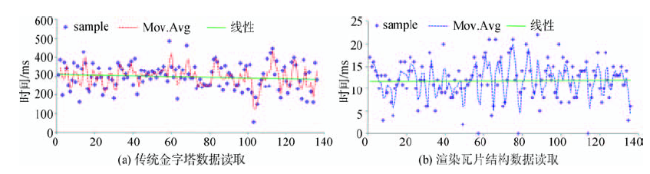
Fig. 10 Efficiency analysis of the data block reading from the rendering-tile structures图10 渲染瓦片结构数据块读取效率分析 |
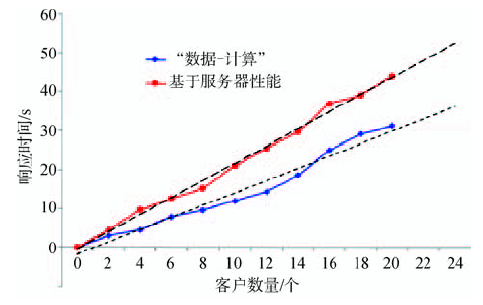
Fig. 11 Performance analysis of the storage-computing task schedule图11 “数据-计算”一致的任务调度策略的性能分析 |
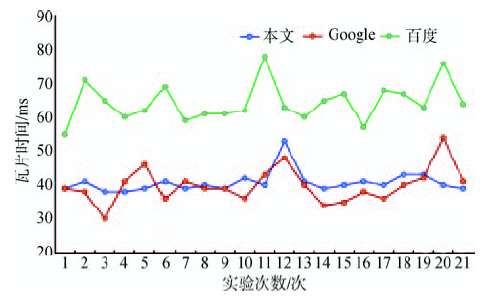
Fig. 12 Response performance of the real-time interactive visualization图12 实时交互可视化的服务响应效率分析 |
The authors have declared that no competing interests exist.
| [1] |
|
| [2] |
|
| [3] |
[
|
| [4] |
|
| [5] |
|
| [6] |
[
|
| [7] |
[
|
| [8] |
|
| [9] |
[
|
| [10] |
[
|
| [11] |
|
| [12] |
|
| [13] |
|
| [14] |
|
| [15] |
|
| [16] |
[
|
| [17] |
[
|
| [18] |
[
|
| [19] |
[
|
/
| 〈 |
|
〉 |