
Journal of Geo-information Science >
Study on the Crop Classification and Planting Area Estimation at Land Parcel Scale Using Multi-sources Satellite Data
Received date: 2015-12-16
Request revised date: 2016-03-31
Online published: 2016-05-10
Copyright
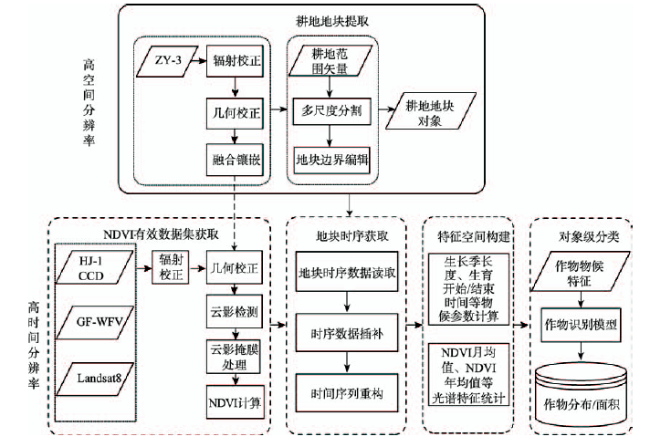
To reduce the missing of remotely sensed data in the spatio-temporal coverage of the cloudy/rainy region and to further meet the urgent need for crop planting information at farmland parcel scale, a method of crop type identification and planting area estimation at parcel scale was developed in this paper by synergistically utilizing the multi-sources satellite imagery,with the support of remote sensing Tupu recognization theory. This method consists of three steps: firstly, based on the high resolution imagery, the objects of farmland parcel with exact boundary were extracted. Secondly, with the effective-data processing technology and the spectral indices calculation based on the multi-temporal medium resolution imagery, the fragmentary effective data was acquired and the time-series data for each object was further obtained. Finally, by constructing a multi-dimensional feature space with the help of time series analysis incorporating the crops’phenological feature, the crop types and their corresponding planting areas were mapped using the Decision Tree classifier. This method had been tested in Ningyuan county, Hunan Province, China. The results showed that, this method can precisely map the different rice types and corresponding planting areas at the farmland parcel scale. The user accuracy of the three rice types, i.e., the early double-season, single-season and late double-season rice,was 94.33%, 90.76 and 95.95%, respectively, and the overall accuracy was 92.51% with a Kappa coefficient of 0.90. The derived area accuracy of these three rice types also reached 93.37%, 91.23% and 95.42%,respectively. This experiment illustrated the effectiveness and usefulness of the proposed method and also provided a salutary lesson for the finely planting information extraction of other crops.
HUANG Qiting , QIN Zelin , ZENG Zhikang . Study on the Crop Classification and Planting Area Estimation at Land Parcel Scale Using Multi-sources Satellite Data[J]. Journal of Geo-information Science, 2016 , 18(5) : 708 -717 . DOI: 10.3724/SP.J.1047.2016.00708
Fig.1 Flow chart of crop planting area extraction based on multi-source satellite data图1 多源遥感数据协同的作物种植面积提取流程图 |
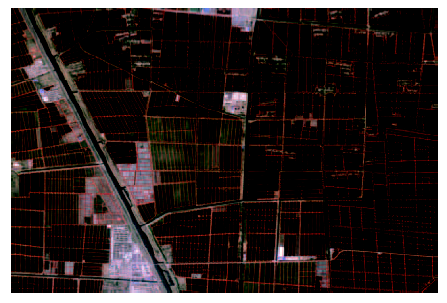
Fig.2 The extraction result of farmland parcel图2 农田地块边界提取结果 |
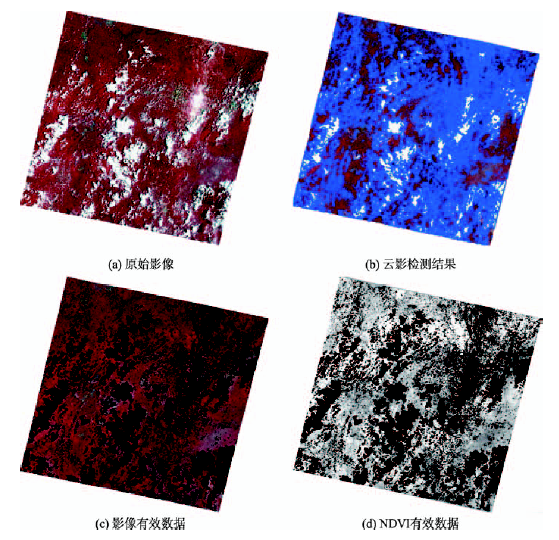
Fig.3 Demonstration of the processed effective imagery data图3 影像数据有效化过程示意图 注:图(c)-(d)中黑色部分为无数据区域 |
Tab.1 Regression models of GF-WVF1 and other satellite sensors表1 GF-WVF1与其它传感器的NDVI回归模型 |
| 传感器 | 拟合方程 | R2 | RMSE |
|---|---|---|---|
| GF1-WFV2 | Y=0.7690X+0.1699 | 0.8977 | 0.0195 |
| GF1-WFV3 | Y=0.8233X+0.1285 | 0.6362 | 0.0416 |
| GF1-WFV4 | Y=0.9195X+0.0446 | 0.7975 | 0.0339 |
| HJ1A-CCD1 | Y=1.0673X+0.0256 | 0.9059 | 0.0209 |
| HJ1A-CCD2 | Y=1.0858X+0.0512 | 0.9018 | 0.0211 |
| HJ1B-CCD1 | Y=0.9157X+0.1765 | 0.7275 | 0.0194 |
| HJ1B-CCD2 | Y=0.8469X+0.1928 | 0.8064 | 0.0328 |
| Landsat8-OLI | Y=0.9018X-0.0387 | 0.7498 | 0.0683 |
注:Y为GF-WVF1传感器的NDVI值;X为其它传感器NDVI值 |
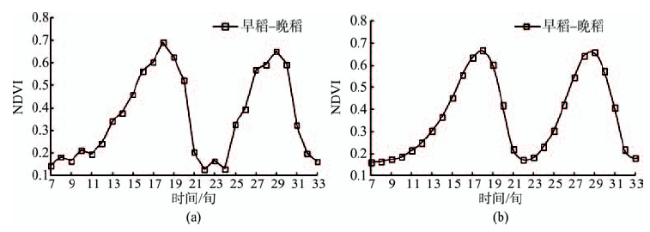
Fig.4 The contrast of NDVI time-series reconstructions for crops图4 作物NDVI时间序列重建效果对比 |
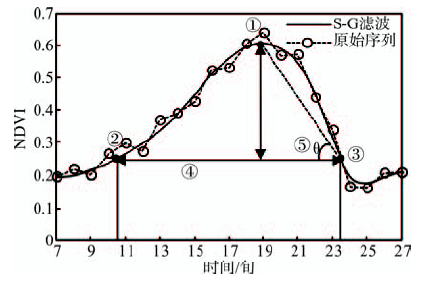
Fig. 5 Remotely sensed phonological features derived from NDVI curve图5 基于NDVI曲线的遥感物候特征示意图 |
Tab. 2 Imagery information of this study表2 研究采用的影像信息 |
| 时间 | 中心经纬度 | 传感器 | 时间 | 中心经纬度 | 传感器 |
|---|---|---|---|---|---|
| 2014-03-17 | E113.1_N25.6 | GF1_WFV3 | 2014-09-21 | E113.2_N26.3 | GF1_WFV1 |
| 2014-03-26 | E111.0_N24.6 | GF1_WFV4 | 2014-09-25 | E111.8_N24.7 | GF1_WFV1 |
| 2014-03-26 | E110.5_N25.2 | GF1_WFV4 | 2014-09-26 | E110.9_N25.9 | GF1_WFV1 |
| 2014-04-04 | E112.8_N27.1 | HJ1B-CCD2 | 2014-10-04 | E112.8_N25.6 | GF1_WFV3 |
| 2014-04-04 | E111.0_N26.8 | HJ1B-CCD2 | 2014-10-08 | E111.6_N25.9 | GF1_WFV2 |
| 2014-04-14 | E110.9_N27.4 | HJ1A-CCD2 | 2014-10-16 | E110.8_N26.3 | GF1_WFV1 |
| 2014-05-01 | E111.3_N25.9 | GF1_WFV2 | 2014-10-16 | E112.8_N25.9 | GF1_WFV2 |
| 2014-05-01 | E113.1_N25.6 | GF1_WFV3 | 2014-10-24 | E111.6_N24.6 | GF1_WFV1 |
| 2014-06-13 | E110.6_N25.2 | HJ1B-CCD2 | 2014-10-24 | E111.9_N26.3 | GF1_WFV1 |
| 2014-06-13 | E110.8_N26.3 | HJ1A-CCD1 | 2014-11-14 | E111.1_N25.9 | GF1_WFV2 |
| 2014-06-15 | E112.0_N25.9 | GF1_WFV2 | 2014-11-18 | E110.8_N26.3 | HJ1B-CCD1 |
| 2014-07-10 | E112.1_N25.6 | GF1_WFV3 | 2014-11-22 | E112.2_N25.9 | GF1_WFV2 |
| 2014-07-18 | E111.6_N25.9 | GF1_WFV2 | 2012-10-01 | E111.8 _N25.5 | ZY3_NAD |
| 2014-07-30 | E111.1_N24.6 | GF1_WFV1 | 2012-10-01 | E111.8 _N25.5 | ZY3_MUX |
| 2014-07-30 | E111.5_N26.3 | GF1_WFV1 | 2012-10-01 | E111.9 _N25.9 | ZY3_NAD |
| 2014-08-03 | E111.7_N24.6 | GF1_WFV1 | 2012-10-01 | E111.9 _N25.9 | ZY3_MUX |
| 2014-08-03 | E112.1_N26.3 | GF1_WFV1 | 2013-08-02 | E112.2_N 25.1 | ZY3_NAD |
| 2014-08-29 | E109.9_N26.8 | HJ1A-CCD1 | 2013-08-02 | E112.2_N 25.1 | ZY3_MUX |
| 2014-09-01 | E112.2_N25.9 | GF1_WFV2 | 2013-08-02 | E112.3_N 25.5 | ZY3_NAD |
| 2014-09-04 | E112.0_N26.4 | HJ1B-CCD1 | 2013-08-02 | E112.3_N 25.5 | ZY3_MUX |
| 2014-09-21 | E112.8_N24.6 | GF1_WFV1 |
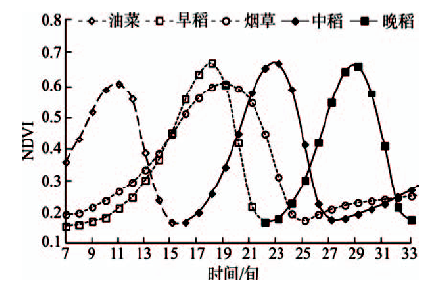
Fig.6 NDVI curves of different crops图6 不同作物的NDVI生长曲线 |
Tab.3 Phenological calendar of the main crops in the study areas表3 研究区主要作物物候历 |
| 作物 | 月份 | |||||||
|---|---|---|---|---|---|---|---|---|
| 3 | 4 | 5 | 6 | 7 | 8 | 9 | 10 | |
| 早稻 | 移栽期 | 分蘖期 | 幼穗发育期 | 成熟期 | ||||
| 晚稻 | 移栽期 | 分蘖期 | 幼穗发育期 | 成熟期 | ||||
| 中稻 | 移栽期 | 分蘖期 | 幼穗发育期 | 成熟期 | ||||
| 烟叶 | 返苗期 | 伸根期 | 旺长期 | 成熟期 | ||||
| 油菜 | 开花期 | 开花期 | 成熟期 | 苗期 | ||||
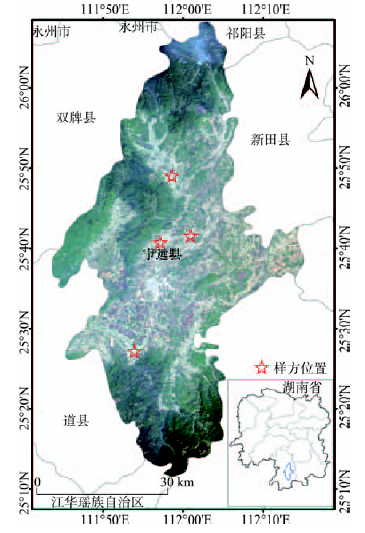
Fig.7 The location of the experimental area图7 研究区位置图 |
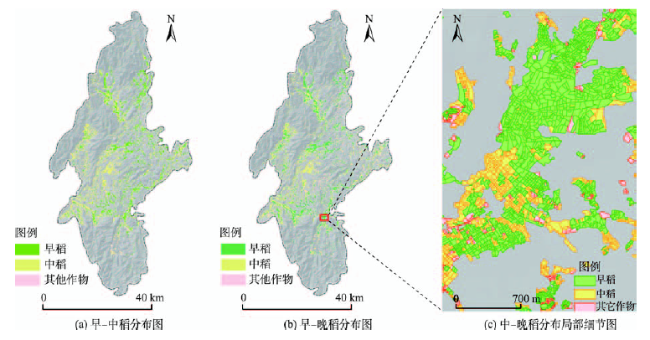
Fig. 8 The distribution of rice types图8 各水稻类型分布图 |
Tab.4 Confusion matrix for rice classification表4 水稻分类混淆矩阵 |
| 类别 | 早稻 | 中稻 | 晚稻 | 其他地类 | 样本总数 | 用户精度/(%) | |
|---|---|---|---|---|---|---|---|
| 早稻 | 416 | 10 | 0 | 15 | 441 | 94.33 | |
| 中稻 | 3 | 285 | 7 | 19 | 314 | 90.76 | |
| 晚稻 | 0 | 10 | 379 | 6 | 395 | 95.95 | |
| 其他地类 | 18 | 12 | 7 | 241 | 278 | 86.69 | |
| 样本总数 | 437 | 317 | 393 | 281 | 1428 | ||
| 制图精度/(%) | 95.19 | 89.91 | 96.44 | 85.77 | |||
| 总体精度/(%) | 92.51 | ||||||
| Kappa系数 | 0.90 |
Tab.5 Accuracy of rice planting area extraction表5 水稻种植面积提取精度 |
| 类别 | 遥感提取面积/千hm2 | 统计数据/千hm2 | 面积精度/(%) |
|---|---|---|---|
| 早稻 | 12.96 | 13.88 | 93.37 |
| 中稻 | 11.13 | 12.20 | 91.23 |
| 晚稻 | 13.32 | 13.96 | 95.42 |
| 总计 | 37.41 | — | — |
| 平均 | — | — | 93.43 |
The authors have declared that no competing interests exist.
| [1] |
|
| [2] |
|
| [3] |
|
| [4] |
|
| [5] |
|
| [6] |
|
| [7] |
|
| [8] |
|
| [9] |
|
| [10] |
|
| [11] |
|
| [12] |
|
| [13] |
|
| [14] |
|
| [15] |
[
|
| [16] |
[
|
| [17] |
|
| [18] |
[
|
| [19] |
[
|
| [20] |
[
|
| [21] |
|
| [22] |
[
|
/
| 〈 |
|
〉 |