
Journal of Geo-information Science >
Efficiency and Accuracy Analysis of Multispectral Image Classification Based on mRMR Feature Selection Method
Received date: 2015-10-27
Request revised date: 2015-12-04
Online published: 2016-06-10
Copyright
Image classification is a popular research topic in the field of remote sensing. This technology has been widely used in environmental protection, military, urban planning, and other fields. Interfering by the massive feature information of remote sensing image, applying the reasonable feature selection approach in the progress of image classification becomes critical for improving the efficiency and accuracy of classification. This paper extracts the image feature data from the ZY3 satellite multispectral image of Huainan region, and studies the mRMR (minimal-Redundancy-Maximal-Relevance) feature selection method. This algorithm has a simple core principle and low requirement of data. The core problem of this algorithm is the computation of mutual information. The mRMR algorithm is initially applied in the field of bioscience, such as the gene expression analysis, and it is not widely used in the field of remote sensing. This research uses three methods (the binary discretization, histogram method and F-statistic) to realize the computation process of mRMR algorithm. And two classifiers (the C5.0 decision tree and k-nearest neighbour) are used for the classification based on three types of feature selection results and the total feature information. Moreover, the visual interpretation is used to verify the image classification results from these different methods. The study shows that the results produced by different mRMR computation processes are distinct regarding to different classifiers. In terms of efficiency, all methods can improve the efficiency of C5.0 and KNN. The classification efficiency is increased by 36.84% for C5.0 and by 72.05% for KNN. In terms of accuracy, all method can maintain the accuracy of C5.0 while improve the accuracy of KNN. The total classification accuracy and Kappa coefficient are increased for C5.0 by 0.60% and 0.80%, respectively. The total classification accuracy is increased by 4.34% and the Kappa coefficient is increased by 7.90% for KNN. In summary, the feature selection method based on the mRMR algorithm is effective in the procedure of multispectral image classification.
CHENG Ximeng , SHEN Zhanfeng , XING Tingyan , XIA Liegang , WU Tianjun . Efficiency and Accuracy Analysis of Multispectral Image Classification Based on mRMR Feature Selection Method[J]. Journal of Geo-information Science, 2016 , 18(6) : 815 -823 . DOI: 10.3724/SP.J.1047.2016.00815
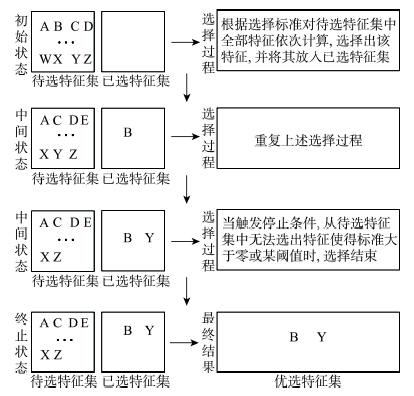
Fig. 1 Schematic diagram of the incremental search algorithm图1 渐进式搜索算法示意图 |
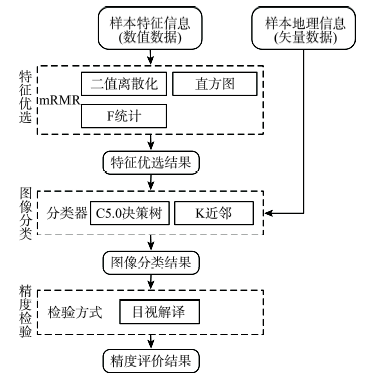
Fig.2 Flowchart of the experiment图2 实验流程图 |
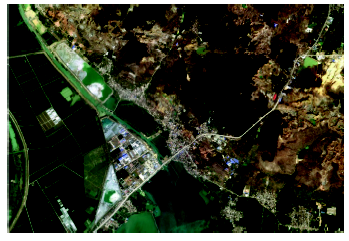
Fig. 3 Remote sensing image of the study area图3 研究区遥感影像图 |
Tab. 1 Feature information表1 特征信息 |
| 特征类型 | 特征名称 | 特征数目 |
|---|---|---|
| 光谱特征 | 第1-4波段均值、第1-4波段标准差、NDWI均值、NDWI标准差、NDVI均值、NDVI标准差 | 12 |
| 几何特征 | 长、宽、长宽比、像元数目、边长、形状指数、角点数目 | 7 |
| 空间关系 | 紧致度、主方向 | 2 |
| 纹理特征 | 同质性、对比度、相异性、角二阶矩、熵、相关性 | 6 |
Tab. 2 The result of feature selection based on the mRMR algorithm表2 mRMR算法特征优选结果 |
| 计算方法 | 优选特征名称 | 优选特征数目 |
|---|---|---|
| BD | NDVI均值、第1波段均值、NDWI均值、第3波段均值、第4波段均值、第1波段标准差、第2波段均值、角二阶矩、相关性、同质性、第2波段标准差、第3波段标准差、相异性、对比度、熵、第4波段标准差、NDWI标准差、NDVI标准差、长宽比、主方向 | 20 |
| HM | NDWI均值、第1波段均值、相关性、同质性、第4波段均值、第1波段标准差、NDVI均值、第3波段均值、第4波段标准差、角二阶矩、第2波段均值、相异性、第3波段标准差、第2波段标准差、熵、对比度、NDVI标准差、NDWI标准差 | 18 |
| F | NDWI均值、NDVI均值、第4波段均值、第3波段均值、相关性 | 5 |
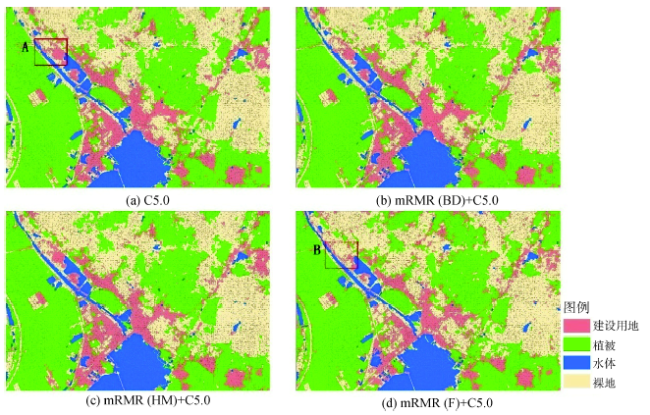
Fig. 4 C5.0 decision tree classification renderings图4 C5.0决策树分类效果图 |
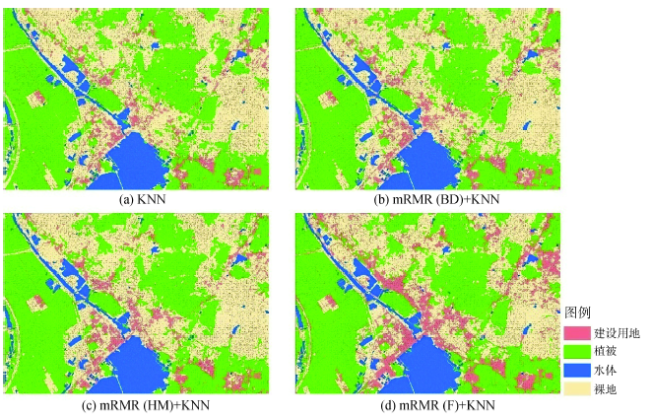
Fig. 5 K-nearest neighbour classification renderings图5 K近邻分类效果图 |
Tab. 3 Comparison of the efficiency and accuracy between C5.0 classification methods表3 C5.0分类效率精度对比 |
| 方法组合 | 分类时间/s | 总体分类精度/(%) | Kappa系数 |
|---|---|---|---|
| C5.0 | 1.349 | 83.5 | 0.747 |
| C5.0+BD | 1.209 | 82.0 | 0.724 |
| C5.0+HM | 1.157 | 84.0 | 0.753 |
| C5.0+F | 0.852 | 82.0 | 0.725 |
Tab. 4 Comparison of the efficiency and accuracy between KNN classification methods表4 KNN分类效率精度对比 |
| 方法组合 | 分类时间/s | 总分类精度/(%) | Kappa系数 |
|---|---|---|---|
| KNN | 276.014 | 80.5 | 0.696 |
| KNN+BD | 212.306 | 84.0 | 0.751 |
| KNN+HM | 195.178 | 82.0 | 0.719 |
| KNN+F | 77.156 | 81.0 | 0.705 |
Tab. 5 Comparison of the efficiency and accuracy between different feature selection methods表5 基于不同特征优选算法分类效率精度对比 |
| 方法组合 | 分类时间/s | 总体分类精度/(%) | Kappa系数 |
|---|---|---|---|
| C5.0 | 1.349 | 83.5 | 0.747 |
| C5.0+mRMR | 1.073 | 82.7 | 0.734 |
| C5.0+PCA | 0.924 | 78.0 | 0.658 |
| KNN | 276.014 | 80.5 | 0.696 |
| KNN+mRMR | 161.547 | 82.3 | 0.725 |
| KNN+PCA | 88.303 | 80.0 | 0.689 |
注:C5.0+mRMR与KNN+mRMR统计数值均为二值离散化、直方图法、F统计法3种不同计算方法的统计结果平均值 |
The authors have declared that no competing interests exist.
| [1] |
[
|
| [2] |
[
|
| [3] |
[
|
| [4] |
[
|
| [5] |
|
| [6] |
[
|
| [7] |
[
|
| [8] |
[
|
| [9] |
[
|
| [10] |
|
| [11] |
[
|
| [12] |
|
| [13] |
[
|
| [14] |
[
|
| [15] |
[
|
| [16] |
[
|
| [17] |
|
| [18] |
|
| [19] |
[
|
| [20] |
[
|
| [21] |
[
|
| [22] |
[
|
| [23] |
[
|
| [24] |
|
/
| 〈 |
|
〉 |