
Journal of Geo-information Science >
Temporal and Spatial Variation Analysis of the Area of Siling Co Lake in Tibet Based on ESTARFM (1976-2014)
Received date: 2015-07-09
Request revised date: 2015-09-18
Online published: 2016-06-10
Copyright
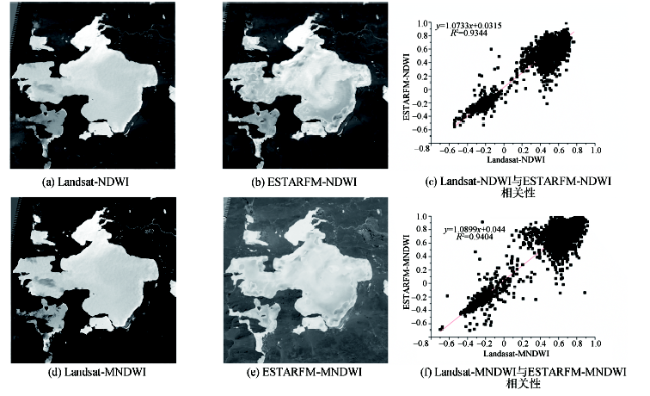
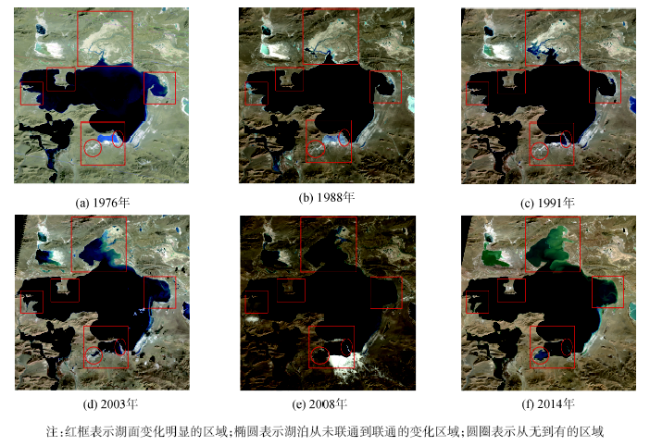
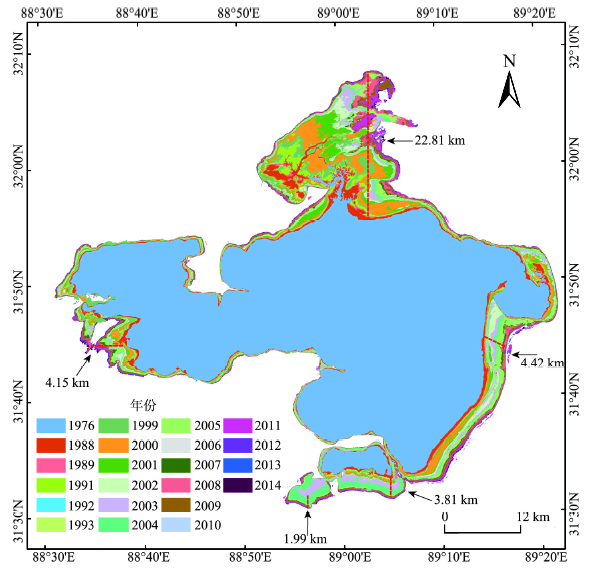
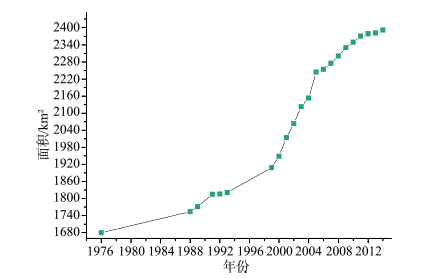
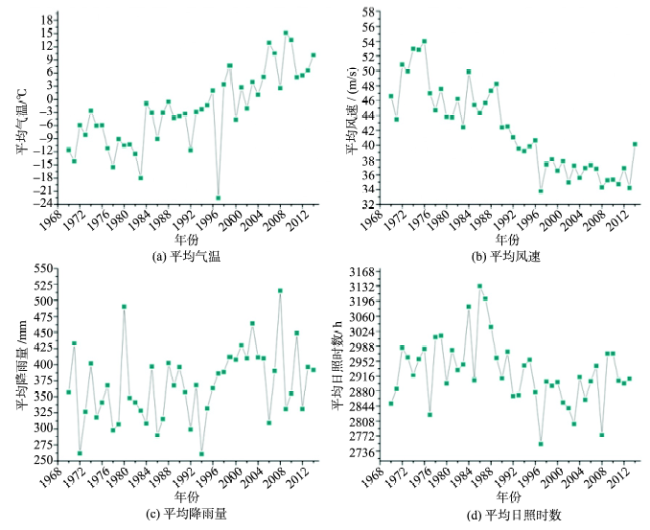
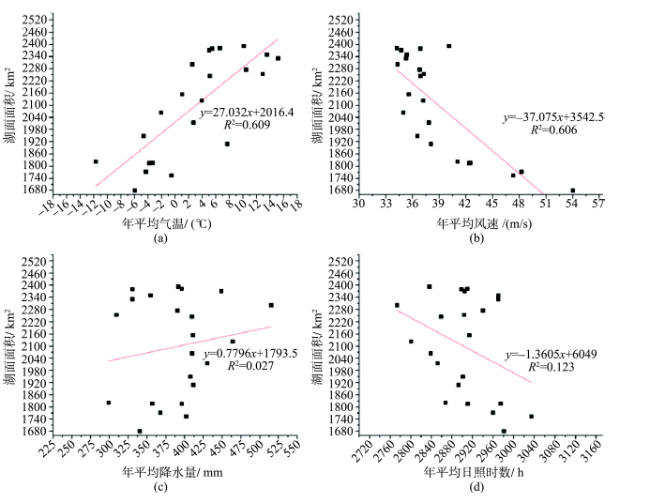
Lakes, especially the inland lakes, are sensitive to global climate change, which are the indicator of environmental variation. The area of lakes can reflect local climate change information. Thus, the rapid and accurate monitor of the dynamic change of the lake area is of great significance to analyze regional ecological environment. Based on MODIS data, this study used ESTARFM to simulate the Landsat data which are unavailable after 2000, and utilized two types of water index assisted by DEM data to analyze the dynamic area change of Siling Co Lake in Tibet from 1976 to 2014. Then, we analyzed the reasons of lake area change and its respond to climate change using the meteorological data acquired by six adjacent meteorological stations from 1976 to 2014. Conclusions can be made according to the results as the following statements. (1) The Landsat-like data acquired by ESTARFM was consistent to the real Landsat data in water information extraction, whose determination coefficient can reach a value of greater than 0.93. So, the fused data can be applied to extract the information of lakes. (2) Siling Co kept expanding from 1976 to 2014, the area of which increased approximately 711.652 km2, which is 42.36% larger. The average annual growth was about 18.728 km2, and the largest annual increase was up to 55.954 km2. The whole process of lake area change can be divided into three stages: the smooth change, the rapid change, and the smooth change again. The northern region changed most obviously, extending northward for about 22.812 km2. From 2003 to 2005, the southern region was integrated with Ya Gencuo Lake, and then they expanded together. (3) The snow-ice melting water supply caused by global warming might be the main reason for lake spread, and the decrease of wind speed was the secondary factor. However, the amount of precipitation and sunshine duration were poorly related to the lake area change.
HAO Guibin , WU Bo , ZHANG Lifu , FU Dongjie , LI Yao . Temporal and Spatial Variation Analysis of the Area of Siling Co Lake in Tibet Based on ESTARFM (1976-2014)[J]. Journal of Geo-information Science, 2016 , 18(6) : 833 -846 . DOI: 10.3724/SP.J.1047.2016.00833
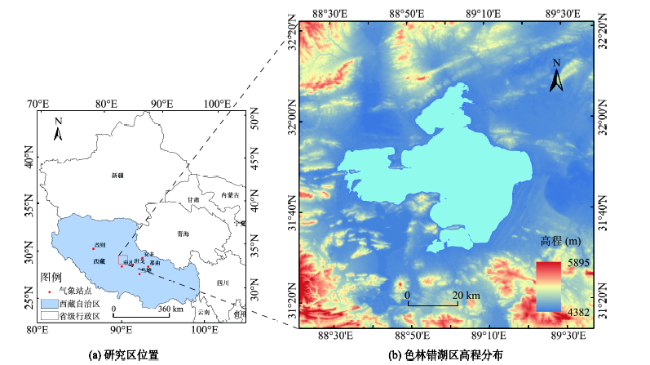
Fig. 1 The location and DEM distribution of Siling Co Lake图1 研究区位置及色林错湖区高程分布 |
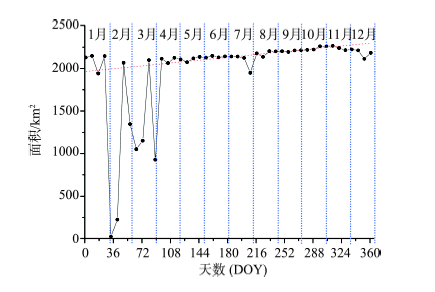
Fig. 2 Area changes of Siling Co Lake during the year图2 色林错湖面积的年内变化 |
Tab. 1 The list of available Landsat data in November表1 现有的11月Landsat数据列表 |
| 年份 | 日期(DOY) | 传感器类型 | 行号/列号 | 空间分辨率/m |
|---|---|---|---|---|
| 1976 | 11-13(318) | MSS | 150/38 | 60 |
| 1988 | 11-30(335) | TM | 139/38 | 30 |
| 1989 | 11-18(322) | TM | 139/38 | 30 |
| 1991 | 11-08(312) | TM | 139/38 | 30 |
| 1992 | 11-10(315) | TM | 139/38 | 30 |
| 1993 | 11-13(317) | TM | 139/38 | 30 |
| 1999 | 11-06(310) | ETM+ | 139/38 | 30 |
| 2000 | 11-08(313) | ETM+ | 139/38 | 30 |
| 2001 | 11-11(315) | ETM+ | 139/38 | 30 |
| 2002 | 11-30(334) | ETM+ | 139/38 | 30 |
| 2003 | 11-09(313) | TM | 139/38 | 30 |
| 2004 | 11-02(307) | TM | 139/38 | 30 |
| 2005 | 11-14(318) | TM | 139/38 | 30 |
| 2009 | 10-31(308) | TM | 139/38 | 30 |
| 2014 | 11-07(311) | OLI | 139/38 | 30 |
Tab. 2 The list of Landsat-Like data needed to predict in November表2 需要预测的11月Landsat-Like数据列表 |
| 年份 | 预测日期(DOY) | 利用的TM数据日期(DOY) | 利用的MODIS数据日期(DOY) |
|---|---|---|---|
| 2006 | 313 | 273 337 | 273 337 |
| 2007 | 313 | 276 | 273 |
| 2008 | 313 | 279 | 281 |
| 2010 | 313 | 220 364 | 217 361 |
| 2011 | 313 | 239 | 241 |
| 2012 | 313 | 282 346 | 281 345 |
| 2013 | 313 | 212 340 | 209 337 |
Tab. 3 Landsat and MODIS band settings and corresponding relationships表3 Landsat数据与MODIS数据波段设置及对应关系 |
| 光谱范围 | Landsat TM波段(分辨率/m) | 波段范围/μm | MODIS波段(分辨率/m) | 波段范围/μm |
|---|---|---|---|---|
| 可见光(蓝) | B1(30) | 0.450~0.520 | B3(500) | 0.459~0.479 |
| 可见光(绿) | B2(30) | 0.520~0.600 | B4(500) | 0.545~0.565 |
| 可见光(红) | B3(30) | 0.620~0.690 | B1(250) | 0.620~0.670 |
| 近红外 | B4(30) | 0.760~0.900 | B2(250) | 0.841~0.876 |
| 中红外 | B5(30) | 1.550~1.750 | B6(500) | 1.628~1.652 |
| 热红外 | B6(60) | 1.040~1.250 | B5(500) | 1.230~1.250 |
| 中红外 | B7(30) | 2.080~2.350 | B7(500) | 2.105~2.155 |
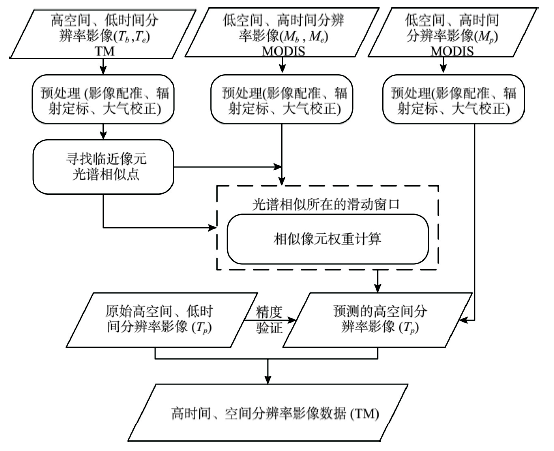
Fig. 3 Flow chart of data fusion图3 时空数据融合流程 |
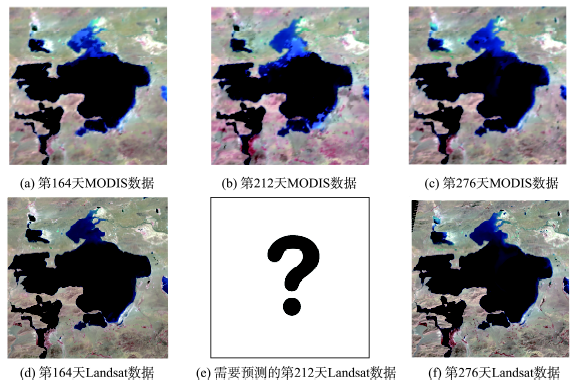
Fig. 4 The input data of data fusion by the ESTARFM图4 ESTARFM时空融合输入数据情况 |
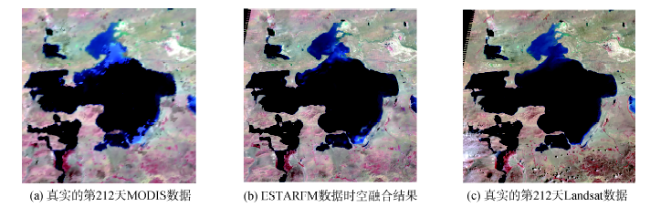
Fig. 5 Comparison of the data fusion results by ESTARFM图5 ESTARFM时空融合结果对比 |
Fig. 6 Comparison of two types of water index and the correlation of data fusion by ESTARFM and the actual Landsat图6 融合结果与真实的Landsat数据计算的2种水体指数对比及相关性 |
Fig. 7 Remote sensing images of Siling Co Lake from 1976 to 2014图7 1976-2014年色林错湖遥感影像监测 |
Fig. 8 Spatial distributions and changes of Siling Co Lake from 1976 to 2014图8 1976-2014年色林错湖空间分布及面积变化 |
Tab. 4 Water area derived from Landsat and MODIS data for Siling Co Lake from 1976 to 2014(km2)表4 色林错湖各年份湖泊面积统计表(km2) |
| 年份 | Landsat面积 | MODIS面积 | 年份 | Landsat面积 | MODIS面积 |
|---|---|---|---|---|---|
| 1976 | 1679.911 | - | 2004 | 2153.267 | 2139 |
| 1988 | 1753.616 | - | 2005 | 2244.368 | 2245.5 |
| 1989 | 1771.530 | - | 2006 | 2254.180 | 2258.5 |
| 1991 | 1814.634 | - | 2007 | 2275.484 | 2272 |
| 1992 | 1815.849 | - | 2008 | 2301.161 | 2294 |
| 1993 | 1821.047 | - | 2009 | 2330.384 | 2308 |
| 1999 | 1908.646 | - | 2010 | 2349.389 | 2336.75 |
| 2000 | 1948.622 | 1955 | 2011 | 2370.803 | 2370.25 |
| 2001 | 2014.540 | 2011.5 | 2012 | 2379.063 | 2385 |
| 2002 | 2063.507 | 2053.5 | 2013 | 2381.619 | 2383.75 |
| 2003 | 2122.813 | 2122 | 2014 | 2391.563 | 2392.75 |
Fig. 9 Spatial and temporal variation of Siling Co Lake from 1976 to 2014图9 1976-2014年色林错湖湖面面积时空变化 |
Fig. 10 Inter-annual variability of meteorological elements in Siling Co Lake from 1970 to 2014图10 1970-2014年色林错湖区各气象要素的年际变化 |
Fig. 11 Correlation between the area and the meteorological elements图11 色林错湖的湖面面积与各气象要素之间的相关性 |
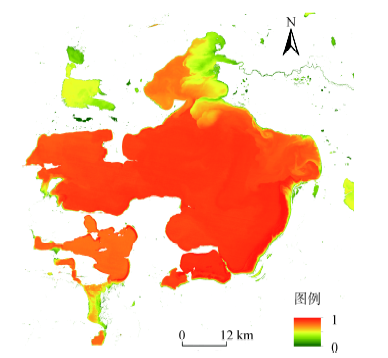
Fig. 12 Relative water depth distribution of Siling Co Lake图12 色林错湖相对水深分布 |
The authors have declared that no competing interests exist.
| [1] |
|
| [2] |
|
| [3] |
|
| [4] |
[
|
| [5] |
[
|
| [6] |
[
|
| [7] |
[
|
| [8] |
|
| [9] |
[
|
| [10] |
[
|
| [11] |
[
|
| [12] |
|
| [13] |
[
|
| [14] |
|
| [15] |
[
|
| [16] |
|
| [17] |
|
| [18] |
[
|
| [19] |
|
| [20] |
[
|
| [21] |
|
| [22] |
|
| [23] |
|
| [24] |
|
| [25] |
[
|
| [26] |
|
| [27] |
|
| [28] |
[
|
| [29] |
[
|
| [30] |
[
|
| [31] |
|
| [32] |
|
| [33] |
[
|
| [34] |
[
|
| [35] |
[
|
| [36] |
[
|
| [37] |
[
|
/
| 〈 |
|
〉 |