
Journal of Geo-information Science >
Method of Automatic Shoulder Line Extraction in the Loess Hilly Area Based on Point Cloud Data
Received date: 2015-11-30
Request revised date: 2016-01-25
Online published: 2016-07-15
Copyright
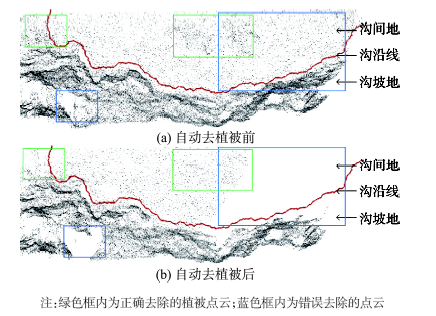
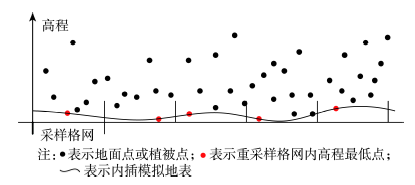
Shoulder line is one of the most distinguishing terrain structure lines in Loess Plateau. However, in the loess hilly area, the point cloud near the shoulder line is usually erased mistakenly while using the unified vegetation removal algorithm, which could result in the decrease of DEM accuracy in the terrain expression. Thus the shoulder line should be extracted firstly before removing the vegetation. This paper has proposed a novel shoulder line extraction method based on point cloud data using the multi-scale sampling and slope threshold segmentation. Firstly, a surface model was built based on the ground points selected by a proper filter window. Then, based on the constructed surface model, the slope was calculated and a significant difference near the shoulder line would emerge. Finally, the shoulder line was generated using the slope threshold segmentation. Through the multi-iterative experiments, the optimal filter sizes for each of the 8 sample areas were found, and a power function between the filter size and the point density was discovered. The correctness and reasonability of this correlation was verified in another 5 test areas. Then, the shoulder line of the whole area was generated by using this verified correlation. Using the overlay analysis over the manual identification result, the extracted shoulder line has an accuracy of 85% (within a 0.5 m buffer area). As a conclusion, this method could contribute to improve the accuracy of vegetation removal algorithm that uses the point cloud data for the loess hilly area.
Key words: point cloud; terrestrial 3D laser scanner; shoulder line; DEM; loess hilly area
LI Min , YANG Xin , CHEN Panpan , XIONG Liyang . Method of Automatic Shoulder Line Extraction in the Loess Hilly Area Based on Point Cloud Data[J]. Journal of Geo-information Science, 2016 , 18(7) : 869 -877 . DOI: 10.3724/SP.J.1047.2016.00869
Fig.1 Comparison of the point cloud before and after using RiScan Pro software to remove the vegetation automatically图1 利用RiScan PRO软件进行自动去植被前后的对比 |
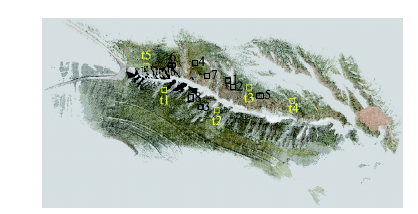
Fig.2 The distribution map of point clouds data and the sample areas of Madigou图2 麻地沟实验区点云数据及样区分布图 |
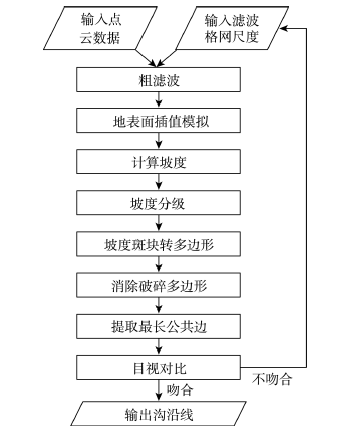
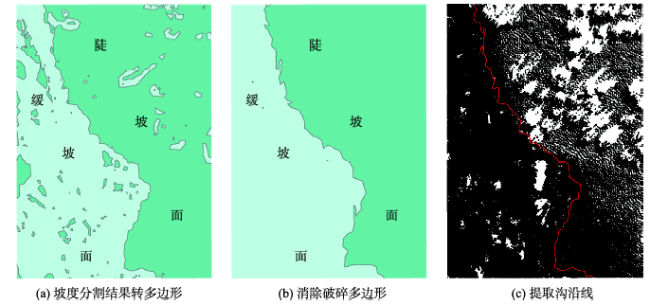
Fig.3 The schema of shoulder line extractionbased on point cloud图3 基于点云的沟沿线提取流程图 |
Fig.4 Select the ground points and simulate the land surface map图4 选取地面点进行地表面模拟示意图 |
Fig.5 Illustration of the longest common side extraction图5 提取最长公共边原理示意图 |
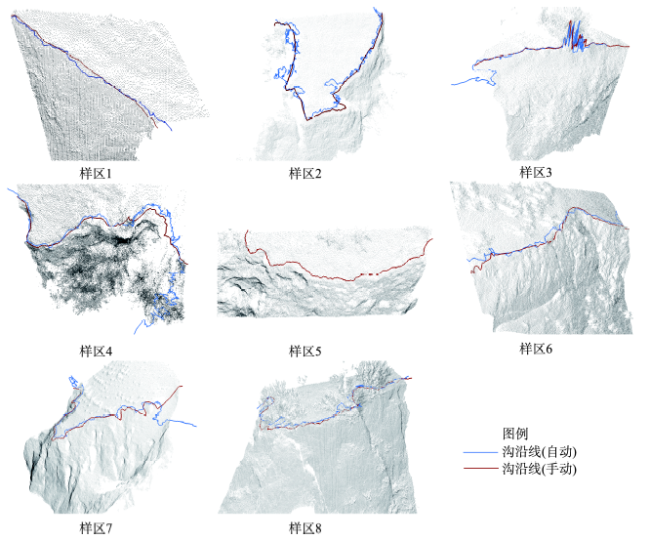
Fig.6 Point clouds of 8 test areas displayed in 3D图6 8个样区的点云数据在三维显示 |
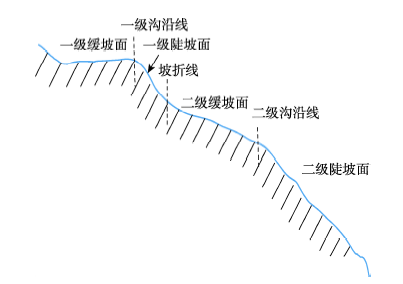
Fig.7 The hatch of two grades of shoulder lines in the test area 3图7 样区3两级沟沿线剖面图 |
Tab.1 Accuracy comparison of automatically and manually extracted shoulder lines表1 自动提取沟沿线与手绘沟沿线精度对比 |
| 样区编号 | 0.1 m缓冲范围/(%) | 0.5 m缓冲范围/(%) | 1 m缓冲范围/(%) |
|---|---|---|---|
| 1 | 82 | 100 | 100 |
| 2 | 42 | 92 | 100 |
| 3 | 68 | 90 | 100 |
| 4 | 37 | 70 | 73 |
| 5 | 43 | 100 | 100 |
| 6 | 21 | 76 | 88 |
| 7 | 7 | 53 | 99 |
| 8 | 43 | 99 | 100 |
Tab.2 Length comparison of automatically and manually extracted shoulder lines (unit: m)表2 自动与手动提取的沟沿线长度分析(m) |
| 样区编号 | 沟沿线长度L1(自动) | 沟沿线长度L2(手动) | L1/L2 |
|---|---|---|---|
| 1 | 5.13 | 4.21 | 1.22 |
| 2 | 46.90 | 16.86 | 2.78 |
| 3 | 31.96 | 7.20 | 4.44 |
| 4 | 34.37 | 12.74 | 2.70 |
| 5 | 15.32 | 10.25 | 1.49 |
| 6 | 42.43 | 32.91 | 1.28 |
| 7 | 118.47 | 83.59 | 1.41 |
| 8 | 44.08 | 20.56 | 2.14 |
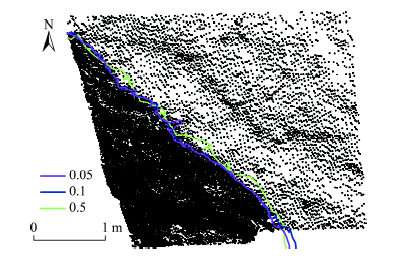
Fig.8 Shoulder lines extracted in multi-scale filter grids图8 多尺度滤波格网下的沟沿线 |
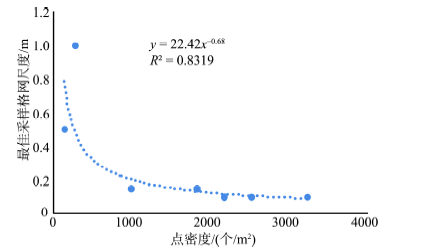
Fig.9 The relationship between optimal filter grid scale and point density图9 最佳采样格网尺度与点密度的关系 |
Tab.3 The information statistics of 8 test areas and the testing best grid scales表3 8个样区的信息统计及测试的最佳采样格网尺度 |
| 样区编号 | 点数/个 | 面积/m2 | 密度/(个/m2) | 格网尺度/m |
|---|---|---|---|---|
| 1 | 25 456 | 11.73 | 2170 | 0.10 |
| 2 | 74 954 | 76.34 | 982 | 0.15 |
| 3 | 80 365 | 31.98 | 2513 | 0.10 |
| 4 | 94 076 | 51.54 | 1825 | 0.15 |
| 5 | 110 384 | 34.11 | 3236 | 0.10 |
| 6 | 142 809 | 537.62 | 266 | 1.00 |
| 7 | 293 848 | 2173.08 | 135 | 0.50 |
| 8 | 310 510 | 112.36 | 2764 | 0.30 |
Tab.4 The optimal filter grid scale of each examination area表4 5个测试样区最佳采样格网尺度 |
| 测试样区 | 点数/个 | 面积/m2 | 密度/(个/m2) | 格网尺度(计算)/m | 格网尺度(测试)/m |
|---|---|---|---|---|---|
| 1 | 19 876 | 59.01 | 337 | 0.12 | 0.12 |
| 2 | 20 682 | 60.07 | 344 | 0.12 | 0.15 |
| 3 | 48 913 | 487.99 | 100 | 0.52 | 0.5 |
| 4 | 151 305 | 606.13 | 250 | 0.17 | 0.2 |
| 5 | 556 679 | 975.03 | 571 | 0.06 | 0.1 |
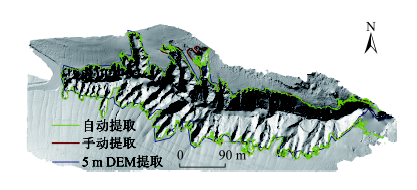
Fig.10 Comparison of the shoulder lines extracted automatically, manually and with the 5 m DEM图10 完整区域沟沿线的自动提取、手动提取及5 m分辨率DEM提取套合 |
The authors have declared that no competing interests exist.
| [1] |
|
| [2] |
|
| [3] |
|
| [4] |
|
| [5] |
|
| [6] |
|
| [7] |
|
| [8] |
|
| [9] |
|
| [10] |
|
| [11] |
|
| [12] |
|
| [13] |
|
| [14] |
[
|
| [15] |
[
|
| [16] |
[
|
| [17] |
[
|
| [18] |
[
|
| [19] |
[
|
| [20] |
[
|
| [21] |
[
|
| [22] |
[
|
| [23] |
[
|
| [24] |
[
|
| [25] |
[
|
| [26] |
[
|
| [27] |
[
|
| [28] |
[
|
| [29] |
[
|
| [30] |
[
|
/
| 〈 |
|
〉 |