
Journal of Geo-information Science >
Analysis of NDVI Time Series in Grassland Open-cast Coal Mines Based on SSA-Mann Kendall
Received date: 2016-02-28
Request revised date: 2016-05-08
Online published: 2016-08-10
Copyright
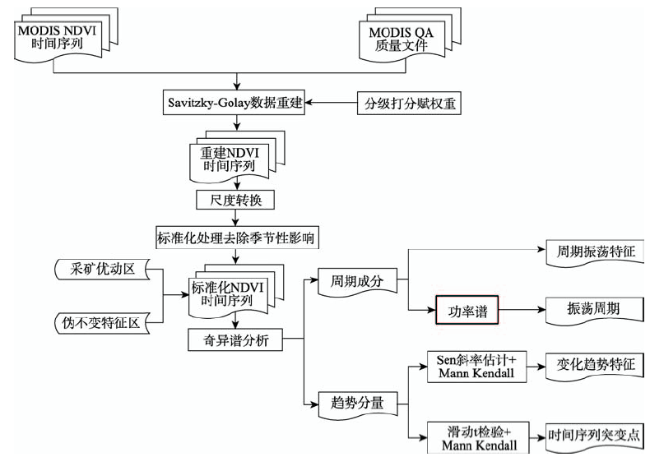
Vegetation index time series have difficulty to depict the detailed response of vegetation dynamics to coal mining and the signals of change trend and periodic oscillation at an inter-annual scale. While at the monthly scale, the signals are so weak that they are hard to be extracted due to the disturbance of vegetation phenology. In addition, the physical significance of the transformation detection algorithm is still unclear. In order to solve these problems and to reveal the change trend and periodic oscillation of vegetation growth in the disturbance area of grassland open-cast mine, this paper selected Shengli open-cast mine area as an study area to extract, amplify and quantitatively compute the signals of the monthly change trend and periodic oscillation based on the MODIS NDVI time series from January 2001 to December 2013 in the mining disturbance area and the unchanged feature region. SSA-Man Kendall was adopted to extract the change trend and periodic oscillation. Moreover, we quantitatively analyzed the significant degree and jump time. For the change trend, the Sen slope of the change components were calculated, which could indicates the change direction. Then the trend significance was measured based on the results of Mann Kendall trend analysis. Combined with the moving-t test for some fuzzy catastrophe points, the time points of abrupt changes were also detected. For the periodic oscillation, it was estimated based on the utilization of power spectrum analysis. The evolution characteristics of NDVI time series′ periodic oscillation in different feature regions were also studied. The results show that SSA-Mann Kendall can effectively extract the signals of change trend and be competent in depicting the periodic oscillation at different time scales, as well as quantitatively express the change trend signals. A downward trend of NDVI time series in the stopes is significant, and it is more significant than the waste dumps within the same mine area, while the trend in the unchanged feature region is relative stable. In addition, damage of vegetation is a sudden event in the grassland opencast mine area, and the catastrophe points of NDVI time series usually occur at the beginning of the mine construction. In the partial open-cast mines, NDVI time series′ periodic oscillation in the stopes and waste dumps are different, which are related to the different disturbance forms within these areas. In particular, the vegetation almost vanishes in the stopes with coal mining, however, the dynamics of vegetation growth are more complex in the waste dumps due to the effective vegetation restoration.
JIA Duo , MU Shouguo , ZHAO Hua . Analysis of NDVI Time Series in Grassland Open-cast Coal Mines Based on SSA-Mann Kendall[J]. Journal of Geo-information Science, 2016 , 18(8) : 1110 -1122 . DOI: 10.3724/SP.J.1047.2016.01110
Fig.1 Location map of Shengli open-cast mine area图1 胜利矿区位置图 注:A为露天锗矿;B为西三号露天矿;C为西一号露天矿;D为东三号露天矿 |
Tab.1 MODIS VI quality data field表1 MODIS VI质量数据域 |
| 比特位 | 含义 | 比特位 | 含义 | 比特位 | 含义 |
|---|---|---|---|---|---|
| 0-1 | VI质量总评 | 8 | 云边界 | 11-13 | 陆地/水域标记 |
| 2-5 | VI可用性 | 9 | 大气二向性校正 | 14 | 雪/冰 |
| 6-7 | 气溶胶含量 | 10 | 混合云 | 15 | 云阴影 |
Tab.2 VI quality overall assessment data表2 VI质量总评数据 |
| VI质量总评指数 | 质量描述 | 权重 |
|---|---|---|
| 0 | 产生质量较高的植被指数数据 | 1 |
| 1 | 产生植被指数但需参考其他QA数据 | 0.6 |
| 2 | 产生植被指数但大部分像元受云影响 | 0.2 |
| 3 | 因其他原因无植被指数 | 0 |
Fig.2 Flow chart of SSA-Mann Kendall based NDVI time series in the grassland open-cast mine area图2 基于SSA-Mann Kendall草原露天矿区NDVI时间序列分析流程 |
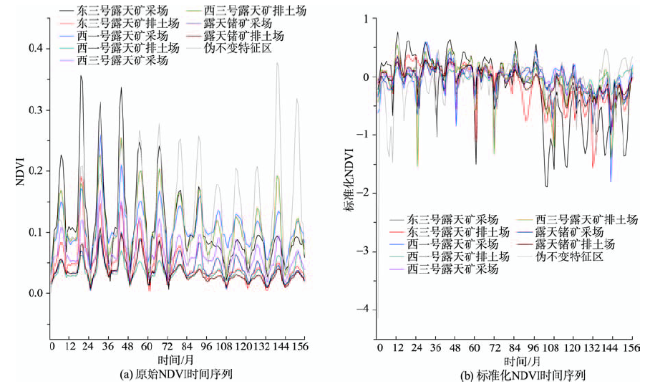
Fig.3 The changing condition of standardized NDVI time series in different feature regions of the open-cast mine area图3 矿区各特征区域NDVI变化状况 |
Tab.3 Changing trend and jump time of NDVI time series in the open-cast mine area′s表3 露天矿区各特征区NDVI时间序列变化趋势及突变时间[27] |
| 特征区 | 地点 | 方差贡献率/(%) | M-K | 变化趋势 | 突变时间/月 | |
|---|---|---|---|---|---|---|
| 露天采场 | 东三号露天矿 | 30.43 | -0.00829 | -8.9110 | 下降 | 89 |
| 西三号露天矿 | 20.67 | -0.00094 | -11.3752 | 下降 | 124 | |
| 西一号露天矿 | 19.88 | -0.00175 | -3.7253 | 下降 | 124 | |
| 露天锗矿 | 24.38 | -0.00170 | -5.7451 | 下降 | 122 | |
| 排土场 | 东三号露天矿 | 17.84 | -0.00148 | -8.6812 | 下降 | 114 |
| 西三号露天矿 | 19.93 | -0.00336 | -6.3153 | 下降 | 101 | |
| 西一号露天矿 | 17.89 | -0.00066 | -3.3851 | 下降 | 71 | |
| 露天锗矿 | 59.59 | -0.00392 | -9.3554 | 下降 | 90 | |
| 伪不变特征区 | 植被覆盖区域 | 14.57 | -0.00027 | -1.4573 | - | - |
注:突变时间以2001年1月为1,依此类推2013年12月为156;“-”指无显著变化趋势 |
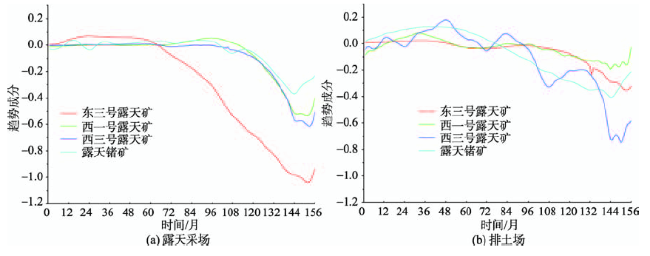
Fig.4 Trend component of NDVI time series in the mining disturbance area图4 采矿扰动区NDVI时间序列趋势成分 |
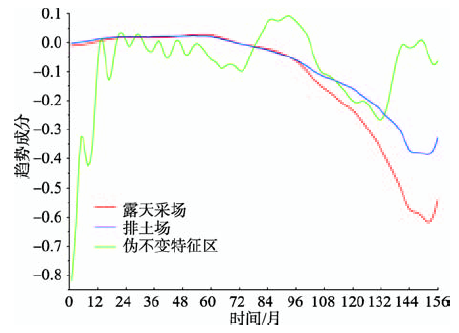
Fig.5 Comparison of the trend component of NDVI time series between the mining disturbance area and the unchanged feature region图5 采矿扰动区与伪不变特征区NDVI时间序列趋势成分对比 |
Tab.4 Information of period component in the mining disturbance area表4 各矿井采矿扰动区NDVI时间序列周期成分 |
| 特征区 | 重建成分组合 | 贡献率/(%) | 周期/月 | 重建成分组合 | 贡献率/(%) | 周期/月 | 重建成分组合 | 贡献率/(%) | 周期/月 |
|---|---|---|---|---|---|---|---|---|---|
| 东三号露天矿采场 | R4+R5+R6 | 13.30 | 11.1 | R2+R3 | 12.33 | 31.2 | R7+R8 | 6.16 | 13 |
| 东三号露天矿排土场 | R2+R3 | 13.16 | 10.4 | R4+R5+R9 | 13.00 | 6 | R6+R7+R8 | 10.48 | 14 |
| 西一号露天矿采场 | R2+R3+R4 | 19.47 | 13 | R5+R6 | 9.61 | 11.1 | R7+R8 | 8.80 | 7.8 |
| 西一号露天矿排土场 | R2+R3+R4 | 28.01 | 12 | R5+R6+R7 | 13.93 | 6 | R8+R9 | 8.01 | - |
| 西二号露天矿采场 | R2+R3 | 16.43 | 10.4 | R4+R5+R6 | 15.67 | 5.5 | R7+R8 | 6.29 | - |
| 西二号露天矿排土场 | R2+R3+R4 | 21.01 | 10.4 | R7+R8+R9 | 9.54 | - | R5+R6 | 8.43 | 39 |
| 露天锗矿采场 | R2+R3 | 11.78 | 9 | R5+R6+R7 | 10.45 | 12 | R4+R8+R9 | 10.37 | - |
| 露天锗矿排土场 | R3+R4 | 11.18 | 13 | R5+R6 | 10.44 | 11.1 | R7+R8+R9 | 5.20 | - |
注:-指无显著周期 |
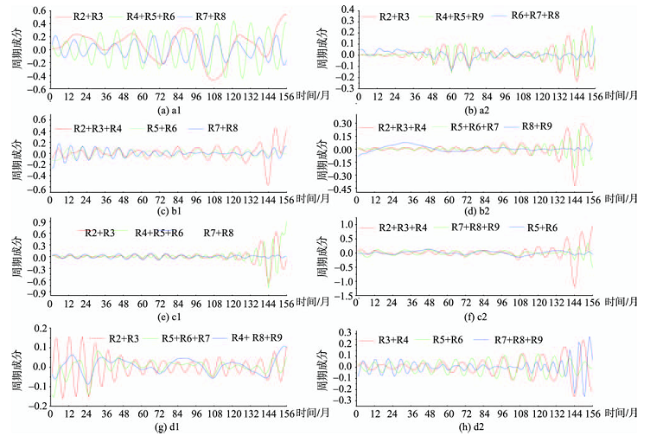
Fig.6 Evolution characteristics of period component of NDVI time series in the mining disturbance area图6 采矿扰动区NDVI时间序列周期成分演变特征 注:a为东三号露天矿;b为西一号露天矿;c为西三号露天矿;d为露天锗矿;1表示露天采场;2表示排土场 |
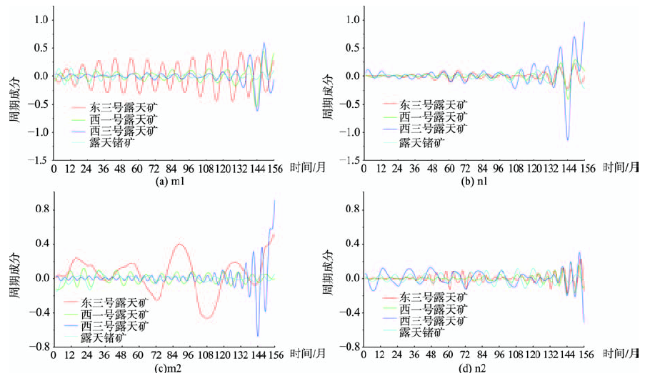
Fig.7 Comparison of the component for the first two periods in the mining disturbance area图7 各矿井采矿扰动区NDVI时间序列前两周期成分演变特征对比 注:m1为露天采场第一周期成分;m2为露天采场第二周期成分;n1为排土场第一周期成分;n2为排土场第二周期成分 |
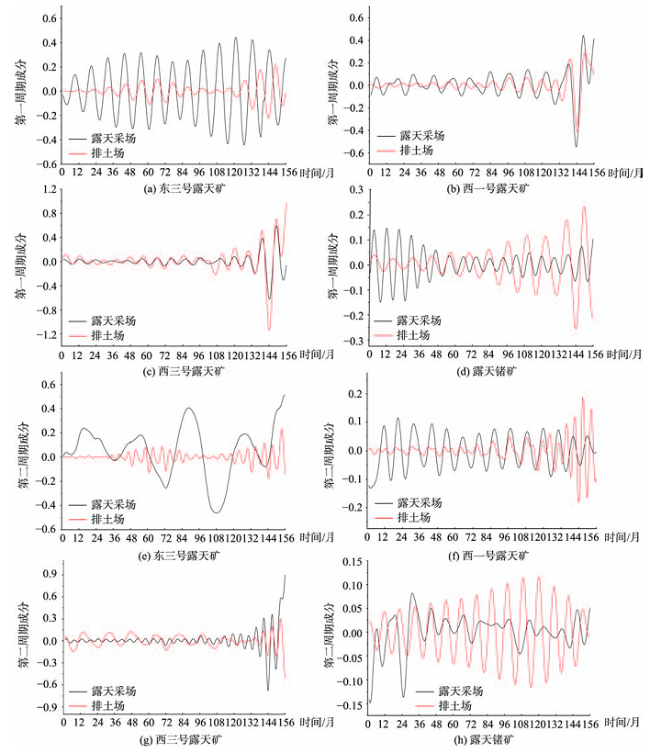
Fig.8 Comparison of period component for the stopes and waste dump图8 露天采场和排土场NDVI时间序列周期成分对比 |
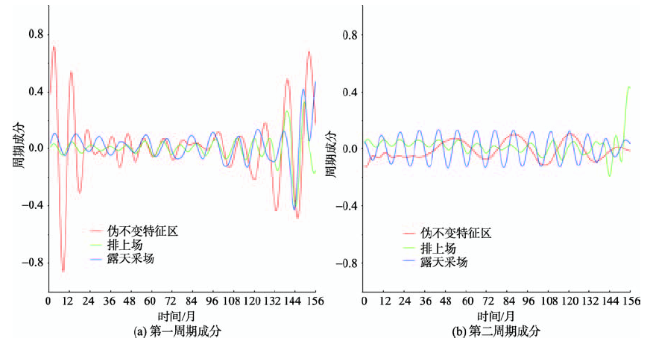
Fig.9 Comparison of period component of NDVI time series between the unchanged feature region and the mining disturbance area图9 伪不变特征区与采矿扰动区NDVI时间序列周期成分对比 |
The authors have declared that no competing interests exist.
| [1] |
[
|
| [2] |
[
|
| [3] |
|
| [4] |
[
|
| [5] |
|
| [6] |
|
| [7] |
|
| [8] |
[
|
| [9] |
|
| [10] |
[
|
| [11] |
[
|
| [12] |
|
| [13] |
[
|
| [14] |
[
|
| [15] |
|
| [16] |
[
|
| [17] |
LPDAAC. MODIS user guide[EB/OL]. .
|
| [18] |
|
| [19] |
|
| [20] |
[
|
| [21] |
|
| [22] |
[
|
| [23] |
|
| [24] |
[
|
| [25] |
[
|
| [26] |
|
| [27] |
[
|
/
| 〈 |
|
〉 |
