Plot-level Forest Height Inversion Using Airborne LiDAR Data Based on the Random Forest

  • LU Lin , 1 ,
  • ZHOU Xiaocheng , 1, * ,
  • YU Zhizhong 1 ,
  • HAN Shang 2 ,
  • WANG Xiaoqin 1
Expand
  • 1. Key Laboratory of Spatial Data Mining & Information Sharing of Ministry of Education, National Engineering Research Center of Geospatial Information Technology, Fuzhou University, Fuzhou 350002, China
  • 2. Institute of Surveying and Mapping of Fujian Province, Fuzhou 350002, China
*Corresponding author: ZHOU Xiaocheng, E-mail:

Received date: 2015-10-26

  Request revised date: 2016-02-23

  Online published: 2016-08-10

Copyright

《地球信息科学学报》编辑部 所有

Abstract

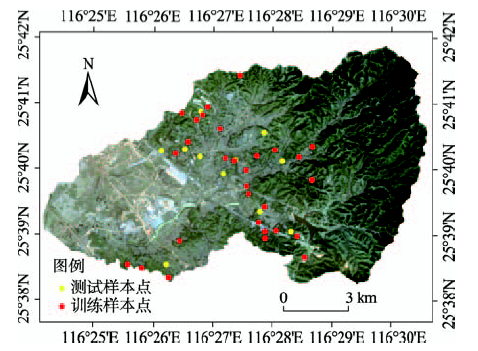
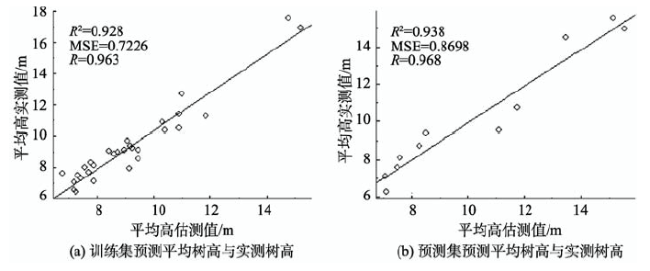
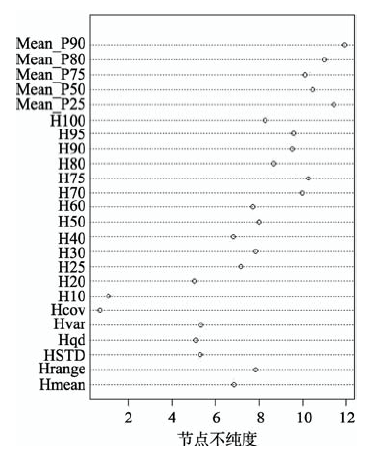
It has been a hot study field to extract forest structure parameter using Airborne LiDAR. This paper evaluated the validity of random forests technique (RF) in the estimation of forest height, based on both of the physical and statistical features of airborne LiDAR data with the utilization of a new detection method to find the crown height. The study area was selected to be the Zhuxi river basin of Changting county in Fujian Province. At first, the ground point dataset, vegetation and elevation normalized vegetation point dataset of stands were generated by using the progressive TIN filter algorithm. Then, 24 independent variables, such as the percentile of heights and the statistical metrics of points, were derived from the normalized vegetation point dataset. Based on the 24 laser-derived features and the field data, the estimation model for the random forest regression of the mean canopy height in the study area was established. 29 of the samples were used to construct the prediction model, and the remaining 11 samples were used to verify the accuracy of the model. Finally, we compared the average value of the estimated tree heights in each plot with the measured values. The result showed that they were highly correlated with each other, the regression coefficient between them was 0.938, and the correlation coefficient was 0.968. The accuracies of all plots were higher than 87% and the total average accuracy was 93.17%. Moreover, the importance of each variable was calculated in this paper to evaluate the accuracy of model estimation closely. And a conclusion was drawn that the importance of the variable sand the model estimation accuracy were positive correlated, which implies that the greater the importance of the variables, the greater their impact on the accuracy of the model estimation. Among all variables, the Mean_P90 and the percentiles between 70%~95% were representatively having a great influence on the accuracy of model estimation. According to the results, it was concluded that the estimation model of forest height based on random forest technique (RF) with multi-factor was proved to be feasible and efficient.

Cite this article

LU Lin , ZHOU Xiaocheng , YU Zhizhong , HAN Shang , WANG Xiaoqin . Plot-level Forest Height Inversion Using Airborne LiDAR Data Based on the Random Forest[J]. Journal of Geo-information Science, 2016 , 18(8) : 1133 -1140 . DOI: 10.3724/SP.J.1047.2016.01133

1 引言

激光雷达(Light Detection And Ranging,LiDAR)是一种通过传感器所发射的激光来测定传感器与目标物之间距离的主动遥感技术。近年来,激光雷达技术在森林资源监测中得到广泛应用,包括获取常规的森林郁闭度、生物量以及蓄积量等特征,以及提取林分冠层结构参数,如树高、胸径和冠幅等[1]。而林分平均树高作为森林资源调查和管理监测中的重要测量因子,是反演估测其他森林参数的基础[2-3]
目前从激光点云数据中提取林分平均树高主要包括间接法和直接法2种。间接法一般根据提取的单木树高信息进行算术平均得到,包括从点云数据获取的林冠高度模型(CHM)进行树冠分割[4-5]和局部最大值查找法[6-7]等方法获取单木高度信息,其缺点是对于点云的密度有一定要求,而且地形坡度也会导致CHM中的树冠顶点发生位置偏移[8]。直接法则直接从林分样地提取点云参数进行回归,估测林分平均高,包括采用多元回归方法和非参数的回归方法。其中,Yu等[9]通过提取样方冠层高度参数、激光回波的垂直分布、树冠面积等参数进行回归分析估测样方平均树高。Tesfamichael等[10]分析了不同采样密度的LiDAR点云数据进行林分均高的估测,通过从点云数据中提取相关参数进行逐步回归分析,得出林分均高估测的均方根误差在不同密度水平下均达到1.0 m左右。庞勇、尤号田、焦义涛等[11-13]也分别用获取的不同LiDAR点云参数对平均树高进行估测,估测精度都在90%以上。
采用逐步多元线性回归方法,需假设限制样本必须服从正态分布和无共线性。为克服假设限制,非参数的估测方法被引入到LiDAR回归统计中,从而更加灵活地用于森林参数的估测[14]。目前,较常用的非参数估计方法包括K近邻法回归(K-nearest Neighbor Regression)、支持向量机方法SVM(Support Vector Machine)和随机森林(Random Forest)等[15-16]。相关研究表明,虽然前2种方法在林业参数估算中得到了较积极的结果,但对于多样本和多变量的预测问题则会表现出过拟合现象。而随机森林算法(RF)则因其具有较高的预测精度和学习过程快、且不易产生过拟合现象等特征而逐渐应用于森林参数的估算[17-20]。本文针对以往采用线性回归方法估测平均树高中所选用参数的不确定性和多变量问题的限制,以及目前相应非参数方法在估测平均树高中所产生的问题,将随机森林算法(RF)引入到林分平均树高估测中来,并以福建长汀朱溪河流域为试验区,探讨了随机森林算法(RF)在机载LiDAR数据林分平均树高估测中的适用性。

2 研究区概况与数据获取

2.1 研究区概况

朱溪河流域位于福建省长汀县河田镇,介于北纬25°33′~25°48′,东经116°18′~116°31′之间。流域整个地势自东北向西南倾斜,海拔270~680 m,地貌类型以低山、丘陵为主。气候属于中亚热带季风性湿润气候,全年平均气温19 ℃;年平均降水量为1700 nm,其中4-6月降水量约占全年的1/2,且降雨强度大;土壤类型主要为山地丘陵红壤,含沙量大,风化壳深厚。整个流域区域作为长汀县水土流失重点治理区,其以人工种植的马尾松(Pinus massoniana)为主要树种,且以次生马尾松为主逐渐向四周扩展为马尾松成熟林、针阔混交林等。

2.2 机载LiDAR数据获取

机载激光雷达数据由Leica ALS70-HP机载三维激光扫描系统获取,数据采集时间为2013年11月。飞行绝对航高为3500 m,发射的激光波长为1064 nm,最大激光脉冲频率为500 kHz,最大扫描频率为200 Hz,飞行过程中分别记录了激光脉冲的3次回波信号。整个飞行过程的旁向重叠度控制在25%左右,LiDAR平均扫描点距小于2 m,整个点云密度约为0.7个/m2。获取的LiDAR点云数据经过噪声和异常值的剔除等预处理。

2.3 野外实测数据

2015年8月在朱溪河流域共设置了40块圆形样地(图1),样地半径均为15 m。样地主要在参考流域内划分的林业小班基础上再结合实际可观测条件进行布置,且实测树种均为流域内的优势树种马尾松。在样地内,采用皮尺测量每株树木胸径部位(树干1.3 m高度处)的周长,再根据圆周长关系计算出平均树高胸径。采用森林罗盘仪测量每株树木的树高,采用皮尺测量树南北和东西方向的冠幅,利用差分GPS对每个样地中心点进行定位并记录其坐标(图1),图中坐标系统为CGCS2000。
Fig.1 Distribution of the study plots

图1 样地分布图

林分平均树高采用断面积加权法计算,其计算公式如式(1)所示。
H = i = 1 n h i g i i = 1 n g i (1)
式中: h i 为第i株林木的树高; g i 为第i株林木的胸高断面积;n为林分株数。

3 研究方法

3.1 LiDAR估测树高基本原理

激光雷达以激光脉冲作为技术手段,工作频段一般在可见光和近红外光谱区,通过测量地面采样点激光回波脉冲相对于发射激光主波之间的延迟时间,得到传感器到地面采样点之间的距离。其测距基本原理可表示为式(2)。
R = c t 2 (2)
式中:R为传感器到目标物体的距离;c为光速;t为激光脉冲从激光器到被测目标的往返传输时间。
由于LiDAR对森林冠层具有穿透性,当飞行器在林地上空进行激光扫描时,传感器能接收到由林地树冠层、树干部分和地表部分反射的激光能量,通过计算来自树顶的回波与来自地面回波高程的差值,便可得到树高[21]。小光斑LIDAR的采样密度决定了所获取冠层结构的详细程度,在采样密度较高时,平均每棵树上有几个、十几个甚至更多的激光脉冲点,因而可以用来估测每棵树的参数;采样密度低时,单个树冠的激光点太少而无法准确刻画树冠的表面变化,甚至“错失”树顶,因而只能用来估测森林的平均树高信息[11]

3.2 随机森林方法估测树高

利用随机森林方法估测林分平均树高,需要从归一化植被点云中获取相应点云变量参数,然后利用这些参数构建随机森林回归模型,对平均树高进行估测。
3.2.1 点云滤波
点云数据的滤波是指从点云中分离出地面点和非地面点的LiDAR数据处理方法。鉴于森林地区的复杂地形和相应滤波算法的适用情况,本文主要采用隋立春等[22]提出的基于渐进三角网的LiDAR数据滤波方法对森林地区进行处理。该算法是基于不规则三角网方法的一种改进,其充分考虑到全局地形情况,通过对TIN内点云按高程进行排序后再逐渐加密三角网以提取地面点。相对于常规的不规则TIN算法,改进后的方法能有效地滤除不同尺寸的建筑物、低矮的植被和其他地物,且地形特征保持较好。
在本研究中因为样地都分布于山地区域,因而通过该滤波处理后得到的非地面点就是样地区域的植被点。整个LiDAR数据滤波过程通过MATLAB编程实现。
3.2.2 植被点高程归一化
通过对获取的样地区域地面点进行TIN插值即可得到DEM高程,将植被点的高程减去DEM高程值,便可消除地形起伏变化对数字表面模型(DSM)中地物高程及其形状的干扰,从而获取相对准确的地物形态和高度等信息。为了排除林下灌丛等低矮植被点对林分平均树高的影响,本文只保留了归一化高程值大于2 m的植被点用于后续分析[23]
3.2.3 植被点云特征提取
本文采用植被冠层的第一回波数据估算林分参数[24]。通过比较分析目前利用机载LIDAR数据估算林分参数所采用的点云变量情况[10,25],并根据不同的参数组合对比试验,最后选出24个估测树高的最优特征集,包括平均高度Hmean、高度分布范围Hrange、点云高度标准差HSTD、百分位高度(H10、H20、H25、 H95)、最大高度H100、和不同百分位高度点云高度均值(Mean_P25、Mean_P50、 Mean_P90)等(表1)。
Tab.1 Independent variable metrics extracted from the LiDAR points.

表1 从植被点云中获取的自变量指标

点云变量 变量描述
Hmean 点云高度的均值
Hrange 点云高度分布范围,计算公式为:Hrange=H100-2.0
HSTD 点云高度标准差,计算公式:HSTD=1ni=1nxi-x̅
Hqd 点云四分位高度偏差,计算公式:Hqd=0.575th-25th
Hvar 点云高度方差,计算公式:Hvar=1n-1i=1nxi-x̅2
Hcov 点云高度的变化系数,计算公式:Hcov=HSTDHmean
H100 点云高度最大值
H10、H20、···、H95 点云的百分位高度值,即所有点云10%、20%、25%、30%、40%、···、95%处对应的高度值
Mean_P25、···、Mean_P90 点云各百分位高度处对应点云高度的均值,如Mean_P25表示为所有大于H25的点云的平均值

注:n为每个样地对应归一化植被点云的个数;xi为每个植被点对应的高度值;x̅为点云高度均值;75th为样地内点云高度的上四分位数;25th为样地内点云高度的较小四分位数

3.2.4 随机森林模型构建
(1)RF算法原理
随机森林算法RF由Breiman[26]提出,是一个树型分类器 { h ( x , β k ) , k = 1 , 的集合,其中 h ( x , β k ) 是用CART算法构建的没有剪枝的分类决策树;x是输入向量; β k 是独立同分布的随机向量,决定了单棵树(基分类器)的生长过程。随机森林利用Bagging算法产生不同的训练样本集,即通过自助法boot-strap重采样技术从原始样本集中有放回的重复随机抽取K个新的自助样本集,并由此构建K棵决策树,且决策树在生长过程中不进行剪枝操作,然后组合多个决策树分类器进行结果预测。
由于作为因变量的林分平均高为数值变量,因而在进行林分平均高RF预测的建模过程中采用随机森林回归模型。随机森林算法用Bagging方法在形成新的训练集时,通常在一个boot-strap样本使用大约2/3的原始样本,而另外的接近1/3的样本则不会出现在训练集中,而成为袋外数据(Out-Of-Bag,OOB)。使用这些数据可用来估计模型的性能(OOB估计),包括对单个变量重要性的估计以及模型的泛化误差。在回归模型中,主要由伪复相关系数(RSQ)和均方误差向量(MSE)来进行泛化误差的评估,其计算公式分别如式(3)–(4)所示。
RSQ = n - i = 1 n F x i - y i 2 i = 1 n y i - y ̅ (3)
MSE = i = 1 n F x i - y i 2 n (4)
(2)模型构建与优化
本文在相关研究基础上,基于有限的样本数据,将野外采集的40个样地随机分成2部分[9,17],即选取其中29个样地作为训练集进行参数优化和建立随机森林回归模型,11个样地作为测试训练集对模型进行检验。通过使用R软件中的randomForest数据包来进行随机森林回归模型的构建。模型构建过程涉及到2个关键的参数:ntree和mtry。其中,ntree为决策树的数量,即使用boot-strap重抽样的次数;mtry为随机特征的数量,即用来决定在随机森林中决策树的每次分支时所选择的变量个数,在回归模型中通常为输入变量数的1/3。
将从每个样地点云中获取的变量值以及对应的平均高实测数据作为原始数据集输入分析,便可得到模型误差与回归树数量的关系图。图2为决策树数量与数据集均方差和伪复相关系数的关系图,通过分析可得出在树数量为3000左右时,二者的变化趋于稳定。对ntree和mtry参数不同取值下的 R 2 MSE的比较可知,当ntree为3000,mtry取值为5时能达到最好的预测效果。因此,为了让模型的整体误差率趋于稳定,并保证RF收敛,在提高算法效率的基础上,本文选取参数ntree为3000,mtry为5构建随机森林回归模型来对林分平均高进行估测。
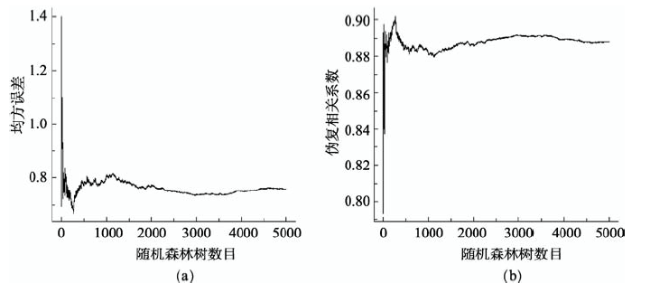
Fig.2 Relationship between the model error and the ntree number

图2 随机森林决策树数目与模型误差关系图

4 实验分析

4.1 树高估测结果

根据获取的随机森林回归模型,对样地的平均树高进行预测。为检验该模型预测的精度,分别对29个训练集和11个测试集进行平均高的估测,然后分析其估测值与实测平均高的相关关系。图3(a)所示为训练集预测林分平均树高与实测平均高的相关关系,其决定系数为0.928,相关系数为0.963。图3(b)所示为测试集预测林分平均高与实测平均高的相关关系,其决定系数为0.938,相关系数为0.968。二者差别不大,其在一定程度上也反映出所构建的随机森林回归模型在对林分平均树高进行估测时较为稳定,且精度较高。
Fig.3 Comparison of forest height between the ground measured values and the model estimations

图3 模型估测平均树高与实测树高对比图

根据树高估测精度的计算公式如式(5)所示。
p = 1 n i = 1 n 1 - y i - y ^ i y i × 100 % (5)
式中: y i 为实际观测值; y ^ i 为模型预测值;n为预测的样本数。
本文对11块检验样本的平均树高估测结果分别进行精度评价。如表2可知,模型估测的最高精度为99.29%,最低为83.80%。总体平均估测精度为93.17%,实测值与预测值没有显著差异,从11个样本的预测值与实测值的散点图也可看出,估测的平均树高与实测值吻合较好。
Tab.2 The inversion results of forest height compared with the ground measured results for the control plots

表2 检验样地的树高反演结果与实测对比

样地编号 实测平均树高/m 估测平均树高/m 树高差值/m 精度/(%)
30 9.37 8.51 -0.86 90.82
31 7.11 7.06 -0.05 99.29
32 15.54 15.16 -0.38 97.55
33 8.07 7.58 -0.49 93.92
34 14.94 15.57 0.63 95.78
35 6.26 7.09 0.83 86.74
36 10.74 11.77 1.03 90.41
37 9.57 11.12 1.55 83.80
38 8.73 8.28 -0.45 94.84
39 7.57 7.48 -0.09 98.81
40 14.52 13.50 -1.02 92.97
表2可看出,第37个样本的估测精度较差,其原因可能是原样地区域树之间穿插交错,激光回波脉冲难以穿透到地面而导致后续归一化植被点高程值偏高。其次,从整体上来看,估测的平均树高与实测树高均偏低。这与目前小光斑激光点云的相关研究结果类似[27-28]

4.2 模型估测结果解释

随机森林算法相对于其他非参数估测方法的优势在于对结果的可解释性,即对变量重要性的测算。图4为根据节点不纯度计算得到的自变量参数的重要性。从图4中可得出,点云百分位高度处的均值,这组参数对模型的估测精度重要性最大,且主要以参数Mean_P90为代表。其次是点云百分位高度变量中的75%和70%高度变量。这与前人的研究结论吻合,即植被首次回波的80%~90%分位数或最大高度通常能很好地估测平均树高或优势树高[10]。重要性最差的是点云的几个统计变量,如HSTDHmean等。
Fig. 4 Influence evaluation of the independent variables for the random forest approach

图4 随机森林自变量影响力评价

此外,为更好地描述变量重要性对模型估测精度的影响,这里分别选取Mean_P90、H75和Hmean对林分样地数据进行预测分析,分析过程中仍然将样本数据分为29个样本的训练集和11个样本的测试集。首先通过训练集来获取相应的回归方程,然后对11个样本数据进行预测分析。
图5可发现,Mean_P90、H75和Hmean与林分平均高实测值的相关性都很明显,其判定系数均达到90%以上,相关系数也达到了96%左右。通过将这3个变量与平均高实测值进行回归分析获取拟合方程,然后用拟合方程对11个验证样本进行预测分析。从图5的右边一列可看出,其相关系数均能达到93%以上,且随着变量参数重要性的增强,对应的估测值与实测值的相关关系也逐渐增强,其中以变量Mean_P90的相关关系最为明显。根据树高估测精度计算公式,得出三者的平均精度分别为94.48%、93.36%和90.92%。由此可得出,变量的重要性与模型的预测精度呈正相关关系,即变量重要性越强,其对模型估测精度的贡献越大。
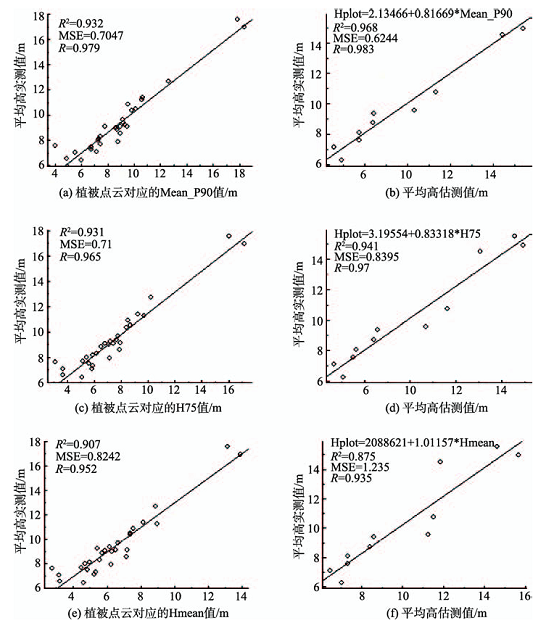
Fig.5 The influences of Mean_P90, H75 and Hmean variables on the estimation accuracy of the model

图5 Mean_P90H75Hmean变量对模型估测精度的影响

5 结论与讨论

本文以朱溪河流域内林分平均树高为研究对象,结合获取的较低密度机载LiDAR点云数据和野外实测的平均树高数据,将随机森林算法用于对林分平均树高的估测,并建立了相应的随机森林回归模型。主要结论如下:
(1)基于随机森林算法构建的林分平均树高估测模型对于平均树高的估测精度较高。模型对29个训练样本和11个测试样本的估测值与实测值的相关性较强,相关系数均达到96%以上。其中,对于验证样本的估测精度都高于86%,总体平均精度达到了93.17%。可以证明该算法对林分平均树高的估测是可行的。
(2)随机森林算法处理的是非线性多重符合的回归问题,构建的模型预测性能比较稳健,能很好地应用于多变量的数据分析中,且对结果具有可解释性。本文分析得出,变量的重要性越强,其对于模型估测精度的贡献越大。
(3)利用随机森林算法在对变量重要性分析时,点云百分位高度处的均值对于模型的估测精度重要性最大,主要以参数Mean_P90为代表。其次则是点云百分位高度变量,主要以70%~95%分位数为主。
(4)基于LiDAR点云数据获取的树高估测值整体偏低,这与相关研究结果一致。而将LiDAR数据与同步获取的航片数据结合起来获取相应的林分参数变量,则可为树高估测精度的提高提供一个思路。

The authors have declared that no competing interests exist.

[1]
Lee A C, Lucas R M.A LiDAR-derived canopy density model for tree stem and crown mapping in Australian forests[J]. Remote Sensing of Environment, 2007,111(4):493-518.The retrieval of tree and forest structural attributes from Light Detection and Ranging (LiDAR) data has focused largely on utilising canopy height models, but these have proved only partially useful for mapping and attributing stems in complex, multi-layered forests. As a complementary approach, this paper presents a new index, termed the Height-Scaled Crown Openness Index (HSCOI), which provides a quantitative measure of the relative penetration of LiDAR pulses into the canopy. The HSCOI was developed from small footprint discrete return LiDAR data acquired over mixed species woodlands and open forests near Injune, Queensland, Australia, and allowed individual trees to be located (including those in the sub-canopy) and attributed with height using relationships ( r 2 =0.81, RMSE=1.85m, n =115; 4 outliers removed) established with field data. A threshold contour of the HSCOI surface that encompassed 6590% of LiDAR vegetation returns also facilitated mapping of forest areas, delineation of tree crowns and clusters, and estimation of canopy cover. At a stand level, tree density compared well with field measurements ( r 2 =0.82, RMSE=133stems ha 611 , n =30), with the most consistent results observed for stem densities ≤700stems ha 611 . By combining information extracted from both the HSCOI and the canopy height model, predominant stem height ( r 2 =0.91, RMSE=0.77m, n =30), crown cover ( r 2 =0.78, RMSE=9.25%, n =30), and Foliage & Branch Projective Cover (FBPC; r 2 =0.89, RMSE=5.49%, n =30) were estimated to levels sufficient for inventory of woodland and open forest structural types. When the approach was applied to forests in north east Victoria, stem density and crown cover were reliably estimated for forests with a structure similar to those observed in Queensland, but less so for forests of greater height and canopy closure.

DOI

[2]
Hirata Y, Furuya N, Suzuki M, et al.Airborne laser scanning in forest management: individual tree identification and laser pulse penetration in a stand with different levels of thinning[J]. Forest Ecology and Management, 2009,258(5):752-760.This study examined the ability of an airborne laser scanner to identify individual trees in the canopy of a stand and investigated the relationship between the penetration rate of the laser pulses and stand attributes under different canopy conditions caused by different levels of thinning. Individual tree were identified from a digital canopy model (DCM) derived from airborne laser scanner data by the watershed method. The identification rate of individual trees in blocks with heavy thinning (ratio of the basal area of the felled trees to the total basal area, hereinafter thinning ratio of the basal area, 38.0%), moderate thinning (30.4%), and no thinning was 95.3%, 89.2%, and 60.0%, respectively. Individual tree heights were estimated from the DCM values by local maximum filtering within identified individual . Tree height in the three blocks was estimated with a root-mean-square error of 0.95, 0.65, and 0.68m, respectively. Tree heights determined in a field survey were regressed against those estimated from the DCM, yielding coefficients of determination (r 鈯2;) of 0.71, 0.87, and 0.85, respectively, for the blocks with heavy thinning, moderate thinning, and no thinning, respectively, and 0.86 overall. The respective penetration rates of the laser pulses through the canopy to the ground were 50.6%, 43.1%, and 9.2%. Regression of the laser pulse penetration rate against the thinning ratio of the basal area and against the total basal area of the remaining trees in 25 quadrats established in the blocks, yielded r 鈯2; values of 0.89 and 0.74, respectively.

DOI

[3]
Véga C, Durrieu S.Multi-level filtering segmentation to measure individual tree parameters based on Lidar data: application to a mountainous forest with heterogeneous stands[J]. International Journal of Applied Earth Observation and Geoinformation, 2011,13(4):646-656.This paper presents a method for individual tree crown extraction and characterisation from a canopy surface model (CSM). The method is based on a conventional algorithm used for localising LM on a smoothed version of the CSM and subsequently for modelling the tree crowns around each maximum at the plot level. The novelty of the approach lies in the introduction of controls on both the degree of CSM filtering and the shape of elliptic crowns, in addition to a multi-filtering level crown fusion approach to balance omission and commission errors. The algorithm derives the total tree height and the mean crown diameter from the elliptic tree crowns generated. The method was tested and validated on a mountainous forested area mainly covered by mature and even-aged black pine (Pinus nigra ssp. nigra [Arn.]) stands. Mean stem detection per plot, using this method, was 73.97%. Algorithm performance was affected slightly by both stand density and heterogeneity (i.e. tree diameter classes' distribution). The total tree height and the mean crown diameter were estimated with root mean squared error values of 1.83 m and 1.48 m respectively. Tree heights were slightly underestimated in flat areas and overestimated on slopes. The average crown diameter was underestimated by 17.46% on average. (C) 2011 Elsevier B.V. All rights reserved.

DOI

[4]
Koch B, Heyder U, Weinacker H.Detection of individual tree crowns in airborne LiDAR data[J]. Photogrammetric Engineering and Remote Sensing, 2006,72(4):357-363.ABSTRACT Laser scanning provides a good means to collect information on forest stands. This paper presents an approach to delineate single trees automatically in small footprint light detection and ranging (lidar) data in deciduous and mixed temperate forests. In rasterized laser data possible tree tops are detected with a local maximum filter. Afterwards the crowns are delineated with a combination of a pouring algorithm, knowledge-based assumptions on the shape of trees, and a final detection of the crown-edges by searching vectors starting from the trees' tops. The segmentation results are assessed by comparison with terrestrial measured crown projections and with photogram-metrically delineated trees. The segmentation algorithm works well for coniferous stands. However, the implemented method tends to merge crowns in dense stands of deciduous trees.

DOI

[5]
刘清旺,李增元,陈尔学,等.利用机载激光雷达数据提取单株木树高和树冠[J].北京林业大学学报,2008,30(6):83-89.机载激光雷达是一种主动遥感技术。在林业应用方面,高采样密度激光雷达能够获取单株木三维结构特征,采用不同的数据处理方法,可以得到不同精度的单株木参数。该文利用高采样密度的机载激光雷达数据(离散回波,平均激光点间隔0.52 m、平均光斑直径0.3 m),研究了单株木的树高提取技术和树冠边界识别算法,针对单株木的树冠特征,提出了一种双正切角树冠识别算法;最后,使用重庆铁山坪林场的9个外业样地数据,对单株木树高和冠幅,以及样地平均树高和平均冠幅进行了验证。结果表明,单株木树高和冠幅的R2分别为0.34和0.03,样地平均树高和平均冠幅的R2分别为0.97和0.71,样地尺度的相关性明显高于单株木尺度的相关性。

[ Liu Q W, Li Z Y, Chen E X, et al.Extracting height and crown of individual tree using airborne LIDAR data[J]. Journal of Beijing Forestry University, 2008,30(6):83-89. ]

[6]
Popescu S C, Wynne R H, Nelson R F.Estimating plot-level tree heights with LiDAR: local filtering with a canopy-height based variable window size[J]. Computers and Electronics in Agriculture, 2002,37(1):71-95.In recent years, the use of airborne lidar technology to measure forest biophysical characteristics has been rapidly increasing. This paper discusses processing algorithms for deriving the terrain model and estimating tree heights by using a multiple return, high-density, small-footprint lidar data set. The lidar data were acquired over deciduous, coniferous, and mixed stands of varying age classes and settings typical of the southeastern US. The specific objectives were: (1) to develop and test algorithms to estimate plot level tree height using lidar data, and (2) to investigate how ground measurements can help in the processing phase of lidar data for tree height assessment. The study area is located in the Piedmont physiographic province of Virginia, USA and includes a portion of the Appomattox-Buckingham State Forest (37 degrees 25'N, 78 degrees 41'W). Two lidar processing algorithms are discussed-the first based on single tree identification using a variable window size for local filtering, and the second based on the height of all laser pulses within the area covered by the ground truth data. Height estimates resulted from processing lidar data with both algorithms were compared to field measurements obtained with a plot design following the USDA Forest Service Forest Inventory and Analysis (FIA) field data layout. Linear regression was used to develop equations relating lidar-estimated parameters with field inventories for each of the FIA plots. As expected, the maximum height on each plot was predicted with the highest accuracy (R2 values of 85 and 90%, for the first and the second algorithm, respectively). The variable window size algorithm performed better for predicting heights of dominant and co-dominant trees (R2 values 84-85%), with a diameter at breast height () larger than 12.7 cm (5 in), when compared with the algorithm based on all laser heights (R2 values 57-73%). The use of field-based height thresholds when processing lidar data did not bring significant gains in explaining the total variation associated with tree height. The technique of local filtering with a variable window size considers fundamental forest biometrics relationships and overall proved to give better results than the technique of all laser shots.

DOI

[7]
Shendryk I, Hellström M, Klemedtsson L, et al.Low-density LiDAR and optical imagery for biomass estimation over boreal forest in Sweden[J]. Forests, 2014,5:992-1010.Knowledge of the forest biomass and its change in time is crucial to understanding the carbon cycle and its interactions with climate change. LiDAR (Light Detection and Ranging) technology, in this respect, has proven to be a valuable tool, providing reliable estimates of aboveground biomass (AGB). The overall goal of this study was to develop a method for assessing AGB using a synergy of low point density LiDAR-derived point cloud data and multi-spectral imagery in conifer-dominated forest in the southwest of Sweden. Different treetop detection algorithms were applied for forest inventory parameter extraction from a LiDAR-derived canopy height model. Estimation of AGB was based on the power functions derived from tree parameters measured in the field, while vegetation classification of a multi-spectral image (SPOT-5) was performed in order to account for dependences of AGB estimates on vegetation types. Linear regression confirmed good performance of a newly developed grid-based approach for biomass estimation (R2 = 0.80). Results showed AGB to vary from below 1 kg/m2 in very young forests to 94 kg/m2 in mature spruce forests, with RMSE of 4.7 kg/m2. These AGB estimates build a basis for further studies on carbon stocks as well as for monitoring this forest ecosystem in respect of disturbance and change in time. The methodology developed in this study can be easily adopted for assessing biomass of other conifer-dominated forests on the basis of low-density LiDAR and multispectral imagery. This methodology is hence of much wider applicability than biomass derivation based on expensive and currently still scarce high-density LiDAR data.

DOI

[8]
Khosravipour A, Skidmore A K, Wang T, et al.Effect of slope on treetop detection using a LiDAR canopy height model[J]. ISPRS Journal of Photogrammetry & Remote Sensing, 2015,104:44-52.Canopy Height Models (CHMs) or normalized Digital Surface Models (nDSM) derived from LiDAR data have been applied to extract relevant forest inventory information. However, generating a CHM by height normalizing the raw LiDAR points is challenging if trees are located on complex terrain. On steep slopes, the raw elevation values located on either the downhill or the uphill part of a tree crown are height-normalized with parts of the digital terrain model that may be much lower or higher than the tree stem base, respectively. In treetop detection, a highest crown return located in the downhill part may prove to be a 鈥渇alse鈥 local maximum that is distant from the true treetop. Based on this observation, we theoretically and experimentally quantify the effect of slope on the accuracy of treetop detection. The theoretical model presented a systematic horizontal displacement of treetops that causes tree height to be systematically displaced as a function of terrain slope and tree crown radius. Interestingly, our experimental results showed that the effect of CHM distortion on treetop displacement depends not only on the steepness of the slope but more importantly on the crown shape, which is species-dependent. The influence of the systematic error was significant for Scots pine, which has an irregular crown pattern and weak apical dominance, but not for mountain pine, which has a narrow conical crown with a distinct apex. Based on our findings, we suggest that in order to minimize the negative effect of steep slopes on the CHM, especially in heterogeneous forest with multiple species or species which change their morphological characteristics as they mature, it is best to use raw elevation values (i.e., use the un-normalized DSM) and compute the height after treetop detection.

DOI

[9]
Yu X, Hyyppä J, Holopainen M, et al.Comparison of area-based and individual tree-based methods for predicting plot-level forest attributes[J]. Remote Sensing, 2010,2(6):1481-1495.Not Available

DOI

[10]
Tesfamichael S G, Ahmed F B, Van Aardt J A N. Investigating the impact of discrete-return LiDAR point density on estimations of mean and dominant plot-level tree height in Eucalyptus grandis plantations[J]. International Journal of Remote Sensing, 2010,31(11):2925-2940.The accuracy of lidar remote sensing in characterizing three-dimensional forest structural attributes has encouraged foresters to integrate lidar approaches in routine inventories. However, lidar point density is an important consideration when assessing forest biophysical parameters, given the direct relationship between higher spatial resolution and lidar acquisition and processing costs. The aim of this study was to investigate the effect of point density on mean and dominant tree height estimates at plot level. The study was conducted in an intensively managed Eucalyptus grandis plantation. High point density (eight points/m2) discrete-return, small-footprint lidar data were used to generate point density simulations averaging 0.25, one, two, three, four, five, and six points/m2. Field surveyed plot-level mean and dominant heights were regressed against metrics derived from lidar data at each simulated point density. Stepwise regression was used to identify which lidar metrics produced the best models. Mean height was estimated at accuracy of R2 ranging between 0.93 and 0.94 while dominant height was estimated with an R2 of 0.95. Root mean square error (RMSE) was also similar at all densities for mean height (鈭1.0 m) and dominant height (鈭1.2 m); the relative RMSE compared to field-measured mean was constant at approximately 5%. Analysis of bias showed that the estimation of both variables did not vary with density. The results indicated that all lidar point densities resulted in reliable models. It was concluded that plot-level height can be estimated with reliable accuracy using relatively low density lidar point spacing. Additional research is required to investigate the effect of low point density on estimation of other forest biophysical attributes.

DOI

[11]
庞勇,赵峰,李增元,等.机载激光雷达平均树高提取研究[J].遥感学报,2008,12(1):152-158.为了研究机载激光雷达(LiDAR)树高提取技术,以山东省泰安市徂徕山林场为实验区,于2005年5月进行了机载LiDAR数据获取和外业测量.通过对LiDAR点云数据的分类处理,分别得到了试验区的地面点云子集、植被点云子集和高程归一化的植被点云子集.基于高程归一化的植被点云子集计算了上四分位数处的高度,与实地测量的数据进行了比较,并结合中国森林调查规程进行了实用性分析.结果表明:对于较低密度的点云数据,使用分位数法可以较好地进行林分平均高的估计;机载激光雷达技术对树高估计是可行的,精度都高于87%,总体平均精度为90.59%,其中阔叶树的精度高于针叶树.该试验精度可以满足中国二类森林调查规程中平均树高因子的一般商品林和生态公益林的精度要求,对国有商品林小班的调查精度要求(5%)存在一点差距,需要在国有商品林区进一步开展验证工作.对本试验区而言,已经可以满足其作为森林公园生态公益林的调查要求.

DOI

[ Pang Y, Zhao F, Li Z Y, et al.Forest height inversion using airborne Lidar technology[J]. Journal of Remote Sensing, 2008,12(1):152-158. ]

[12]
尤号田,邢艳秋,王铮,等.点云密度对激光雷达估计森林样方平均树高的影响[J].东北林业大学学报,2014,42(5),143-148.以吉林省长春市净月潭国家森林公园为研究区,分别于2012年5月和10月进行飞行数据和野 外数据采集。首先通过对小光斑激光雷达离散点云数据进行随机稀释操作,获得四种不同点云密度数据.再对点云数据进行分层处理并拟合伪波形,从波形中提取冠 层半能量高用于估测森林的样方平均树高。结果表明:在研究的点云密度范围内无论点云密度的高低,冠层半能量高模型均能够较好的估测森林样方平均树高:四种 点云密度情况下,0.125倍点云密度时,模型结果相对较好,拟合相关性R=0.971。精度P=0.97;不同点云密度对模型拟合相关性及精度的影响差 异不大,且落叶松的估测精度高于樟子松。

DOI

[ You H T, Xing Y Q, Wang Z, et al.Effects of LiDAR point density on tree height estimation in plots level[J]. Journal of Northeast Forestry University, 2014,42(5),143-148. ]

[13]
焦义涛,邢艳秋,霍达,等.基于机载LiDAR点云估测林分的平均树高[J].西北林学院学报,2015,30(3):170-174.以内蒙古上库力农场为研究区,基于高程归一化后的植被点云数据计算了植被点云高度阈值平均值,建立林分平均树高线性回归模型,并进行精度评定。结果表明,模型估测平均树高精度最高为99.81%,最低为87.09%,总体平均精度为94.56%。利用植被点云高度阈值平均值估测林分平均树高具有较高的可靠性。

DOI

[ Jiao Y T, Xing Y Q, Huo D, et al.Study on mean canopy height estimation from airborne LiDAR point cloud data[J]. Journal of Northwest Forestry University, 2015,30(3):170-174. ]

[14]
Gleason C J, Im J.Forest biomass estimation from airborne LiDAR data using machine learning approaches[J]. Remote Sensing of Environment, 2012,125:80-91.During the past decade, procedures for forest biomass quantification from light detection and ranging (LiDAR) data have been improved at a rapid pace. The scope of these methods ranges from simple regression between LiDAR-derived height metrics and biomass to methods including automated tree crown delineation, stochastic simulation, and machine learning approaches. This study compared the effectiveness of four modeling techniques—linear mixed-effects (LME) regression, random forest (RF), support vector regression (SVR), and Cubist—for estimating biomass in moderately dense forest (40–60% canopy closure) at both tree and plot levels. Tree crowns were delineated to provide model estimates of individual tree biomass and investigate the effects of delineation accuracy on biomass modeling. We used our previously developed method (COTH) to delineate tree crowns. Results indicate that biomass estimation accuracy improves when modeled at the plot level and that SVR produced the most accurate biomass model (671kg RMSE per 380m 2 plot when forest plots were modeled as a collection of trees). All models provided similar results when estimating biomass at the individual tree level (505, 506, 457, and 502kg RMSE per tree). We assessed the effect of crown delineation accuracy on biomass estimation by repeating the modeling procedures with manually delineated crowns as inputs. Results indicated that manually delineated crowns did not always produce superior biomass models and that the relationship between crown delineation accuracy and biomass estimation accuracy is complex and needs to be further investigated.

DOI

[15]
García M, Riaño D, Chuvieco E, et al.Multispectral and LiDAR data fusion for fuel type mapping using support vector machine and decision rules[J]. Remote Sensing of Environment, 2011,115(6):1369-1379.This paper presents a method for mapping fuel types using LiDAR and multispectral data. A two-phase classification method is proposed to discriminate the fuel classes of the Prometheus classification system, which is adapted to the ecological characteristics of the European Mediterranean basin. The first step mapped the main fuel groups, namely grass, shrub and tree, as well as non-fuel classes. This phase was carried out using a Support Vector Machine (SVM) classification combining LiDAR and multispectral data. The overall accuracy of this classification was 92.8% with a kappa coefficient of 0.9. The second phase of the proposed method focused on discriminating additional fuel categories based on vertical information provided by the LiDAR measurements. Decision rules were applied to the output of the SVM classification based on the mean height of LiDAR returns and the vertical distribution of fuels, described by the relative LiDAR point density in different height intervals. The final fuel type classification yielded an overall accuracy of 88.24% with a kappa coefficient of 0.86. Some confusion was observed between fuel types 7 (dense tree cover presenting vertical continuity with understory vegetation) and 5 (trees with less than 30% of shrub cover) in some areas covered by Holm oak, which showed low LiDAR pulses penetration so that the understory vegetation was not correctly sampled. (C) 2011 Elsevier Inc. All rights reserved.

DOI

[16]
Packalén P, Maltamo M.The k-MSN method for the prediction of species-specific stand attributes using airborne laser scanning and aerial photographs[J]. Remote sensing of Environment, 2007,109(3):328-341.Various studies have been presented within the last 10years on the possibilities for predicting forest variables such as stand volume and mean height by means of airborne laser scanning (ALS) data. These have usually considered tree stock as a whole, even though it is tree species-specific forest information that is of primary interest in Finland, for example. We will therefore concentrate here on prediction of the species-specific forest variables volume, stem number, basal area, basal area median diameter and tree height, applying the non-parametric k-MSN method to a combination of ALS data and aerial photographs in order to predict these stand attributes simultaneously for Scots pine, Norway spruce and deciduous trees as well as total characteristics as sums of the species-specific estimates. The predictor variables derived from the ALS data were based on the height distribution of vegetation hits, whereas spectral values and texture features were employed in the case of the aerial photographs. The data covered 463 sample plots in 67 stands in eastern Finland, and the results showed that this approach can be used to predict species-specific forest variables at least as accurately as from the current stand-level field inventory for Finland. The characteristics of Scots pine and Norway spruce were predicted more accurately than those of deciduous trees.

DOI

[17]
Yu X, Hyyppä J, Vastaranta M, et al.Predicting individual tree attributes from airborne laser point clouds based on the random forests technique[J]. ISPRS Journal of Photogrammetry and Remote Sensing, 2011,66(1):28-37.<h2 class="secHeading" id="section_abstract">Abstract</h2><p id="sp000060">This paper depicts an approach for predicting individual tree attributes, i.e., tree height, diameter at breast height (DBH) and stem volume, based on both physical and statistical features derived from airborne laser-scanning data utilizing a new detection method for finding individual trees together with random forests as an estimation method. The random forests (also called regression forests) technique is a nonparametric regression method consisting of a set of individual regression trees. Tests of the method were performed, using 1476 trees in a boreal forest area in southern Finland and laser data with a density of 2.6 points per m<sup>2</sup>. Correlation coefficients <span id="mmlsi10" onclick="submitCitation('/science?_ob=MathURL&amp;_method=retrieve&amp;_eid=1-s2.0-S0924271610000651&amp;_mathId=si10.gif&amp;_pii=S0924271610000651&amp;_issn=09242716&amp;_acct=C000228598&amp;_version=1&amp;_userid=10&amp;md5=912123e2dd1ca9b1b921c37239acc7f9')" style="cursor:pointer;" alt="Click to view the MathML source" title="Click to view the MathML source"><span class="formulatext" title="click to view the MathML source">(<em>R</em>)</span></span> between the observed and predicted values of 0.93, 0.79 and 0.87 for individual tree height, DBH and stem volume, respectively, were achieved, based on 26 laser-derived features. The corresponding relative root-mean-squared errors (RMSEs) were 10.03%, 21.35% and 45.77% (38% in best cases), which are similar to those obtained with the linear regression method, with maximum laser heights, laser-estimated DBH or crown diameters as predictors. With random forests, however, the forest models currently used for deriving the tree attributes are not needed. Based on the results, we conclude that the method is capable of providing a stable and consistent solution for determining individual tree attributes using small-footprint laser data.</p>

DOI

[18]
Latifi H, Nothdurft A, Koch B.Non-parametric prediction and mapping of standing timber volume and biomass in a temperate forest: application of multiple optical/LiDAR-derived predictors[J]. Forestry, 2010,83(4):395-407.In a mixed temperate forest landscape in southwestern Germany, multiple remote sensing variables from aerial orthoimages, Thematic Mapper data and small footprint light detection and ranging (LiDAR) were used for plot-level nonparametric predictions of the total volume and biomass using three distance measures of Euclidean, Mahalanobis and Most Similar Neighbour as well as a regression tree-bas...

DOI

[19]
Latifi H, Koch B.Evaluation of most similar neighbour and random forest methods for imputing forest inventory variables using data from target and auxiliary stands[J]. International Journal of Remote Sensing, 2012,33(21):6668-6694.We report the results from modelling standing volume, above-ground biomass and stem count with the aim of exploring the potential of two non-parametric approaches to estimate forest attributes. The models were built based on spectral and 3D information extracted from airborne optical and laser scanner data. The survey was completed across two geographically adjacent temperate forest sites in southwestern Germany, using spatially and temporally comparable remote-sensing data collected by similar instruments. Samples from the auxiliary reference stands (called off-site samples) were combined with random, random stratified and systematically stratified samples from the target area for prediction of standing volume, above-ground biomass and stem count in the target area. A range of combinations was used for the modelling process, comprising the most similar neighbour (MSN) and random forest (RF) imputation methods, three sampling designs and two predictor subset sizes. An evolutionary genetic algorithm (GA) was applied to prune the predictor variables. Diagnostic tools, including root mean square error (RMSE), bias and standard error of imputation, were employed to evaluate the results. The results showed that RF produced more accurate results than MSN (average improvement of 3.5% for a single-neighbour case with selected predictors), yet was more biased than MSN (average bias of 5.13% with RF compared to 2.44% with MSN for stem volume in a single-neighbour case with selected predictors). Combining systematically stratified auxiliary samples from the target data set with the reference data set yielded more accurate results compared to those from random and stratified random samples. Combining additional data was most influential when an intensity of up to 40% of supplementary samples was appended to the reference set. The use of GA-selected predictors resulted in reduced bias of the models. By means of bootstrap simulations of RMSE, the simulations were shown to lie within the applied non-parametric confidence intervals. The achieved results are concluded to be helpful for modelling the mentioned forest attributes by means of airborne remote-sensing data.

DOI

[20]
Naghavi H, Fallah A, Shataee S, et al.Canopy cover estimation across semi-mediterranean woodlands: application of high-resolution earth observation data[J]. Journal of Applied Remote Sensing, 2014,8(1):083524.Abstract Abstract | Introduction | Material and Methods | Results | Discussion | Conclusion | Acknowledgments | References Abstract. 聽 The semi-Mediterranean Zagros forests in western Iran are a crucial source of environmental services, but are severely threatened by climatic and anthropological constraints. Thus, an adequate inventory of existing tree cover is essential for conservation purposes. We combined ground samples and Quickbird imagery for mapping the canopy cover in a portion of unmanaged Quercus brantii stands. Orthorectified Quickbird imagery was preprocessed to derive a set of features to enhance the vegetation signal by minimizing solar irradiance effects. A recursive feature elimination was conducted to screen the predictor feature space. The random forest (RF) and support vector machines (SVMs) were applied for modeling. The input datasets were composed of four sets of predictors including the full set of predictors, the four original Quickbird bands, selected vegetation indices, and the soil line-based vegetation indices. The highest r 2 and lowest relative root mean square error (RMSE) were observed in modeling with total indices and the full data set in both modeling methods. Regardless of the input dataset used, the RF models outperformed the SVM by returning higher r 2 and lower relative RMSEs. It can be concluded that applying these methods and vegetation indices can provide useful information for the retrieval of canopy cover in mountainous, semiarid stands which is crucial for conservation practices in such areas. Figures in this Article Conference Presentation Video Visit SPIE.TV

DOI

[21]
刘峰,龚健雅.基于机载激光雷达技术的茂密林地单株木识别[J].农业机械学报,2011,42(7):200-203.提出一种利用LiDAR数据进行单株木识别的方法,首先利用广义高斯模型分解全波形LiDAR数据,得到高密度的点云和相应的波形参数,通过建立数字高层模型得到非地面点云,然后计算点云的空间特征得到林木点云,最后在3D空间中利用马尔可夫随机场重新标记得到单株木点云.实验表明,与传统方法相比,本文方法能有效提高单株木识别的准确性,特别是对茂密林地中低矮、细小林木识别效果明显,平均识别精度达到75%.

DOI

[ Liu F, Gong J Y.Individual trees recognition in dense forest based on airborne LiDAR[J]. Transactions of the Chinese Society of Agricultural Machinery, 2011,42(7):200-203. ]

[22]
隋立春,张熠斌,张硕,等.基于渐进三角网的机载LiDAR点云数据滤波[J].武汉大学学报·信息科学版,2011,36(10):1159-1163.机载LiDAR点云数据滤波是获取高精度数字高程模型的关键,也是目前LiDAR点云数据处理领域研究的重点和难点之一。提出了基于渐进三角网的机载LiDAR点云数据滤波方法,首先以规则格网和不规则三角网组织数据,采用区域分块法或数学形态学法选取种子地面点建立初始稀疏三角网,通过不断向上加密三角网提取地面点。试验结果表明,该算法能有效地滤除不同尺寸的建筑物、低矮的植被和其他地物,地形特征保持较好。最后选取了不同区域的点云数据进行了滤波试验和算法验证。

[ Sui L C, Zhang Y B, Zhag S, et al.Filtering of airborne LiDAR point cloud data based on progressive TIN[J]. Geomatics and Information Science of Wuhan University, 2011,36(10):1159-1163. ]

[23]
Pang Y, Li Z Y.Inversion of biomass components of the temperate forest using airborne Lidar technology in Xiaoxing'an Mountains, northeastern of China[J]. Chinese Journal of Plant Ecology, 2012,36:1095-1105.lt;p><em>Aims</em> Our purpose was to demonstrate the potential of using airborne laser to estimate biomass components of temperate forest. The airborne Lidar data and field data of concomitant plots were used in a forest of the Northeastern China.</br><em>Methods</em> A set of biomass components, i.e., leaf biomass, branch biomass, trunk biomass, aboveground biomass and belowground biomass, were calculated from field data using species-specific allometric equations. Canopy height indices and density indices were calculated from Lidar point cloud data. The height indices evaluated included maximum height of all points, mean height of all points, quadratic mean height (square root of the mean squared height of each Lidar point) as well as height percentiles. Canopy density indices were computed as the proportions of laser points above each percentile height to total number of points. Then statistical models between these biomass components from field data and Lidar indices were built. Stepwise regression was used for variable selection and the maximum coefficient of determination (<em>R</em><sup>2</sup>) improvement variable selection techniques were applied to select the ALS-derived variables to be included in the models. The least squares method was used generally and repeated until all the independent variables of the regression equation were accord with the requirements of entering models.</br><em>Important findings</em> There were good correlations between biomass components and Lidar indices. The <em>R</em><sup>2</sup> was &gt;0.6 for all the biomass components when we put all three types of forest (i.e., needle-leaved, broad-leaved and mixed) together. Needle-leaved forest had best estimation followed by broad-leaved and mixed forests when we built separate models for the three types of forest. This estimation capability is better when the regression models are built for different forest types.</p>

DOI

[24]
Næsset E, Gobakken T.Estimation of above-and below-ground biomass across regions of the boreal forest zone using airborne laser[J]. Remote Sensing of Environment, 2008,112(6):3079-3090.Regression models relating variables derived from airborne laser scanning (ALS) to above-ground and below-ground biomass were estimated for 1395 sample plots in young and mature coniferous forest located in ten different areas within the boreal forest zone of Norway. The sample plots were measured as part of large-scale operational forest inventories. Four different ALS instruments were used and point density varied from 0.7 to 1.2m 鈭2 . One variable related to canopy height and one related to canopy density were used as independent variables in the regressions. The statistical effects of area and age class were assessed by including dummy variables in the models. Tree species composition was treated as continuous variables. The proportion of explained variability was 88% for above- and 85% for below-ground biomass models. For given combinations of ALS-derived variables, the differences between the areas were up to 32% for above-ground biomass and 38% for below-ground biomass. The proportion of spruce had a significant impact on both the estimated models. The proportion of broadleaves had a significant effect on above-ground biomass only, while the effect of age class was significant only in the below-ground biomass model. Because of local effects on the biomass鈥揂LS data relationships, it is indicated by this study that sample plots distributed over the entire area would be needed when using ALS for regional or national biomass monitoring.

DOI

[25]
Hyyppä J, Yu X, Hyyppä H, et al.Advances in forest inventory using airborne laser scanning[J]. Remote Sensing, 2012,4(5):1190-1207.We present two improvements for laser-based forest inventory. The first improvement is based on using last pulse data for tree detection. When trees overlap, the surface model between the trees corresponding to the first pulse stays high, whereas the corresponding model from the last pulse results in a drop in elevation, due to its better penetration between the trees. This drop in elevation can be used for separating trees. In a test carried out in Evo, Southern Finland, we used 292 forests plots consisting of more than 5,500 trees and airborne laser scanning (ALS) data comprised of 12.7 emitted laser pulses per m2. With last pulse data, an improvement of 6% for individual tree detection was obtained when compared to using first pulse data. The improvement increased with an increasing number of stems per plot and with decreasing diameter breast height (DBH). The results confirm that there is also substantial information for tree detection in last pulse data. The second improvement is based on the use of individual tree-based features in addition to the statistical point height metrics in area-based prediction of forest variables. The commonly-used ALS point height metrics and individual tree-based features were fused into the non-parametric estimation of forest variables. By using only four individual tree-based features, stem volume estimation improved when compared to the use of statistical point height metrics. For DBH estimation, the point height metrics and individual tree-based features complemented each other. Predictions were validated at plot level.

DOI

[26]
Breiman L.Random forests[J]. Machine Learning, 2001,45(1):5-32.lt;a name="Abs1"></a>Random forests are a combination of tree predictors such that each tree depends on the values of a random vector sampled independently and with the same distribution for all trees in the forest. The generalization error for forests converges a.s. to a limit as the number of trees in the forest becomes large. The generalization error of a forest of tree classifiers depends on the strength of the individual trees in the forest and the correlation between them. Using a random selection of features to split each node yields error rates that compare favorably to Adaboost (Y. Freund &amp; R. Schapire, <i>Machine Learning</i>: <i>Proceedings of the Thirteenth International conference</i> ***, 148&#x2013;156), but are more robust with respect to noise. Internal estimates monitor error, strength, and correlation and these are used to show the response to increasing the number of features used in the splitting. Internal estimates are also used to measure variable importance. These ideas are also applicable to regression.

DOI

[27]
邢艳秋,尤号田,霍达,等.小光斑激光雷达数据估测森林树高研究进展[J].世界林业研究,2014,27(2):29-34.小光斑激光雷达可以同时获得森林的垂直及水平结构参数,因光斑直径较小,可以做到森林单木结构参数的准确估计,进而推广到样方甚至更大区域森林结构参数的估计,近年来在林业中得到广泛应用。文中主要从树高估计方面对小光斑激光雷达在林业中的应用进行研究,通过对先前类似文献进行归纳总结发现,在小光斑激光雷达估测森林树高方面仍存在着一些问题,从而限制了森林树高估测精度的提高,如点云分类算法、点云密度、森林郁闭度、单木的准确分割等,还对小光斑激光雷达估计森林树高中所存在的问题进行了概括,并提出了改进建议。

DOI

[ Xing Y Q, You H T, Huo D, et al.Research progress in estimating forest tree height using small footprint Lidar data[J]. World Forestry Research, 2014,27(2):29-34. ]

[28]
王轶夫,岳天祥,赵明伟,等.机载LIDAR数据的树高识别算法与应用分析[J].地球信息科学学报,2014,16(6):958-964.<p>利用机载激光雷达数据提取天然次生林的树高, 旨在探索影响树高提取精度的主要因素。首先, 采用高精度曲面建模平差算法(Adjustment Computation of High-accuracy Surface Modeling, HASM-AD)生成研究区不同空间分辨率的数字高程模型(Digital Elevation Model, DEM)、数字地表模型(Digital Surface Model, DSM)和冠层高度模型(Canopy Height Model, CHM); 其次, 用树顶点识别算法提取林木树高, 设置不同树高识别范围, 对比分析不同CHM分辨率和不同树高识别范围对树高提取精度的影响; 最后, 以天涝池流域30 个实测样地数据为样本, 对提取精度进行检验。结果显示:提取的样地平均树高与实测值具有明显线性相关关系, 线性回归系数为0.694; 树高识别范围是影响树高提取精度的重要因素, CHM分辨率对其影响较小。研究表明, 采用高采样密度的雷达点云数据、正确选择CHM生成方法和改进树顶点识别算法是提高天然次生林树高提取精度的有效途径。</p>

DOI

[ Wang Y F, Yue T X, Zhao M W, et al.Study of factors impacting the tree height extraction based on airborne LiDAR data[J]. Journal of Geo-information Science, 2014,16(6):958-964. ]

Outlines

/