
Journal of Geo-information Science >
Urban Micro-climate Simulation Based on 3D Modeling
Received date: 2015-10-09
Request revised date: 2016-05-11
Online published: 2016-09-27
Copyright
With the continuous advancement of urbanization, the aggravating urban heat island effect and a series of environmental problems caused by it is becoming severe, which hurdles the progress of urbanization gradually. The urban local micro-climate study tentatively combines the burgeoning 3D modeling with micro-climate simulation, so as to help the city managers to find an effective way to improve the urban micro-climate quality through adopting the simulation data and the model generated in the study. By taking the Zhujiang New Town Western District as an example, this study builds a 3D model of the city using the CGA rules, summarizes the related sub-models of micro-climate simulation, and runs a simulation of the study area with the weather factors such as temperature, humidity, wind speed and wind direction by using the local micro-climate simulation software. At last, it integrates the results and produces a visual presentation. The micro-climate simulation result is combined with the 3D model of the study area. It gives a visual analysis on the impacts of construction height, density and layout to the local micro-climate weather distribution, and gives the corresponding development advices and planning strategy. This method has overcome the limits of previous micro-climate studies which were constrained to field measurement and depended on previous climate data. The modeling approach gives a detailed presentation of the city construction layout and structure, and integrates ENVI-met into the micro-climate simulation, thus the urban micro-climate study can be improved to incorporate the trend of integrating 3D modeling. It provides a new way of thinking and a new assistant decision-making tool for the urban planning and micro-climate simulation studies in different regions. In terms of the relationship between the structure and the layout of urban construction and urban micro-climate, it presents a more visualized result.
Key words: CityEngine; CGA; urban microclimate; ENVI-met; Zhujiang New Town
ZHENG Zihao , CHEN Yingbiao , QIAN Qinglan , LI Yong , XIE Jinpeng . Urban Micro-climate Simulation Based on 3D Modeling[J]. Journal of Geo-information Science, 2016 , 18(9) : 1199 -1208 . DOI: 10.3724/SP.J.1047.2016.01199
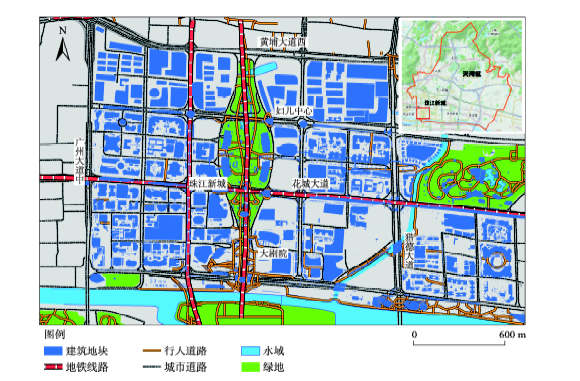
Fig.1 Location map of Zhujiang New Town Western District图1 珠江新城西区区位图 |
Tab.1 Overview on all the files in ENVI-met表1 ENVI-met数据文件类型 |
| 文件类型 | 文件列表 | 定义 |
|---|---|---|
| 输入文件 | A1.配置文件.CF | 定义一个单独模拟的设置 |
| A2.区域输入文件.IN | 定义模拟的区域(建筑物,植物等) | |
| A3.序列文件.EBF | 允许定义单个模拟的次序 | |
| 数据库文件 | B1.土壤数据库SOILS.DAT | 定义不同的自然和人工土壤的性质 |
| B2.配置文件数据库PROFILES.DAT | 从SOILS.DAT文件中以垂直的土壤三明治结构来定义不同的土壤类型 | |
| B3.植被数据库PLANTS.DAT | 定义所有的植被 | |
| B4.源数据库SOURCES.DAT | 定义颗粒或者气体源的输出和喷射高度 | |
| 输出文件 | C1.主数据文件.EDI/.EDT | 链接到配置文件中[LOCALDB]部分的描述 |
| C2.接收器文件 | 模型区域内用户选择的点的数据 | |
| C3.1D-Model 文件 | 包含1维模型的状态 | |
| C4.BOTworld 文件 | 创建BOTworld模型的链接 | |
| 其它文件 | D1.定义别名(MYALIAS.DAT) | 使用相对文件路径,便于计算机之间模拟传输 |
3.2 研究方法 |
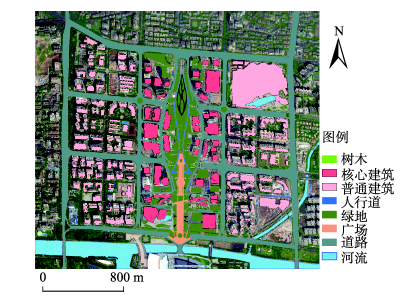
Fig.2 The classification results of each lot图2 各地块分类结果分布图 |
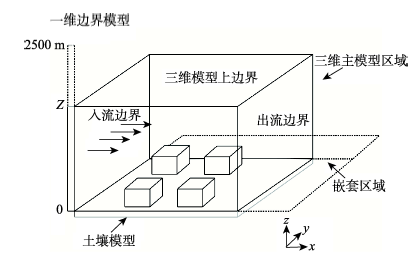
Fig.3 Schematic overview of the ENVI-met model layout图3 ENVI-met模型布局概述示意图 |
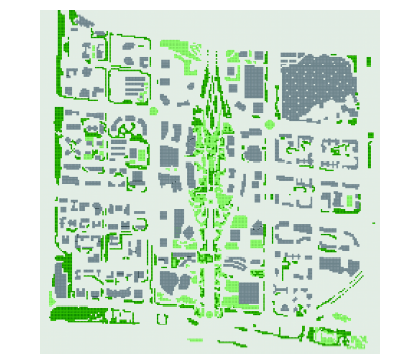
Fig.4 ENVI-met regional model图4 ENVI-met区域模型图 |
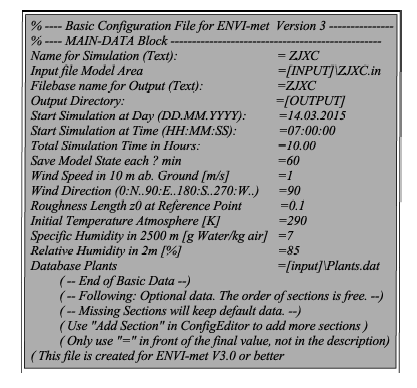
Fig.5 The configuration file of ENVI-met图5 ENVI-met的配置文件 |
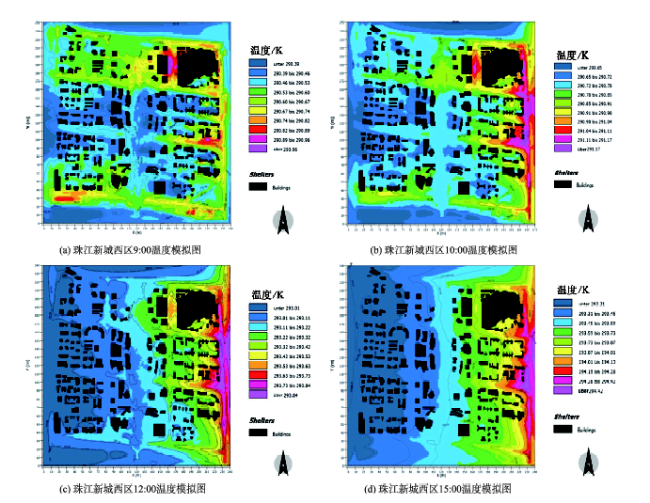
Fig.6 The temperature distribution of Zhujiang New Town Western District图6 珠江新城西区温度模拟图 |
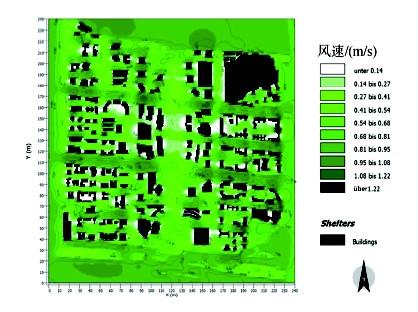
Fig.7 The wind speed distribution of Zhujiang New Town Western District at 9:00图7 珠江新城西区9:00水平面风速模拟图 |
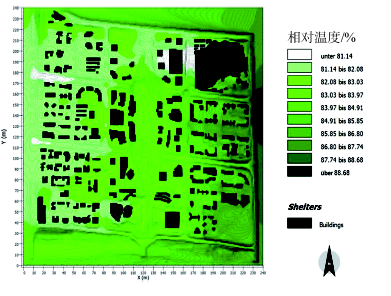
Fig.8 The spec.humidity distribution of Zhujiang New Town Western District at 9:00图8 珠江新城西区9:00水平面相对湿度模拟图 |
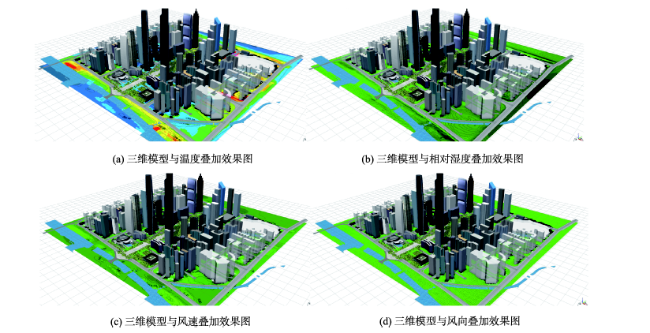
Fig.9 The micro climate distribution maps stacking with the 3D model of Zhujiang New Town Western District图9 珠江新城三维模型与微气候分布模拟图 |
The authors have declared that no competing interests exist.
| [1] |
[
|
| [2] |
[
|
| [3] |
[
|
| [4] |
[
|
| [5] |
[
|
| [6] |
|
| [7] |
[
|
| [8] |
[
|
| [9] |
[
|
| [10] |
[
|
| [11] |
|
| [12] |
|
| [13] |
|
| [14] |
|
| [15] |
|
| [16] |
|
| [17] |
|
| [18] |
ESRI中国. Esri CityEngine中文教程[Z]. 2012. [ ESRI China. Esir CityEngine Chinese tutorials[Z]. 2012. ]
|
| [19] |
[
|
| [20] |
ENVI-MET. ENVI-met online documents[EB/OL]. .
|
| [21] |
[
|
| [22] |
[
|
/
| 〈 |
|
〉 |