
Journal of Geo-information Science >
Ecological Security of Wetland in Chang-Zhu-Tan Urban Agglomeration
Received date: 2016-03-08
Request revised date: 2016-04-08
Online published: 2016-09-27
Copyright
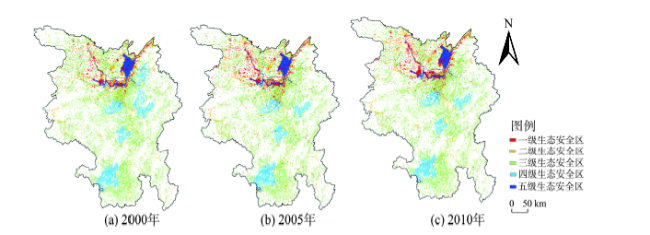
This paper takes Chang-Zhu-Tan Urban Agglomeration as study area. Based on the vegetation index and land use data interpreted from Landsat TM images and combined with the population, economic and climate data, a framework model was established. The results show that: (1) the mean values of wetland ecological security index in 2000, 2005 and 2010 for Chang-Zhu-Tan Urban Agglomeration were 0.7268, 0.7151 and 0.7196, respectively. The status of regional wetland ecological security was good, and the ecological security degree was relatively safe. In the recent decade, the overall performance of the regional ecological security index had decreased, and the decrease of the corresponding area was 21577 km2, which accounted for 22.28% of the total land area; (2) in this study area, there is obvious difference of regional ecological security, that the first-class wetland ecological safety area mainly distributed in the surrounding regions of Dongting Lake, the second-class ecological safety region distributed along the major rivers, the third-class ecological safety area mainly distributed in the border area of two or three cities, and the fourth-class wetland ecological safety area mainly distributed in Yueyang city, Xiangtan city, Changsha city and Hengyang city. (3) During the study period, the area of wetland in Chang-Zhu-Tan Urban Agglomeration has changed obviously, that the total area of wetland has decreased year after year. The fractal dimension of forest swamp, herbaceous swamp, lake, river and paddy field showed an increasing trend. The fragmentation index of ponds/rivers was significantly higher than that of other types of landscape, and the value of wetland ecosystem services was decreasing in general. Finally, the main factors affecting the ecological security of wetland were analyzed from the aspects of land use change and transition, and wetland landscape structure and function.
LIAO Liuwen , QIN Jianxin . Ecological Security of Wetland in Chang-Zhu-Tan Urban Agglomeration[J]. Journal of Geo-information Science, 2016 , 18(9) : 1217 -1226 . DOI: 10.3724/SP.J.1047.2016.01217
Tab.1 Ecological security evaluation indicator system and designated weights of wetland in Chang-Zhu-Tan Urban Agglomeration表1 环长株潭城市群湿地生态安全评价指标体系及其权重 |
| 目标层A | 准则层B | 要素层C | 指标层D |
|---|---|---|---|
| 湿地生态安全综合评价 | 压力 B1 | 人口经济状况 C1(0.5) | 人口密度 D11 (0.0801) |
| (0.2402) | 国内生产总值 D12 (0.04) | ||
| 气候状况 C2(0.5) | 年平均气温 D21(0.048) | ||
| 年平均降水 D22(0.048) | |||
| 干燥度 D23(0.024) | |||
| 状态 B2 | 植被状况 C3(0.3333) | 植被净初级生产力 D31 (0.035) | |
| (0.2098) | 归一化植被指数 D32(0.035) | ||
| 景观结构 C4(0.6667) | 破碎化指数 D41(0.0278) | ||
| 分维数 D42(0.0234) | |||
| 景观优势度指数 D43(0.0556) | |||
| 斑块数量 D44(0.0331) | |||
| 响应 B3 | 面积变化 C5(0.5) | 某类湿地斑块面积占湿地斑块总面积比重 D51(0.0917) | |
| (0.5499) | 湿地面积 D52 (0.1833) | ||
| 湿地生态系统功能 C6(0.5) | 生态弹性度 D61(0.1375) | ||
| 生态系统服务功能 D62(0.1375) |
3.3 指标说明及获取方式 |
Tab.2 Ecosystem Services Value (ESV) coefficients of wetland (RMB/km2/year)表2 湿地生态系统服务价值系数(元/km2/年) |
| 供水 | 文化 | 娱乐 | 水分调控 | 食物供应 | 污染物净化 | 气候调节 | 生物多样性 | |
|---|---|---|---|---|---|---|---|---|
| 沼泽 | 630.80 | 146.16 | 40.75 | 2.49 | 3.90 | 137.70 | 36.60 | 87.60 |
| 湖泊/河流 | 175.71 | - | 19.09 | 451.94 | 3.40 | 55.20 | 36.60 | - |
| 农田 | - | - | - | - | 4.48 | - | - | - |
注:沼泽对应区域森林沼泽、草本沼泽和灌丛沼泽湿地类型;湖泊/河流对应湖泊、河流、坑塘/水库生态系统;农田对应水田;湿地的气候调节、生物多样性价值系数参考Groot等的研究成果;其他系数参考Costanza等的研究成果 |
Tab.3 Ecological security grading standard of wetland in Chang-Zhu-Tan Urban Agglomeration表3 环长株潭城市群湿地生态安全等级划分标准 |
| 等级 | 综合指数范围 | 生态安全状态 | 生态安全度 |
|---|---|---|---|
| 一级 | [0.1,0.5) | 差 | 危险 |
| 二级 | [0.5,0.6) | 较差 | 较危险 |
| 三级 | [0.6,0.7) | 一般 | 预警 |
| 四级 | [0.7,0.8) | 良好 | 较安全 |
| 五级 | [0.8,1.0] | 好 | 安全 |
Fig.1 Ecological security level distribution of wetland in Chang-Zhu-Tan Urban Agglomeration (from 2000 to 2010)图1 环长株潭城市群湿地生态安全等级分布(2000-2010年) |
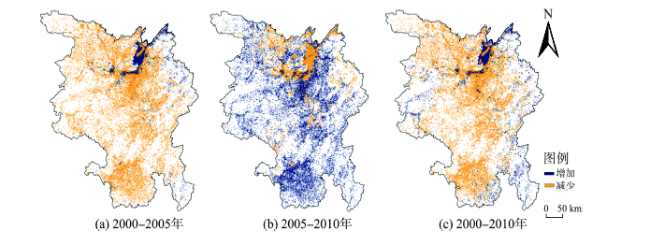
Fig.2 The change of ecological security index of wetland in Chang-Zhu-Tan Urban Agglomeration from 2000 to 2010图2 2000-2010年环长株潭城市群湿地生态安全指数变化 |
Tab.4 Area change of wetland in Chang-Zhu-Tan urban agglomeration from 2000 to 2010 (km2)表4 2000-2010年环长株潭城市群湿地面积变化(km2) |
| 年份 | 森林沼泽 | 灌丛沼泽 | 草本沼泽 | 湖泊 | 水库/坑塘 | 河流 | 水田 | 湿地总面积 |
|---|---|---|---|---|---|---|---|---|
| 2000 | 435.45 | 0.68 | 1693.83 | 1716.83 | 843.62 | 1425.82 | 20 562.42 | 26 678.66 |
| 2005 | 429.81 | 0.93 | 1688.63 | 1719.18 | 913.74 | 1422.58 | 20 273.52 | 26 448.39 |
| 2010 | 438.64 | 0.71 | 1697.60 | 1730.08 | 783.91 | 1456.94 | 20 213.97 | 26 321.85 |
Tab.5 Change matrix of wetland (km2)表5 区域湿地转移矩阵(2000-2010年)(km2) |
| 2000年土地 利用类型 | 2010年土地利用类型 | 总计(2010年) | 减少 | |||||||
|---|---|---|---|---|---|---|---|---|---|---|
| 森林沼泽 | 灌丛沼泽 | 草本沼泽 | 湖泊 | 水库/坑塘 | 河流 | 水田 | 非湿地区 | |||
| 森林沼泽 | 435.25 | 0.00 | 0.03 | 0.00 | 0.00 | 0.00 | 0.01 | 0.17 | 435.45 | 0.20 |
| 灌丛沼泽 | 0.00 | 0.68 | 0.00 | 0.00 | 0.00 | 0.00 | 0.00 | 0.00 | 0.68 | 0.00 |
| 草本沼泽 | 0.00 | 0.00 | 1690.18 | 0.13 | 0.00 | 0.31 | 0.91 | 2.30 | 1693.83 | 3.65 |
| 湖泊 | 0.34 | 0.00 | 0.00 | 1707.76 | 0.02 | 0.13 | 0.66 | 7.92 | 1716.83 | 9.07 |
| 水库/坑塘 | 0.80 | 0.00 | 2.09 | 2.93 | 764.14 | 3.09 | 19.25 | 51.32 | 843.62 | 79.47 |
| 河流 | 0.25 | 0.00 | 0.37 | 0.00 | 0.24 | 1423.50 | 0.43 | 1.03 | 1425.82 | 2.32 |
| 水田 | 1.33 | 0.03 | 2.38 | 10.52 | 14.18 | 25.99 | 20 092.41 | 415.58 | 20 562.42 | 470.02 |
| 非湿地区 | 0.67 | 0.00 | 2.55 | 8.74 | 5.32 | 3.93 | 100.30 | 70 104.08 | 70 225.38 | 121.50 |
| 总计(2000年) 增加 | 438.64 3.39 | 0.71 0.03 | 1697.60 7.42 | 1730.08 22.32 | 783.91 19.77 | 1456.94 33.44 | 20 213.97 121.56 | 70 582.19 478.41 | ||
4.3.2 湿地景观结构与功能变化分析 |
Tab.6 Changes of ESV in Hunan province in Chang-Zhu-Tan Urban Agglomeration from 2000 to 2010 (10000 RMB /km2/year)表6 2000-2010年环长株潭城市群湿地生态系统服务价值变化(万元/km2/年) |
| 年份 | 时段 | ||||||
|---|---|---|---|---|---|---|---|
| 2000 | 2005 | 2010 | 2000-2005 | 2005-2010 | 2000-2010 | ||
| 森林沼泽 | 47.29 | 46.68 | 47.64 | -0.61 | 0.96 | 0.35 | |
| 灌丛沼泽 | 0.07 | 0.10 | 0.08 | 0.03 | -0.02 | 0.01 | |
| 草本沼泽 | 183.95 | 183.39 | 184.36 | -0.56 | 0.97 | 0.41 | |
| 湖泊 | 127.38 | 127.55 | 128.36 | 0.17 | 0.81 | 0.98 | |
| 水库/坑塘 | 62.59 | 67.79 | 58.16 | 5.2 | -9.63 | -4.43 | |
| 河流 | 105.79 | 105.47 | 108.10 | -0.32 | 2.63 | 2.31 | |
| 水田 | 9.22 | 9.09 | 9.06 | -0.13 | -0.03 | -0.16 | |
| 合计 | 536.29 | 540.07 | 535.75 | 3.78 | -4.32 | -0.54 |
4.3.3 自然因素分析 |
The authors have declared that no competing interests exist.
| [1] |
[
|
| [2] |
|
| [3] |
[
|
| [4] |
[
|
| [5] |
[
|
| [6] |
|
| [7] |
|
| [8] |
|
| [9] |
[
|
| [10] |
[
|
| [11] |
[
|
| [12] |
[
|
| [13] |
[
|
| [14] |
[
|
| [15] |
[
|
| [16] |
[
|
| [17] |
[
|
| [18] |
|
| [19] |
|
| [20] |
[
|
| [21] |
|
| [22] |
[
|
| [23] |
[
|
| [24] |
[
|
| [25] |
[
|
| [26] |
[
|
| [27] |
[
|
| [28] |
|
| [29] |
|
| [30] |
|
| [31] |
[
|
/
| 〈 |
|
〉 |