
Journal of Geo-information Science >
Spatial Similarity Assessment of Point Clusters in Multi-scale Map Spaces Based on Analytic Hierarchy Process
Received date: 2015-12-15
Request revised date: 2016-04-14
Online published: 2016-10-25
Copyright
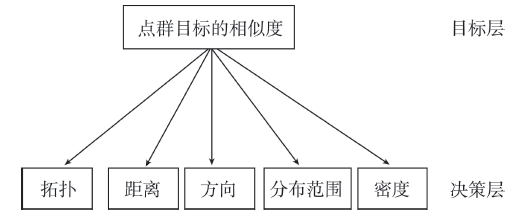
Similarity relation is one of the focal spatial relations in the community of geographic information science and cartography. The spatial similarity calculation in multi-scale map spaces is a research hot spot in Geographic Information Systems (GIS). Point cluster object contains plenty of structured information in its spatial distribution. Its similarity is widely used in the retrieval and query of spatial databases and is also used to analyze and process the spatial data, to recognize the spatial objects from image and to describe the spatial features on maps. Point clusters can be taken as a simple spatial object in geographic space and with studying its similarity we are able to evaluate the result of computer drawing and to calculate complex clusters' similarity, such as the spatial line clusters, the spatial polygon groups and a mixture of points, lines and polygons. Previous theoretical researches mainly focus on a single factor that could impact the point group target, then analyze the impact factor of the point clusters, and in the end, carry out a calculation model without considering the effect of mixing factors. However, so far these researches have hardly made any significant achievements. In this paper, with the consideration of the Gestalt principles from visual cognition, incorporating predecessors' research results, a calculation model is proposed to comprehensively grasp the point clusters similarity in detail. In order to calculate the similarity between different point clusters in the multi-scale map spaces, the main factors that could affect the similarities of point cluster objects were integrated, including the topological relation, the distribution range, the direction relation, the distance relation and the distribution density. Then, this paper discusses the calculation methods of the topological relation, direction relation, distance relation, distribution range and distribution density for point clusters in the multi-scale map spaces. According to the calculations of the five factors, this paper describes the topological relation using the concept of topological neighbor, represents the distribution range by stripping the outside triangles after triangulation, uses the trend of main skeleton for point clusters to express the direction relation, indicates the distance relation by calculating the mean distance between each point and the distribution center for each point cluster, and expresses the distribution range by the overall relative density. Their complete similarity calculation models were put forward respectively at the same time. Analytic Hierarchy Process (AHP) analysis method was adopted for weight assignment, which is a qualitative and quantitative method and can be systematic. Hierarchical analysis method of weighting factor was integrated to address the impact of weight problem. It only uses a small amount of quantitative information, with the help of mathematical methods, complex issues can be simplified. The importance of different factors were taken into account, and the topological relation weight, the direction relation weight, the distance relation weight, the distribution range weight and the distribution density weight were calculated. Finally, the integrated similarity calculation model with the influential factors' weights for point clusters in multi-scale map spaces was established. The validation results of an example shows that the model can accurately calculate the spatial similarity of point clusters in multi-scale map spaces, meanwhile the model is proved to be feasible and effective , which can be applied to evaluate the quality of map generalization.
DUAN Xiaoqi , LIU Tao , WU Dan . Spatial Similarity Assessment of Point Clusters in Multi-scale Map Spaces Based on Analytic Hierarchy Process[J]. Journal of Geo-information Science, 2016 , 18(10) : 1312 -1321 . DOI: 10.3724/SP.J.1047.2016.01312
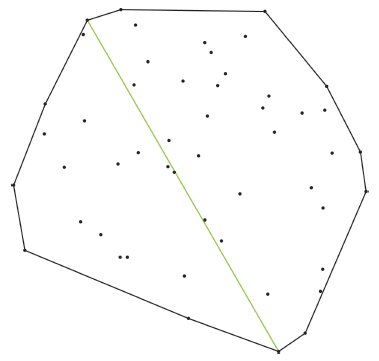
Fig. 1 Convex hull and its diameter for the point clusters图1 点群的凸壳与凸壳直径 |
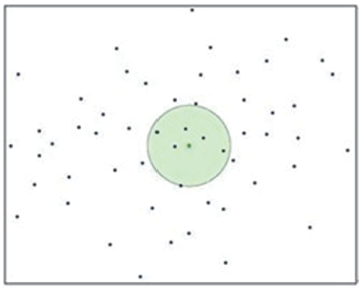
Fig. 2 Topological neighbors of a certain point图2 点的拓扑邻居 |
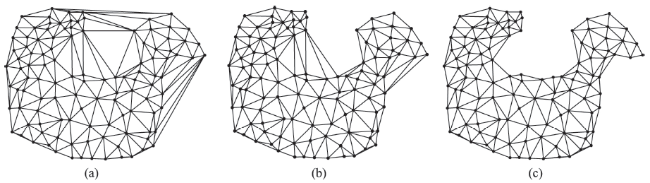
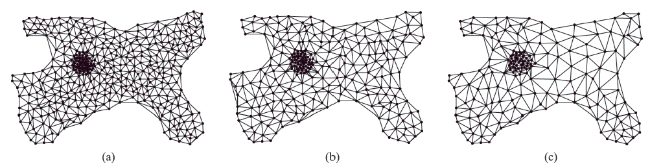
Fig. 3 The rendering result of the gradual stripping of outside triangles图3 点群逐步“剥皮”效果图 |
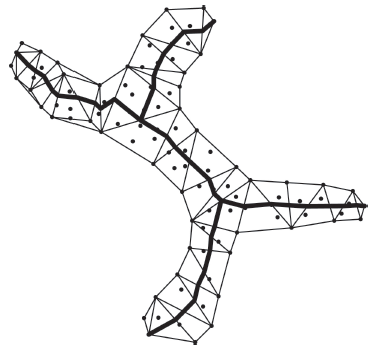
Fig. 4 Skeleton line of the point clusters图4 点群的骨架线 |
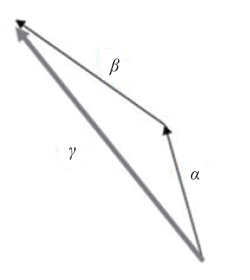
Fig. 5 The sum of two vectors图5 2个向量之和 |
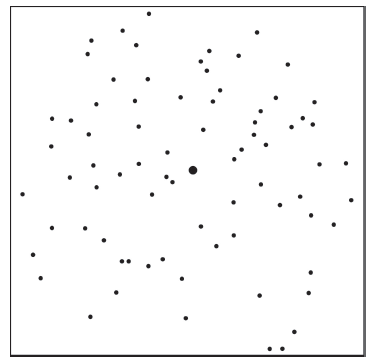
Fig. 6 Distribution center of the point clusters图6 点群的分布中心 |
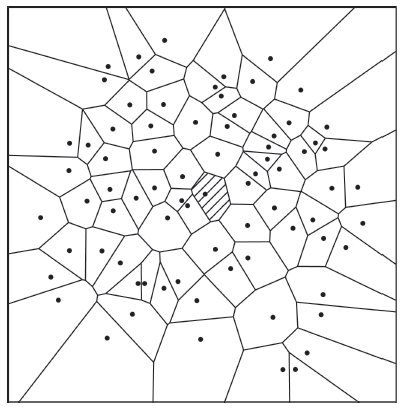
Fig. 7 Voronoi map of the point clusters图7 点群的voronoi图 |
Tab. 1 Scales of the comparison results between two factors表1 因子两两比较的标度 |
| 标度 | 定义 |
|---|---|
| 1 | i因素与j因素同样重要 |
| 3 | i因素比j因素略重要 |
| 5 | i因素比j因素较重要 |
| 7 | i因素比j因素非常重要 |
| 9 | i因素比j因素绝对重要 |
| 2,4,6,8 | 为以上判断之间中间状态对应的标度值 |
| 倒数 | 若j因素与i因素比较,得到的判断值为aji=1/aij |
Fig. 8 Map of AHP图8 层次分析模型图 |
Tab. 2 Degrees of freedom表2 自由度指标 |
| 维度(n) | 1 | 2 | 3 | 4 | 5 | 6 | 7 | 8 | 9 |
|---|---|---|---|---|---|---|---|---|---|
| RI | 0 | 0 | 0.58 | 0.96 | 1.12 | 1.24 | 1.32 | 1.41 | 1.45 |
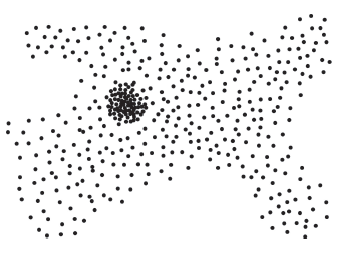
Fig. 9 Point cluster 1 (1:50 000 scale)图9 点群1(1:5万) |
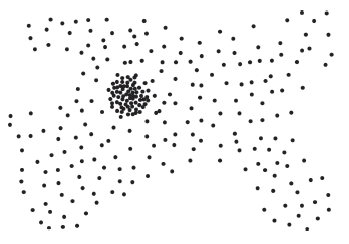
Fig. 10 Point cluster 2 (1:100 000 scale)图10 点群2 (1:10万) |
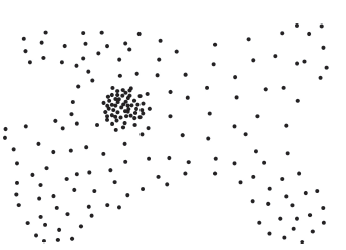
Fig. 11 Point cluster 3 (1:250 000 scale)图11 点群3(1:25万) |
Fig. 12 Topological relationships among the three point clusters图12 3个点群目标的拓扑关系 |
Tab. 3 The measurement of topology relations for the three point clusters表3 点群目标拓扑关系的度量 |
| 点群 | 拓扑邻居个数 |
|---|---|
| 点群1(1:5万) | 11 018 |
| 点群2(1:10万) | 10 344 |
| 点群3(1:25万) | 9970 |
Tab. 4 Measurement of target rangesfor the three point clusters表4 点群目标之间分布范围的度量 |
| 分布范围 | |
|---|---|
| 点群1(1:5万) | 6529327289066 |
| 点群2(1:10万) | 6513135366243 |
| 点群3(1:25万) | 6460226854835 |
Fig. 13 Distribution range of the three point clusters图13 3个点群目标的分布范围 |
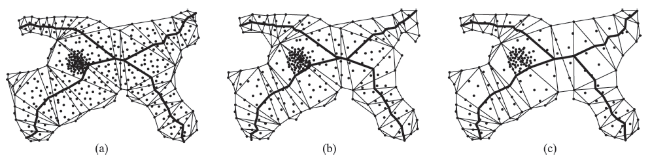
Fig. 14 The main skeleton lines of the three points clusters图14 3个点群目标的主骨架线 |
Tab. 5 The main skeleton lines’ angle measurements of the three point clusters表5 三个点群目主骨架线度量值 |
| 点群 | 主骨架线角度 |
|---|---|
| 点群1(1:5万) | 36.21 |
| 点群2(1:10万) | 37.71 |
| 点群3(1:25万) | 39.01 |
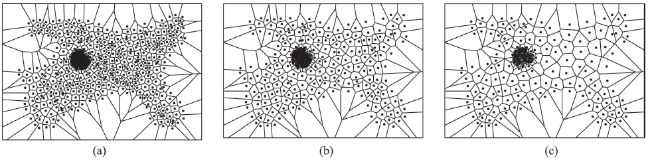
Tab. 6 Distribution density and distance measurement of the three point clusters表6 点群的分布密度和距离关系度量值 |
| 点群 | 距离关系 | 分布密度关系 |
|---|---|---|
| 点群1 | 1022371.980 | 0.792 |
| 点群2 | 997499.395 | 0.739 |
| 点群3 | 1054575.400 | 0.703 |
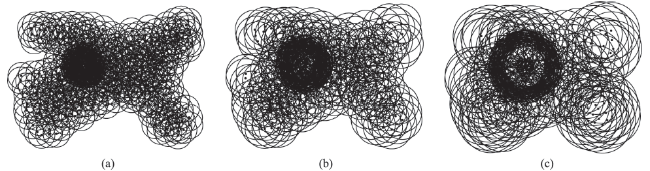
Fig. 15 Voronoi maps of each point clusters图15 各个点群目标的voronoi图 |
Tab. 7 Similarities for each factor between different groups of point clusters and the correspondingoverall similarities表7 点群各因子的相似度及总体相似度 |
| 点群 | SIMTopo | SIMFb | SIMDir | SIMDis | SIMDen | SIM |
|---|---|---|---|---|---|---|
| 点群(1,2) | 0.939 | 0.960 | 0.998 | 0.976 | 0.933 | 0.958 |
| 点群(1,3) | 0.905 | 0.928 | 0.989 | 0.969 | 0.888 | 0.934 |
The authors have declared that no competing interests exist.
| [1] |
[
|
| [2] |
[
|
| [3] |
|
| [4] |
|
| [5] |
|
| [6] |
[
|
| [7] |
[
|
| [8] |
[
|
| [9] |
[
|
| [10] |
郭仁忠.空间分析(
[
|
| [11] |
[
|
| [12] |
|
| [13] |
[
|
| [14] |
|
| [15] |
[
|
| [16] |
[
|
| [17] |
[
|
| [18] |
[
|
| [19] |
[
|
| [20] |
[
|
| [21] |
|
| [22] |
[
|
/
| 〈 |
|
〉 |