
Journal of Geo-information Science >
Study on Urban Planning and Its Ecological Effect
Received date: 2015-12-01
Request revised date: 2016-03-21
Online published: 2016-10-25
Copyright
In recent years, the urban built-up area continues to expand along with the continuous improvement of urbanization degree. Also, the property of urban land is changing. In various types of urban planning land, different urban construction plannings can cause different ecological effects. The study on the differences and the causes of their formations can provide a good decision support to urban planning managers, and it is of great significance for the construction of an ecological livable city. In this paper, two Landsat images of 2009 and 2013 were utilized to computer the Remote Sensing Ecological Index (RSEI). Combined with the newly approved Urban Master Planning of Fuzhou City by the State Council of China, five planning classes of the master planning, with 22 selected plots, were investigated to reveal their ecological changes before and after the implementation of construction planning. It is found that the ecological qualities of the five classes are all declining, which indicates an overall drop down in the RSEI value by 12%. Among them, the RSEI of the industrial class falls by 18% and the ecological degradation of the industrial class is the most sever one. At the same time, the ecological quality of the municipal utilities class falls by 14%, the ecological quality of the residential class falls by 11%, the ecological quality of the administration and public services class falls by 8%, and the ecological quality of the commercial and business facilities class falls by 6%. The main factors which lead to the degradation of ecological quality after the completion of urban planning are the significant decrease in vegetation and water, and the considerable increase in coverage for built-up impervious surface. Combining with the research results of this paper, we also put forward suggestions for the urban planning management department.
Key words: urban planning; ecological change; remote sensing; Fuzhou
LIU Zhicai , XU Hanqiu , LIN Zhongli , HUANG Shaolin . Study on Urban Planning and Its Ecological Effect[J]. Journal of Geo-information Science, 2016 , 18(10) : 1352 -1359 . DOI: 10.3724/SP.J.1047.2016.01352
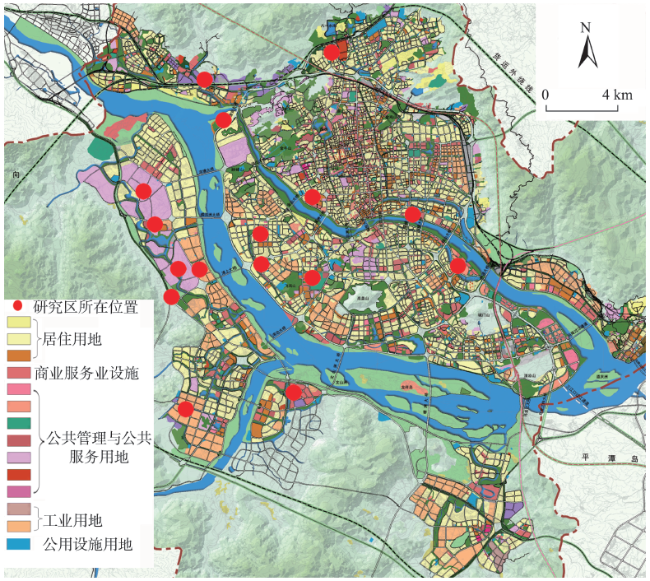
Fig. 1 The master planning map of Fuzhou (2011-2020) and the locations of the selected study plots图1 福州市城市总体规划(2011-2020年)及研究地块位置示意图 |
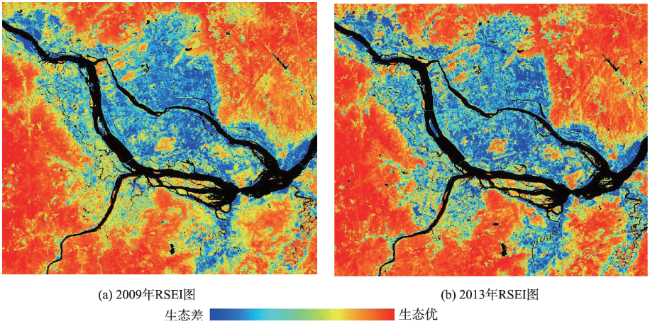
Fig. 2 RSEI images of Fuzhou图2 福州市遥感生态指数(RSEI)影像 |
Tab. 1 Ecological changes of the five urbanplanning classes in Fuzhou表1 福州市主要城市规划用地类型生态变化表 |
| 用地类型 | 地块数 /个 | RSEI均值 | 变化情况/(%) | |
|---|---|---|---|---|
| 2009年 | 2013年 | |||
| 工业用地 | 3 | 0.627 | 0.514 | -18.02 |
| 公用设施用地 | 3 | 0.516 | 0.441 | -14.53 |
| 居住用地 | 5 | 0.483 | 0.430 | -10.97 |
| 公共管理与公共服务用地 | 8 | 0.456 | 0.421 | -7.68 |
| 商业服务业设施用地 | 3 | 0.360 | 0.340 | -5.56 |
| 均值 | 0.488 | 0.429 | -12.09 | |
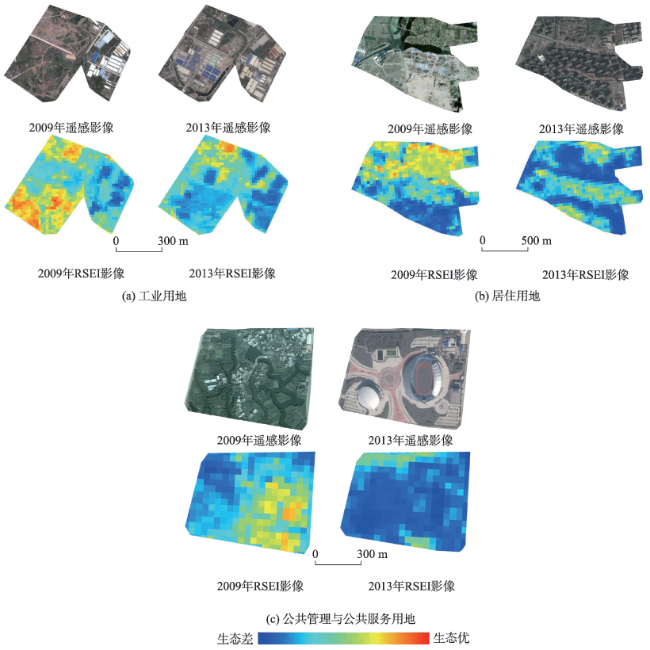
Fig. 3 Remote sensing images of the representative plots and their corresponding RSEI images before and after the construction图3 代表性地块建设前后的遥感影像及所对应的遥感生态指数(RSEI)影像 |
Tab. 2 Changes of the four sub-indicators of RSEI for the three representative plots表2 代表性地块的各分指标变化统计 |
| 用地类型 | 各分指标 | 指标值 | 变化 | |
|---|---|---|---|---|
| 2009年 | 2013年 | |||
| 工业用地 | IBI | 0.569 | 0.649 | + |
| LST | 0.385 | 0.518 | + | |
| NDVI | 0.697 | 0.615 | - | |
| WET | 0.772 | 0.752 | - | |
| 居住用地 | IBI | 0.631 | 0.685 | + |
| LST | 0.415 | 0.575 | + | |
| NDVI | 0.627 | 0.586 | - | |
| WET | 0.749 | 0.744 | - | |
| 公共管理与公共服务用地 | IBI | 0.637 | 0.700 | + |
| LST | 0.420 | 0.610 | + | |
| NDVI | 0.600 | 0.520 | - | |
| WET | 0.760 | 0.730 | - | |
注:“+”代表指标上升,“-”代表指标下降 |
The authors have declared that no competing interests exist.
| [1] |
|
| [2] |
|
| [3] |
[
|
| [4] |
[
|
| [5] |
[
|
| [6] |
[
|
| [7] |
[
|
| [8] |
|
| [9] |
|
| [10] |
|
| [11] |
[
|
| [12] |
|
| [13] |
|
| [14] |
[
|
| [15] |
|
| [16] |
[ Zhu,
|
| [17] |
|
| [18] |
|
| [19] |
国家环保总局.中华人民共和国环境保护行业标准(试行)HJ/T192-2006[S].北京:中国环境科学出版社, 2006.
[ The State Environmental Protection Administration. The People's Republic of China environmental protection industry standards (trial) HJ/T192-2006[S]. Beijing: China Environmental Science Press, 2006. ]
|
| [20] |
[
|
| [21] |
[
|
| [22] |
国家环保总局.中华人民共和国环境保护行业标准HJ192-2015[S].北京:中国环境科学出版社,2015.
[ The State Environmental Protection Administration. The People's Republic of China environmental protection industry standards HJ192-2015[S]. Beijing: China Environmental Science Press, 2015. ]
|
| [23] |
福州市人民政府. 福州市城市总体规划(2011-2020年)[EB/OL]. [2014-08-18]. [2015-08-05]. .
[The Government of Fuzhou. The master planning of Fuzhou (2011-2020)[EB/OL]. , 2014-08-18/2015-08-05.]
|
| [24] |
中华人民共和国国家标准. GB50137-2011, 城市用地分类与规划建设用地标准[S].2012.
[ GB50137-2011. Code for classification of urban land use and planning standards of development land[S].2012. ]
|
| [25] |
|
| [26] |
|
| [27] |
[
|
| [28] |
[
|
| [29] |
[
|
| [30] |
[
|
| [31] |
|
| [32] |
|
| [33] |
|
| [34] |
|
| [35] |
ICESS. MODIS UCSB emissivity library [EB/OL]. .
|
| [36] |
|
/
| 〈 |
|
〉 |