
Journal of Geo-information Science >
The Remote Sensing Model for Estimating Urban Impervious Surface Percentage Based on the Cubist Model Tree
Received date: 2015-09-14
Request revised date: 2015-12-20
Online published: 2016-10-25
Copyright
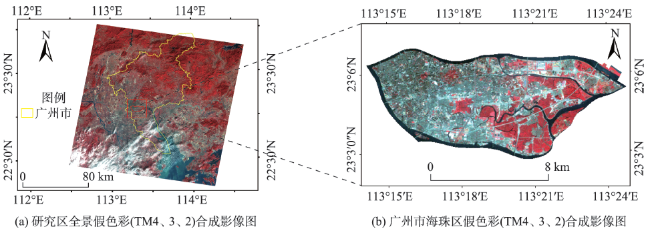
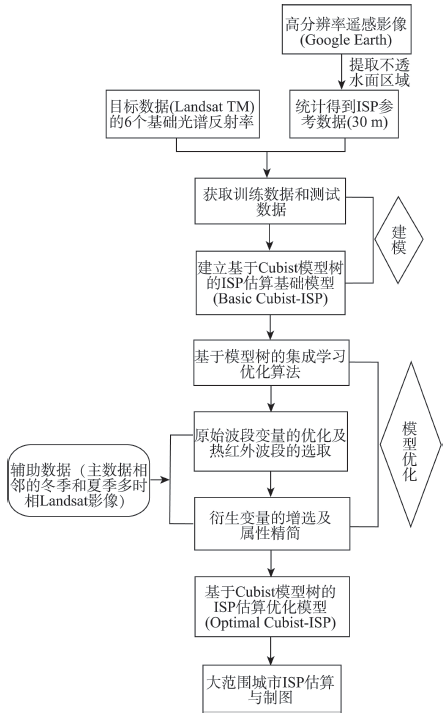
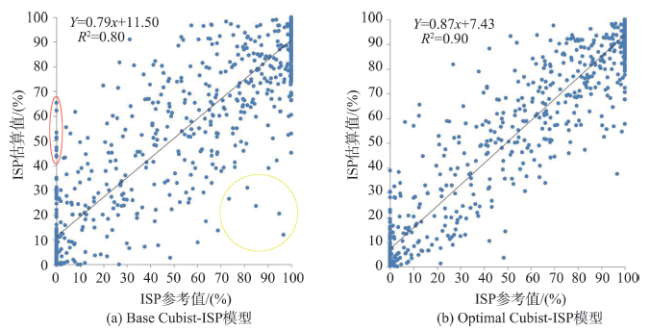
As a typical land-cover type, impervious surface is a key indicator of urban environmental quality and urbanization scope. In comparison with the traditional remote sensing image processing methods, the assessment of impervious surface percentage (ISP) can offer the sub-pixel level exploration and acquire the fine-scale information. In this paper, the proposed method uses the Cubist model tree with both the high-resolution (Google Earth) and the medium-resolution (Landsat TM/ETM+) remote sensing data to establish an estimation model of impervious surface percentage (ISP). A base model (Base Cubist-ISP) is built integrating all the original bands from Landsat TM excluding the thermal infrared band. This paper tries to minimize the effects of noise by adopting the ensemble learning algorithm and by incorporating the median of each solar-reflective band within the adjacent temporal images. After that, the following variables are filtered to get the optimized results, including the TM thermal infrared band, the derived variables from the original bands such as Texture, and the tasseled cap transformation variables. Then the variables are simplified, and in that way, the optimized parameter of ensemble learning algorithm for Cubist tree and the well-chosen variables are used to establish an optimization estimation model (Optimal Cubist-ISP). The results of a case study for Haizhu district, which is located in Guangzhou city of Guangdong Province, show that the overall root mean square error between the estimated ISP value, which is based on the Optimal Cubist-ISP model, and the reference ISP value is 12.98%, with a determinant coefficient of 0.90. Moreover, this paper compares the Base Cubist-ISP model with the Optimal Cubist-ISP model. The accuracy of the Optimal Cubist-ISP model is better than the Base Cubist-ISP model, and the RMSE decreases by about 5.03%. It is illustrated that the Base Cubist-ISP model may over-estimate the pervious surface area and under-estimate the high density impervious surface area, which could be improved by the model optimization. In addition, the Optimal Cubist-ISP model can not only be able to well recognize the land types of soil and water, but also eliminate the influence of shadow on the high density building area to a certain extent. Thus, the proposed approach on impervious surface estimation based on the Cubist model tree as well as its optimization scheme can be applied for precisely obtaining the ISP in the urban areas.
DAI Shu , FU Yingchun , ZHAO Yaolong . The Remote Sensing Model for Estimating Urban Impervious Surface Percentage Based on the Cubist Model Tree[J]. Journal of Geo-information Science, 2016 , 18(10) : 1399 -1409 . DOI: 10.3724/SP.J.1047.2016.01399
Fig.1 The study area图1 研究区 |
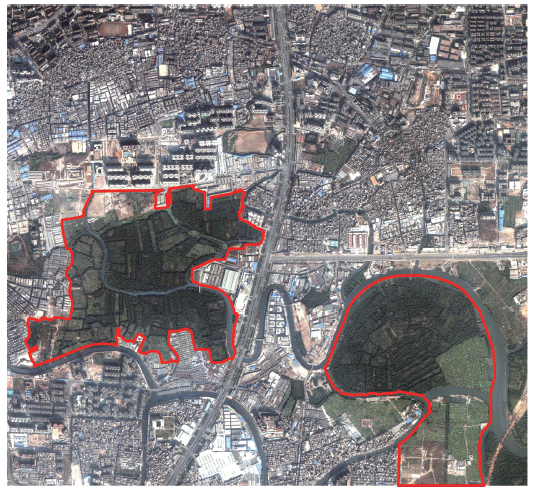
Fig.2 Google Earth image of the sample area图2 样本区Google Earth影像 |
Fig.3 Flow chart of the research图3 技术路线图 |
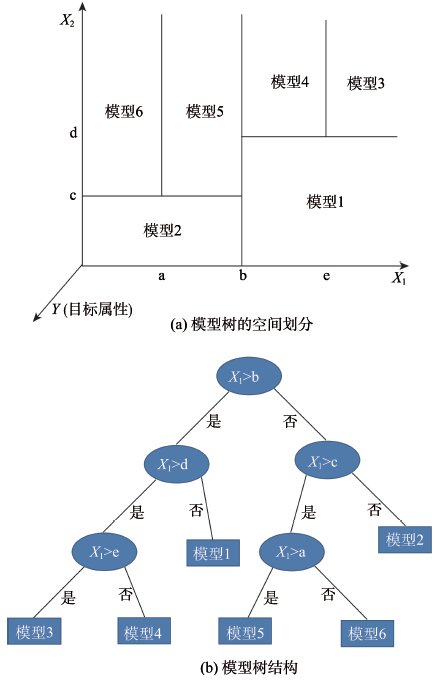
Fig.4 Illustrative diagrams of the Cubist model tree图4 Cubist模型树示意图 |
Tab.1 The comparison of accuracy before and after the optimization through ensemble learning algorithm based on the model trees表1 基于模型树的集成学习算法优化前后精度对比 |
| committees | MBE/(%) | MAE/(%) | RMSE/(%) |
|---|---|---|---|
| 1 | -0.47 | 12.51 | 18.01 |
| 100 | -0.25 | 12.19 | 17.50 |
Tab.2 Estimation of MAE and RMSE using various combinations of the independent variables from the original bands表2 各种原始波段自变量的组合的MAE和RMSE |
| 实验 | MAE/(%) | RMSE/(%) | 输入的自变量 |
|---|---|---|---|
| 1 | 12.19 | 17.50 | b1-6 |
| 2 | 10.92 | 16.20 | b1-6_med |
| 3 | 12.26 | 17.45 | b1-6,b7 |
| 4 | 11.26 | 16.21 | b1-6,su_b7 |
注:b1-6为2005年12月6日的TM1~TM5和TM7;b1-6_med为目标数据附近的冬季多时相中值合成的TM1~TM5和TM7;b7为2005年12月6日的TM6波段;su_b7为夏季(2004年6月29日)TM影像的热红外波段 |
Tab.3 Estimation of MAE and RMSE using various combinations of the derived variables表3 各种衍生自变量组合的精度评价指标MAE和RMSE |
| 实验 | MAE/(%) | RMSE/(%) | 输入的自变量(opt_b7:b1-6_med,su_b7) |
|---|---|---|---|
| 1 | 10.41 | 15.39 | opt_b7 |
| 2 | 10.34 | 15.42 | opt_b7,NDVI |
| 3 | 9.82 | 14.45 | opt_b7,NDVI_max |
| 4 | 8.77 | 12.67 | opt_b7,NDVI_max,NDBI,NDBaI,TC,Texture |
| 5 | 9.04 | 13.21 | opt_b7,NDBI,NDBaI,TC,Texture |
| 6 | 8.74 | 12.67 | opt_b7,NDVI_max,NDBaI,TC,Texture |
| 7 | 8.76 | 12.82 | opt_b7,NDVI_max,NDBI,TC,Texture |
| 8 | 8.84 | 12.72 | opt_b7,NDVI_max,NDBI,NDBaI,Texture |
| 9 | 9.38 | 13.83 | opt_b7,NDVI_max,NDBI,NDBaI,TC |
注:opt_b7为b1-6_med和su_b7合成的7个变量;NDVI:为目标数据的归一化植被指数;NDVI_max为2004年12月6日(TM)附近夏季NDVI最大合成值;NDBI为目标数据的归一化建筑指数;NDBaI为目标数据的归一化裸土指数;TC为缨帽变换三分量;Texture为TM图像主成分变换生成的第一主成分衍生出的8个纹理特征值,即均值(mean)、方差(var)、协同性(homog)、对比度(contr)、非相似度(diss)、熵(entropy)、角二阶矩(sec_mom)和相关度(correl) |
Tab.4 Evaluation of the accuracy before and after the simplification on attributes表4 属性精简前后精度评价 |
| 实验 | b1-6_med | MNF1-4_med | su_b7 | NDVI_max | Texture | MAE(%) | RMSE(%) |
|---|---|---|---|---|---|---|---|
| 1 | √ | √ | √ | √ | 8.84 | 12.86 | |
| 2 | √ | √ | √ | √ | 8.94 | 13.09 |
注:“√”表示被选择 |
Tab.5 Importance analysis of the attribute variables表5 属性变量重要性分析 |
| 属性变量 | MNF2_med | NDVI_max | MNF1_med | SU_TM6 | var | MNF3_med | mean |
|---|---|---|---|---|---|---|---|
| 重要度 | 79 | 64 | 59 | 55.5 | 47.5 | 47 | 46 |
| 属性变量 | MNF4_med | diss | contr | homog | correl | sec_mom | entropy |
| 重要度 | 38 | 30 | 28.5 | 19 | 6.5 | 1 | 0 |
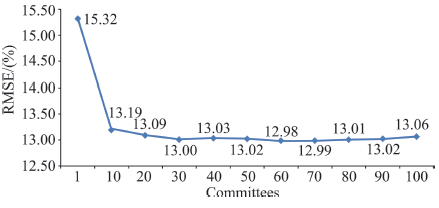
Fig.5 The diagram showing the relationship between committees and RMSE图5 参数Committees与RMSE关系图 |
Tab.6 Overall and hierarchy evaluation of the accuracy of Optimal Cubist-ISP model表6 Optimal Cubist-ISP模型整体与分密度精度评价 |
| 评价指标 | 整体 | 高密度 | 中密度 | 低密度 | 透水面 |
|---|---|---|---|---|---|
| MBE/(%) | -0.38 | -5.76 | 1.84 | 6.42 | 5.91 |
| MAE/(%) | 8.88 | 7.46 | 13.24 | 14.83 | 6.31 |
| RMSE/(%) | 12.98 | 11.14 | 16.46 | 18.85 | 10.43 |
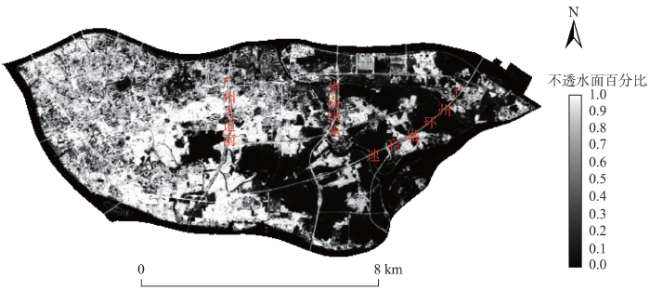
Fig.6 Result of the ISP estimation over Haizhu district图6 海珠区ISP估算结果 |
Fig.7 Scatter plots between the estimated and reference ISP图7 ISP估算值与参考值散点图 |
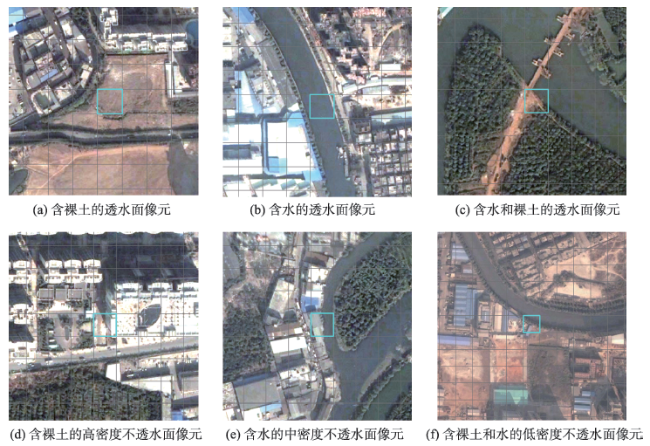
Fig.8 Google Earth image of special pixels图8 特殊像元点Google Earth影像图 |
Tab.7 The comparison of overall and hierarchy evaluation accuracy before and after the model optimization表7 模型优化前后整体与分密度评估精度对比 |
| MAE/(%) | RMSE/(%) | |||||
|---|---|---|---|---|---|---|
| 整体 | 高密度 | 中密度 | 低密度 | 透水面 | ||
| Base Cubist-ISP | 12.51 | 18.01 | 15.88 | 21.86 | 21.77 | 17.49 |
| Optimal Cubist-ISP | 8.88 | 12.98 | 11.14 | 16.46 | 18.85 | 10.43 |
Tab.8 The comparison of the ISP estimations of special pixels before and after the model optimization表8 模型优化前后特殊像元点ISP估算值对比 |
| 像元点 | ISP参考值/(%) | Base Cubist-ISP模型估算值/(%) | Optimal Cubist-ISP模型估算值/(%) |
|---|---|---|---|
| A | 0.00 | 43.70 | 4.15 |
| B | 4.08 | 55.49 | 14.00 |
| C | 0.00 | 35.04 | 5.94 |
| D | 75.28 | 92.69 | 75.41 |
| E | 51.84 | 88.43 | 46.61 |
| F | 26.16 | 71.34 | 12.00 |
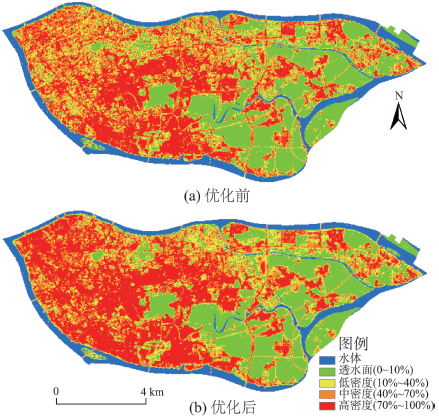
Fig.9 The classification map of the ISP estimation for Haizhu district before and after the model optimization图9 模型优化前后海珠区ISP估算结果分级图 |
The authors have declared that no competing interests exist.
| [1] |
|
| [2] |
|
| [3] |
|
| [4] |
|
| [5] |
|
| [6] |
|
| [7] |
|
| [8] |
|
| [9] |
|
| [10] |
|
| [11] |
[
|
| [12] |
[
|
| [13] |
|
| [14] |
[
|
| [15] |
|
| [16] |
|
| [17] |
|
| [18] |
|
| [19] |
USGS. Landsat higher level science data products[ER/OL]. .
|
| [20] |
|
| [21] |
|
| [22] |
|
| [23] |
|
| [24] |
|
| [25] |
|
| [26] |
|
| [27] |
|
| [28] |
|
| [29] |
[
|
/
| 〈 |
|
〉 |