
Journal of Geo-information Science >
Spatial-Temporal Ground Deformation Study of Suzhou Area from 2007 to 2010Based on the SBAS InSAR Method
Received date: 2015-10-07
Request revised date: 2016-02-18
Online published: 2016-10-25
Copyright
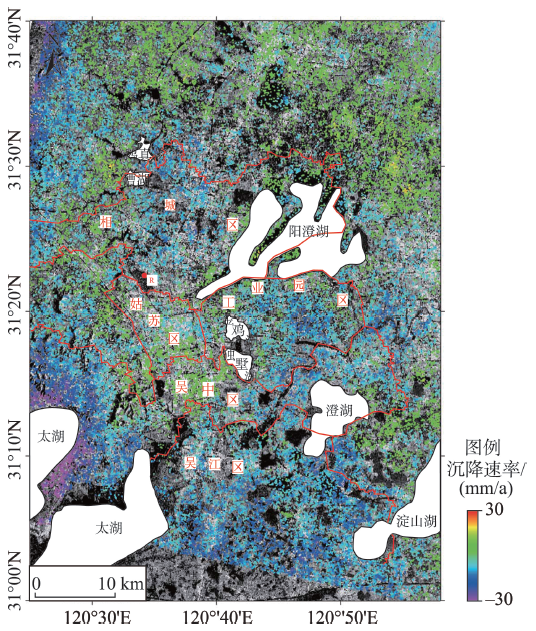
The city of Suzhou is located in the well known Suzhou-Wuxi-Changzhou subsidence zone in China, which suffers from serious land subsidence. Land subsidence occurring in this area can cause conspicuous social and economic lost, thus a proper investigation is necessary for this region. In order to understand the spatial-temporal evolution of land subsidence in Suzhou, we applied the Small Baseline Subset (SBAS) Interferometric Synthetic Aperture Radar (InSAR) technique to 27 C-band ERS-2 SAR images acquired between 2007 and 2010 by European Space Agency (ESA). The results show that during the observation period, the downtown and uptown areas show a relatively slow subsidence rate, while an exceptionally rapid subsidence is detected in 3 suburb areas. The downtown area such as Gusu district and the uptown area such as Wuzhong district are characterized by their generally low subsidence rates, which are less than 10 mm/a, and there is no subsidence center detected. Land subsidence mainly occurs in Xiangcheng district, Wujiang district and the industrial park, which are the newly developed zones characterized by the subsidence rates of greater than 10 mm/a. We observe the prevalence of ground subsidence phenomena ranging from 10 mm/a up to 20 mm/a in Xiangcheng district, while in certain towns and streets, the subsidence phenomenon is significantly severe with a rate close to 20 mm/a or higher. The maximum accumulative subsidence in the industrial park reaches 50 mm, and the average subsidence rate of this area is approximately 20 mm/a. Rapid subsidence with an average rate being up to 20 mm/a is observed in Wujiang district, which is located in the southern part of Suzhou. The land subsidence in this area is the severest within the whole research area, featured by its large coverage and high subsidence rate, and the maximum accumulative subsidence displacement can reach 60 mm or more.
Key words: land subsidence; Suzhou; SBAS; spatial-temporal evolution; subsidence rate
ZHU Meng , DONG Shaochun , YIN Hongwei , HUANG Lulu . Spatial-Temporal Ground Deformation Study of Suzhou Area from 2007 to 2010Based on the SBAS InSAR Method[J]. Journal of Geo-information Science, 2016 , 18(10) : 1418 -1427 . DOI: 10.3724/SP.J.1047.2016.01418
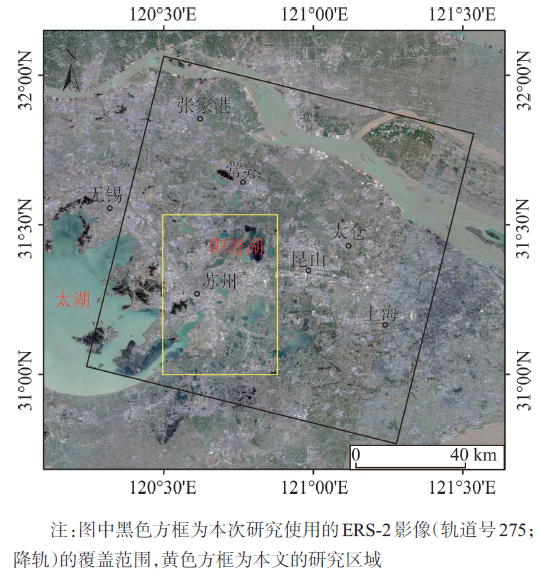
Fig. 1 Landsat-8 true color composite image ofSuzhou and its surroundings图1 苏州及其周边地区Landsat-8 真彩色合成影像图 |
Tab. 1 List of ERS-2 data parameters表1 ERS-2数据参数表 |
| 传感器 | 轨道号 | 极化方式 | 入射角 | 顶角 | 升降轨 | 时间跨度 | N | M |
|---|---|---|---|---|---|---|---|---|
| ERS-2 | 275 | VV | 23.2° | -166.2° | 降轨 | 2007-10-14-2010-10-03 | 27 | 43 |
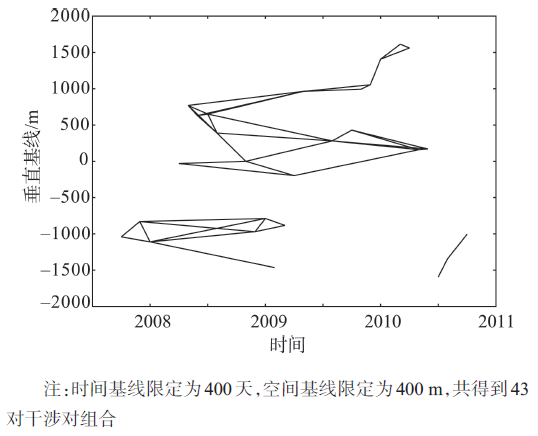
注:N表示SLC影像数量;M表示干涉像对的数量 |
Fig. 2 Distribution of spatial and temporal baselines图2 时空基线配对图 |
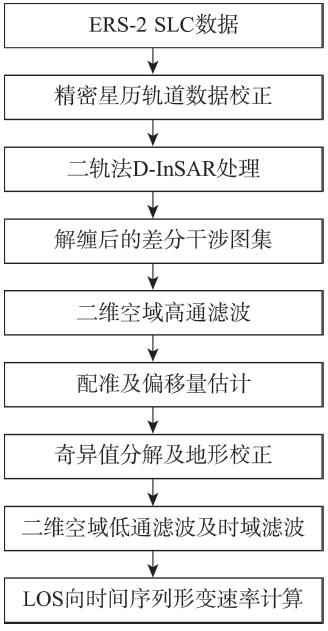
Fig. 3 Data processing flowchart图3 数据处理流程图 |
Fig. 4 Line-of-sight average deformation rate map ofSuzhou between 2007 and 2010图4 苏州地区LOS向2007-2010年平均沉降速率图 |
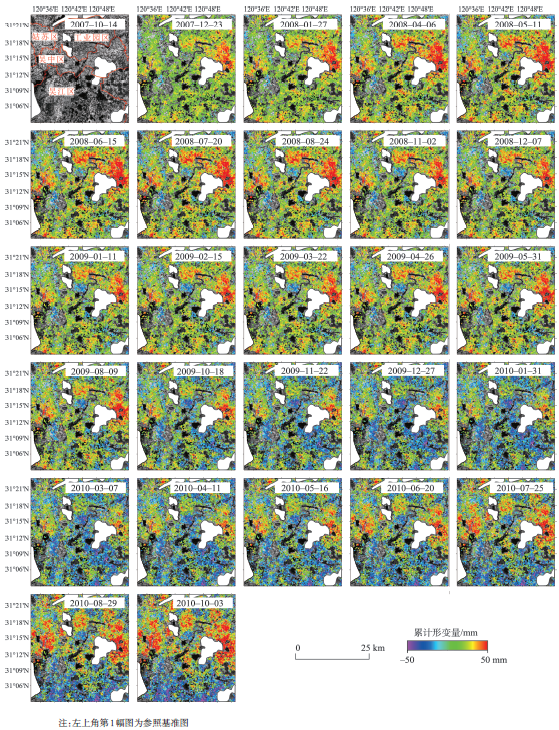
Fig. 5 Time series of the accumulative displacement of Suzhou from 2007 to 2010图5 2007-2010年苏州地区地表累计形变量时间序列变化图 |
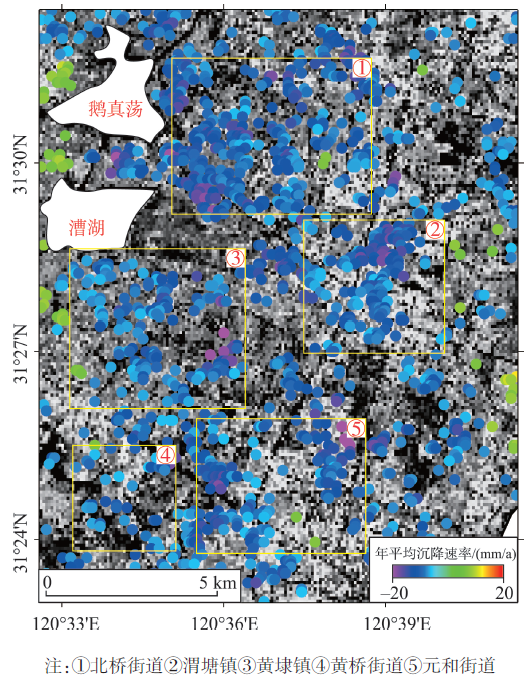
Fig. 6 Line-of-sight average deformation ratemap of Xiangcheng district图6 相城区LOS向年平均形变速率图 |
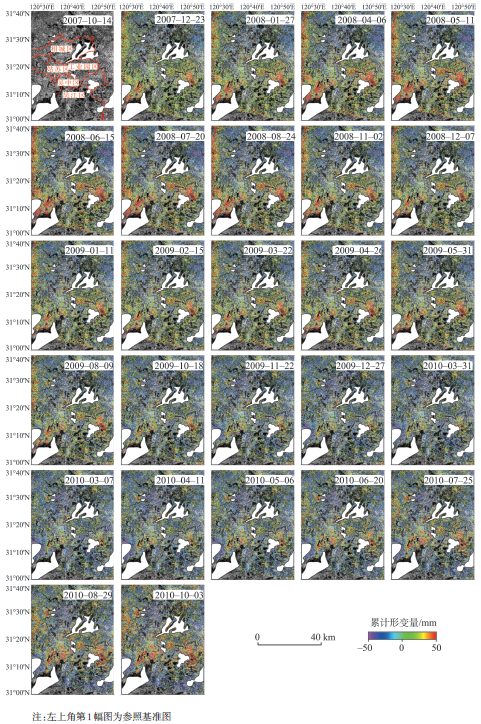
Fig. 7 Time series of the accumulative displacement of Xiangcheng district from 2007 to 2010图7 2007-2010年相城区地表累计形变量时间序列变化图 |
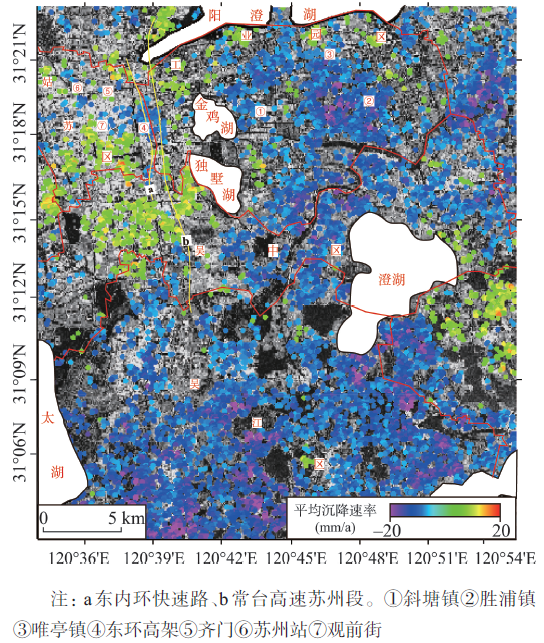
Fig. 8 Line-of-sight average deformation rate map of Gusu, Wuzhong, Wujiang district and the industrial park图8 姑苏、吴中、吴江区及工业园区LOS向年平均沉降速率图 |
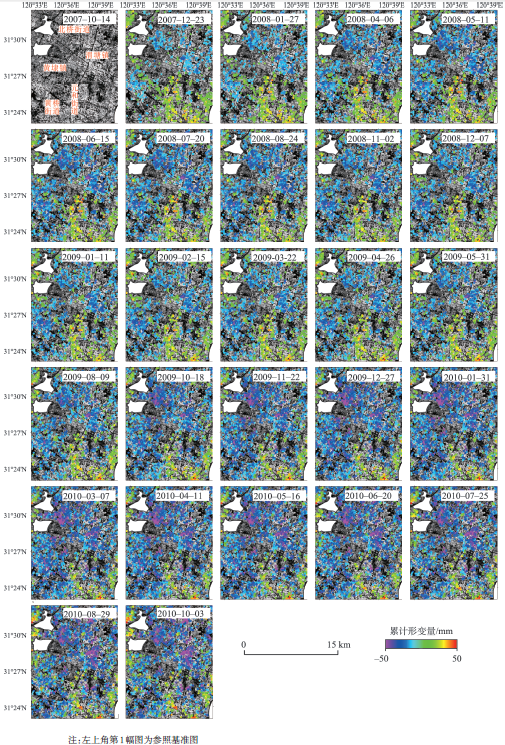
Fig. 9 Time series of the accumulation displacement of Gusu, Wuzhong, Wujiang district and the industrial park图9 2007-2010年姑苏、吴江、吴中区及工业园区地表累计形变量时间序列变化图 |
The authors have declared that no competing interests exist.
| [1] |
[
|
| [2] |
[
|
| [3] |
[
|
| [4] |
[
|
| [5] |
|
| [6] |
|
| [7] |
[
|
| [8] |
|
| [9] |
|
| [10] |
|
| [11] |
|
| [12] |
[
|
| [13] |
[
|
| [14] |
[
|
| [15] |
[
|
| [16] |
|
| [17] |
|
| [18] |
[
|
| [19] |
[
|
| [20] |
[
|
| [21] |
|
| [22] |
|
| [23] |
|
| [24] |
|
/
| 〈 |
|
〉 |