
Journal of Geo-information Science >
Port Sensing Computation Based on Maritime Big Data
Received date: 2016-07-28
Request revised date: 2016-09-22
Online published: 2016-11-20
Copyright
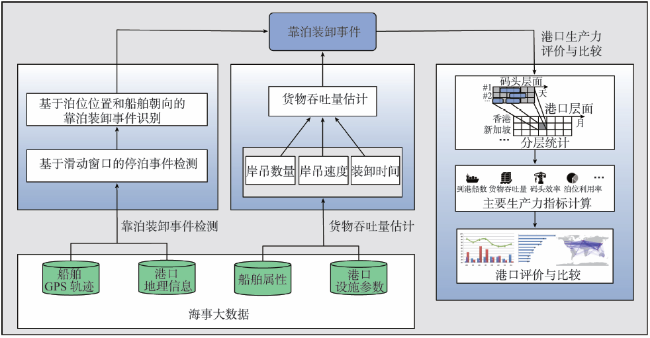
With the wide applications of information and communication technologies in port infrastructures and operations, huge volumes of maritime sensing data have been generated. These data come from various sources and demonstrate heterogeneous structures, providing us with new opportunities to understand port performance and regional economic development. In this paper, we introduce the recent work on port sensing and computation based on maritime big data. Specifically, by making use of ship GPS trajectories, ship attributes, port geographic information and port facility parameters, we can automatically estimate a set of metrics for the measurement and comparison of port performance. First, we can use ship GPS trajectories and port geographic information to detect the events of ships arriving at different ports and terminals. Second, we can use ship attributes and port facility parameters to estimate the cargo throughput of each arrived ship. Third, we can aggregate the ship arriving events and the cargo throughput in different terminals and ports to derive a set of port performance metrics, including ship traffic, port throughput, terminal productivity and facility utilization rate. Evaluation results using real-world maritime data collected in 2011. Results showed that these methods accurately estimated the port performance metrics. We also presented a case study in port of Hong Kong to showcase the effectiveness of our framework in port performance analysis.
Key words: maritime big data; port; urban sensing; urban computing; data mining
CHEN Longbiao , ZHANG Daqing , LI Shijian , PAN Gang . Port Sensing Computation Based on Maritime Big Data[J]. Journal of Geo-information Science, 2016 , 18(11) : 1485 -1493 . DOI: 10.3724/SP.J.1047.2016.01485
Fig. 1 Port sensing and computing framework based on maritime big data图1 基于海事大数据的港口感知计算框架 |
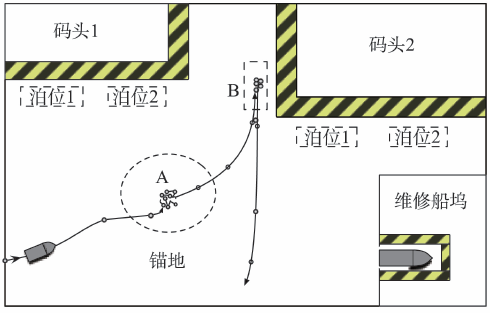
Fig. 2 Ship trajectories in a port图2 船舶在港口中的运动轨迹 |
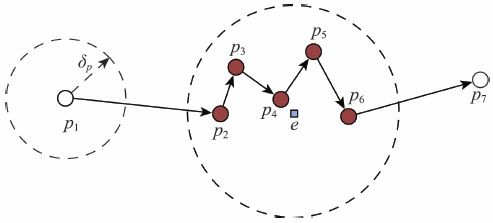
Fig. 3 Sliding window-based stop event detection图3 基于滑动窗口的停泊事件检测 |
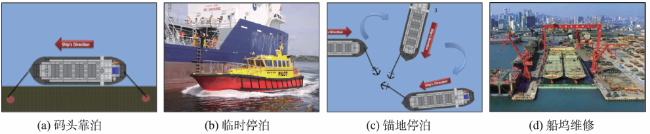
Fig. 4 Stop events types of a ship in a port图4 船舶在港口中的停泊事件类型 |
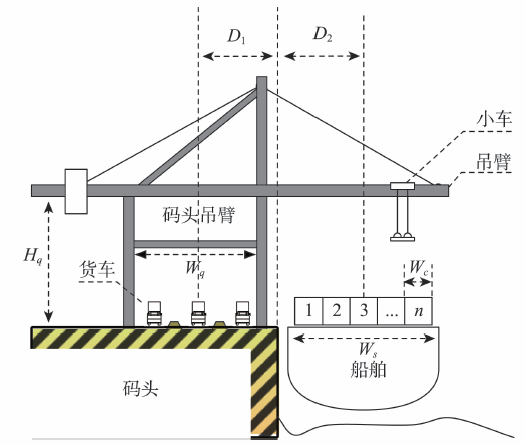
Fig. 5 Illustration of container transshipment at terminal图5 集装箱船舶在码头装卸示意图 |
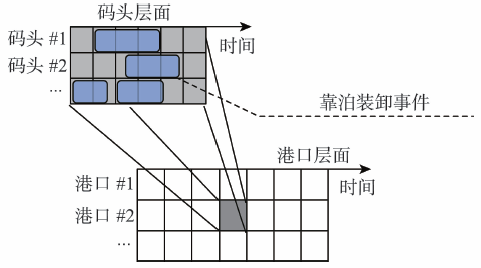
Fig. 6 Illustration of berthing event aggregation interminal and port levels图6 码头层面和港口层面的靠泊装卸事件统计示意图 |
Tab.1 Precision and recall of berthing event detection under different feature combinations表1 不同特征组合条件下靠泊事件检测的精确率和召回率 |
| 特征 | 精确率/(%) | 召回率/(%) |
|---|---|---|
| 距离 | 0.671 | 0.721 |
| 距离 +方向 | 0.831 | 0.928 |
| 距离 +方向 +时间 | 0.906 | 0.942 |
Tab. 2 Results of berthing event detection inHong Kong and Singapore in 2011表2 2011年度香港和新加坡集装箱船舶到港船数检测结果 |
| 港口 | 检测值 | 公布值 | 误差/(%) |
|---|---|---|---|
| 香港 | 13 211 | 13 347 | 1.02 |
| 新加坡 | 18 973 | 19 290 | 1.64 |
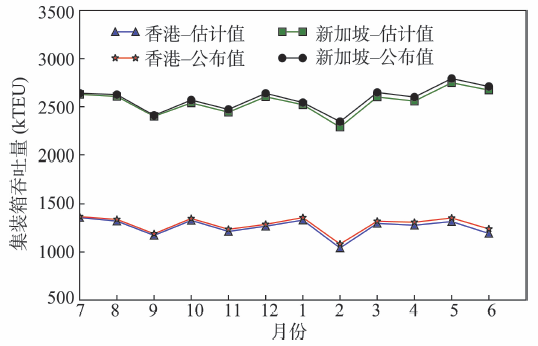
Fig. 7 Results of container throughput estimation inboth ports from 2011/07 to 2012/06图7 2011年7月至2012年6月期间2个港口的集装箱吞吐量估计结果 |
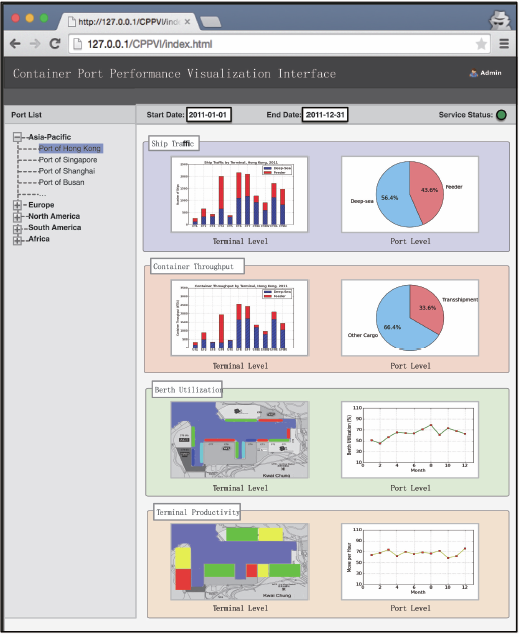
Fig. 8 The interface of the port performancemeasurement and comparison framework图8 港口生产力指标评价与比较框架的界面 |
Tab.3 Top 10 container ports (ranked bythroughput in 2011)表3 全球前 10 集装箱港口排名(按2011年度吞吐量排序) |
| 排名 | 本文排名 | JOC 排名 |
|---|---|---|
| 1 | Shanghai | Shanghai |
| 2 | Singapore | Singapore |
| 3 | Shenzhen | Hong Kong |
| 4 | Busan | Shenzhen |
| 5 | Hong Kong | Busan |
| 6 | Ningbo-Zhoushan | Ningbo-Zhoushan |
| 7 | Guangzhou | Guangzhou |
| 8 | Dubai | Qingdao |
| 9 | Qingdao | Dubai |
| 10 | Rotterdam | Rotterdam |
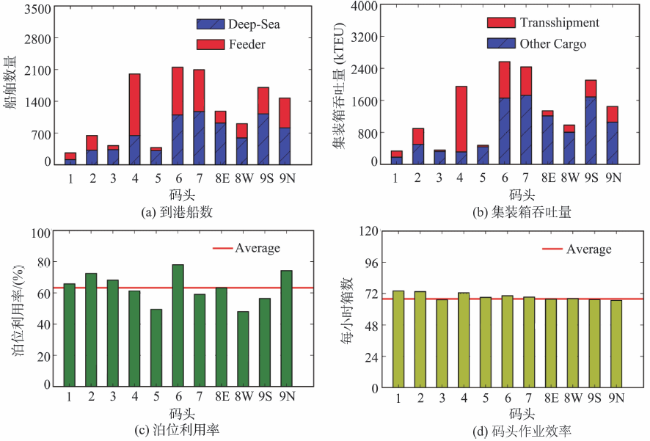
Fig. 9 The terminal performance of Hong Kong in 2011图9 香港各个集装箱码头2011年的生产力指标 |
The authors have declared that no competing interests exist.
| [1] |
|
| [2] |
UNCTAD. Port marketing and the challenge of the third generation port[R]. New York:UNCTAD,1994:9-12.
|
| [3] |
|
| [4] |
|
| [5] |
|
| [6] |
Maritime and
|
| [7] |
|
| [8] |
|
| [9] |
|
| [10] |
|
| [11] |
[
|
| [12] |
|
| [13] |
|
| [14] |
|
| [15] |
|
| [16] |
|
| [17] |
|
| [18] |
|
| [19] |
|
| [20] |
|
| [21] |
|
| [22] |
|
| [23] |
|
| [24] |
|
| [25] |
|
/
| 〈 |
|
〉 |