
Journal of Geo-information Science >
Burned Area Detection in the Ecosystem Transition Zone Using MODIS Data
Received date: 2015-12-16
Request revised date: 2016-03-04
Online published: 2016-11-20
Copyright
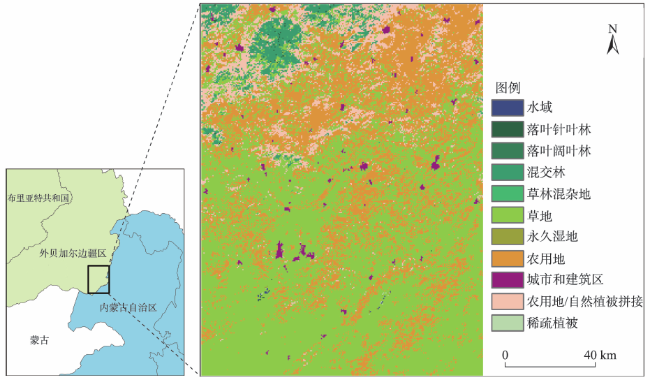
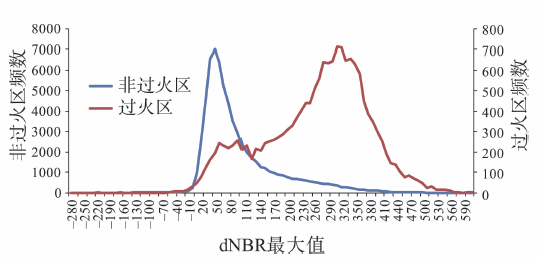
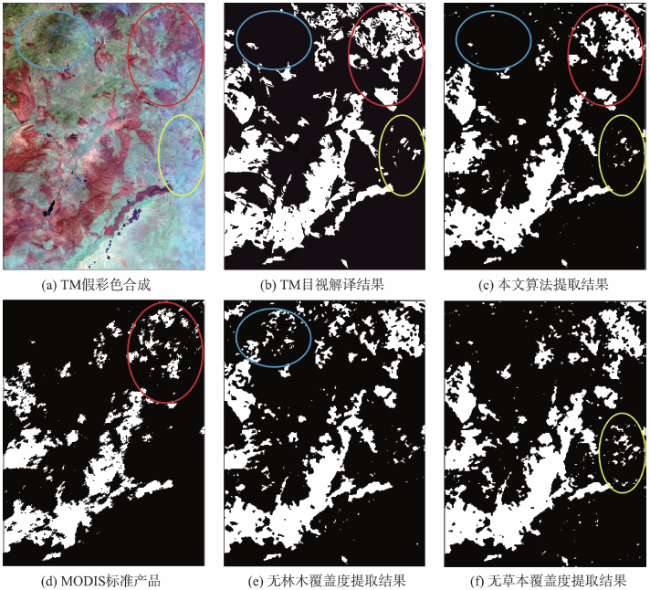
Fires belong to one of the main disturbance factors and play an important role in various ecosystems. Burned area detection not only indicates the impact of fires on ecosystems, but also provides a scientific support for the global carbon cycle studies. Traditional burned scar area detection approach mainly depends on ground survey and measurements, which still has several defects, such as the heavy workload, high cost, low efficiency, and poor timeliness etc. By applying remote sensing technology to map the burned area can produce burn scar information with greater spatial and temporal scale and effectively avoid the above-mentioned problems. Currently, many methods aiming to map the burned area on remote sensing images have been developed, and various global burned area products which provide the consistent assessments of fire activity at the global scale are also available; however, the efficiency of their performances differs within various ecosystems. In this study, we developed an algorithm to map the burned scar area in an ecosystem transition zone by using the Moderate Resolution Imaging Spectroradiometer (MODIS) data. This algorithm was developed based on the Normalized Burned Ratio differencing (dNBR) and the vegetation coverage data. The NBR index was originally developed specifically for mapping burned areas, and recently it has been used in the assessment of burning severity. Firstly, we used the near red and shortwave infrared bands of MODIS Surface Reflectance products (MOD09A1) to calculate the NBR values. Then, the differenced NBR (dNBR) calculated from the NBR values for a composite period with the previous 8-day range was calculated. The frequency distribution of dNBR maximum value in the burned scar area and the unburned region was analyzed. Since the change of NBR values in regions with different vegetation coverage was different, the tree cover and herbaceous cover data provided by the MODIS Vegetation Continuous Fields product (MOD44B) were also used for setting up rules to extract the burned scar area. A case study was carried out in an ecosystem transition zone within the southeast Siberia, where forest, grassland, farmland and other different ecosystems coexist. Comparison of the burned area detected by this algorithm with the adoption of high resolution burned scar information from Landsat ETM+ imagery shows a high accuracy. And the result obtained using this algorithm was better than the one using the MODIS Combined Burned Area product (MCD45A1), with the kappa coefficient increased from 0.70 to 0.75. To make a better comparison, we set up rules with the same threshold values of dNBR to extract the burned scar area, but without the usage of tree cover or herbaceous cover data. We found that the use of tree cover data as well as the herbaceous cover data can reduce mistakes during the process and improve the accuracy of burned area extraction, with the kappa coefficient increased from 0.69 and 0.73 respectively to 0.75.
Key words: burned area; MODIS; NBR; vegetation coverage; difference method
XIAO Xiao , FENG Xianfeng , SUN Qingling . Burned Area Detection in the Ecosystem Transition Zone Using MODIS Data[J]. Journal of Geo-information Science, 2016 , 18(11) : 1529 -1536 . DOI: 10.3724/SP.J.1047.2016.01529
Fig. 1 The location and land cover map of the study area图1 研究区位置及土地覆被图 |
Tab. 1 MOD09A1 surface reflectance QA data set bits表1 MOD09A1质量评价数据取值 |
| 位数 | 参数名称 | 可取值 | 含义 |
|---|---|---|---|
| 2 | 云阴影(Cloud shadow) | 0 | 无(No) |
| 3-5 | 陆地/水(Land/water flag) | 001 | 陆地(Land) |
| 6-7 | 气溶胶(Aerosol quality) | 01 | 少(Low) |
| 10 | 平均(Average) | ||
| 8-9 | 卷云(Cirrus detected) | 00 | 无(No) |
| 01 | 少(Low) | ||
| 10 | 平均(Average) | ||
| 10 | 内部云算法(Internal cloud algorithm flag) | 0 | 无云(No cloud) |
| 12 | MOD35 雪/冰(snow/ice flag) | 0 | 无(No) |
| 15 | 内部雪掩膜(Internal snow mask) | 0 | 无雪(No snow) |
Tab. 2 The pixel number and proportion of the burned scar area in different land cover types表2 不同土地覆盖类型的火烧迹地像元个数及所占比例 |
| 土地覆被类型 | 像元个数 | 所占比例/(%) |
|---|---|---|
| 水域 | 0 | 0 |
| 落叶针叶林 | 0 | 0 |
| 落叶阔叶林 | 0 | 0 |
| 混交林 | 91 | 0.56 |
| 草林混杂地 | 42 | 0.26 |
| 草地 | 7447 | 45.93 |
| 永久湿地 | 0 | 0 |
| 农用地 | 7158 | 44.15 |
| 城市和建设区 | 32 | 0.20 |
| 农用地/自然植被拼接地 | 1444 | 8.91 |
| 稀疏植被 | 0 | 0 |
Fig. 2 Frequency distribution of the maximum dNBRvalue in the burned scar area and unburned region图2 火烧迹地和非火烧迹地dNBR最大值的频数统计 |
Fig. 3 Comparison of the extracted burned scar results from different data sources for the study area图3 研究区的火烧迹地提取结果对比 |
The authors have declared that no competing interests exist.
| [1] |
|
| [2] |
[
|
| [3] |
|
| [4] |
|
| [5] |
[
|
| [6] |
[
|
| [7] |
[
|
| [8] |
|
| [9] |
|
| [10] |
|
| [11] |
|
| [12] |
|
| [13] |
|
| [14] |
[
|
| [15] |
|
| [16] |
|
| [17] |
|
| [18] |
|
| [19] |
|
| [20] |
|
| [21] |
[
|
| [22] |
|
| [23] |
|
| [24] |
|
/
| 〈 |
|
〉 |