
Journal of Geo-information Science >
Analysis of Expressway′s Impact on Vegetation in Its Spatial and Temporal Variation Based on Remote Sensing Monitoring
Received date: 2015-10-19
Request revised date: 2015-12-25
Online published: 2016-11-20
Copyright
Vegetation dynamics and their coupled relations with ecology are current research hot spots in exploring how the terrestrial ecosystems respond to the climate systems. We have obtained the vegetation leaf area index on both sides for the expressway in the research area, based on the simulations which use the PROSAIL and TM images as the information source. We studied the dynamic changes of road vegetation growth status with LAI from aspects of time and space. The results are shown as follows. (1) The temporal change of vegetation growth pattern in the expressway region shows that: the temporal growth condition of the roadside vegetation is influenced heavily in the first 5-year period after a new expressway has opened. (2) The spatial change of vegetation growth pattern in the expressway region shows that: the spatial growth condition of the roadside vegetation is heavily impacted within the regions that are closer to the expressway, while the vegetation located far from the expressway is mildly affected. Generally, this research provides reliable basic data for guiding the vegetation restoration and protection.
Key words: Leaf Area Index (LAI); PROSAIL model; road vegetation; remote sensing
GUO Yunkai , GOU Yepei . Analysis of Expressway′s Impact on Vegetation in Its Spatial and Temporal Variation Based on Remote Sensing Monitoring[J]. Journal of Geo-information Science, 2016 , 18(11) : 1537 -1543 . DOI: 10.3724/SP.J.1047.2016.01537
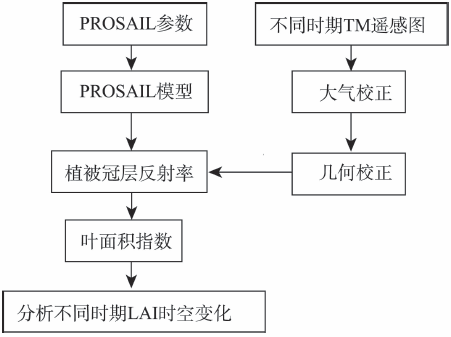
Fig. 1 Technical route图1 技术路线 |
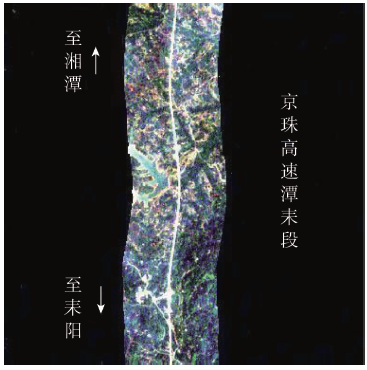
Fig. 2 Research area图2 研究区 |
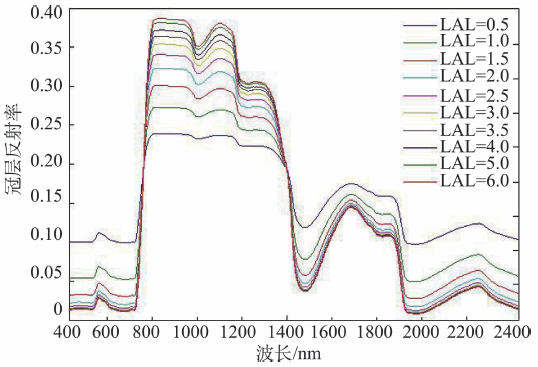
Fig. 3 Simulated canopy reflectances under different LAIs图3 不同LAI下模拟的冠层反射率 |
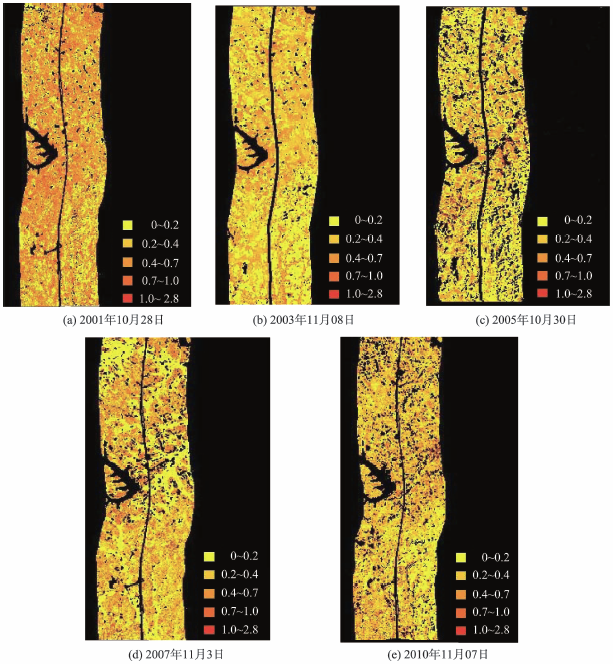
Fig. 4 Pictures of LAI distribution in different years图4 不同年份叶面积指数分级图 |
Fig. 5 The inversion LAI and the measured LAI图5 反演的LAI与实测LAI |
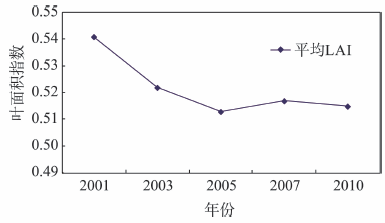
Fig. 6 Changes of the average LAI onboth sides of the highway图6 高速公路两侧植被平均LAI变化情况 |
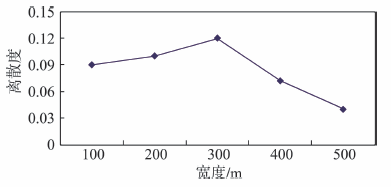
Fig. 7 Dispersion of LAI in different regions图7 不同区域内LAI的离散度 |
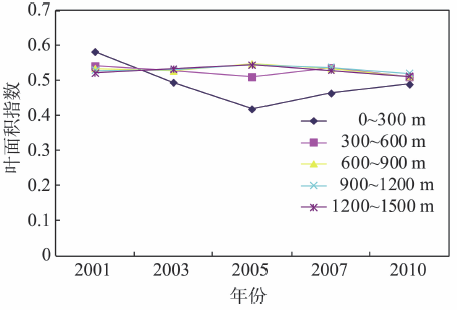
Fig. 8 Changes of the average LAI indifferent regions of road图8 道路两侧不同区域平均LAI变化情况 |
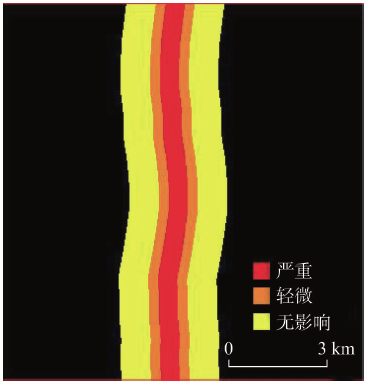
Fig. 9 Impact of highway on the vegetation from both sides图9 高速公路对两侧植被影响情况 |
The authors have declared that no competing interests exist.
| [1] |
|
| [2] |
[
|
| [3] |
[
|
| [4] |
[
|
| [5] |
[
|
| [6] |
[
|
| [7] |
[
|
| [8] |
[
|
| [9] |
[
|
| [10] |
|
| [11] |
[
|
| [12] |
|
| [13] |
|
| [14] |
|
| [16] |
|
| [17] |
[
|
| [18] |
[
|
| [19] |
[
|
/
| 〈 |
|
〉 |
