Orginal Article

Accuracy Assessment and Comparative Analysis of GlobeLand30 Dataset in Henan Province

  • MA Jingzhen , * ,
  • SUN Qun ,
  • XIAO Qiang ,
  • WEN Bowei
Expand
  • Information Engineering University, Zhengzhou 450001, China
*Corresponding author: MA Jingzhen, E-mail:

Received date: 2016-06-01

  Request revised date: 2016-07-08

  Online published: 2016-11-20

Copyright

《地球信息科学学报》编辑部 所有

Abstract

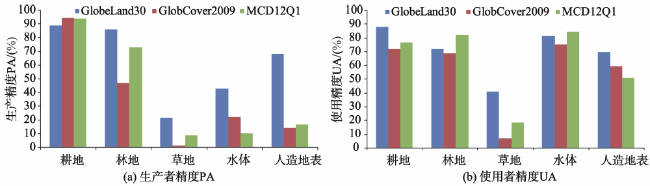
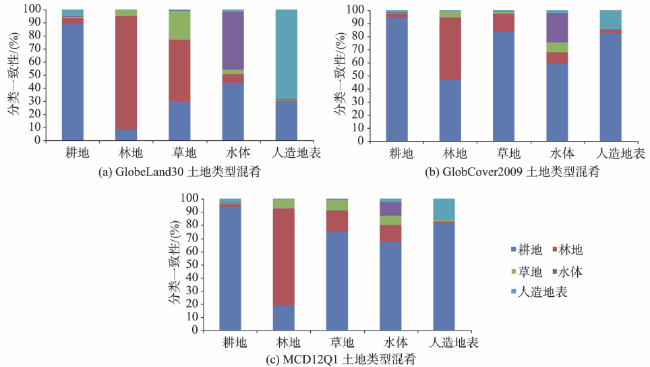
Global land cover data plays an important role in climate change research, geographical conditions monitoring and ecological environment protection. It' s of great significance to produce and evaluate the global land cover data at a specific spatial scale. In 2014, the National Geomatics Center of China (NGCC) produced GlobeLand30 of the remote sensing mapping product with the world’s highest 30 m resolution. In this paper, the 1:100 000 land use data of Henan Province was used as the reference data to validate global land cover data of GlobeLand30, GlobCover2001 and MCD12Q1. The accuracy assessment and comparative analysis of these data were conducted with three methods, including spatial statistics, area relevance and consistency, and confusion matrix. The results show that the three land cover products have a good consistency for description of land forms with the reference data, and the area relevance is higher than 0.9. Cropland and forestland are the main land cover types, followed by grassland, water body and artificial surface, but the classified land has different area in these products. By evaluating accuracy of the three land cover products, the overall accuracy and Kappa coefficient of GlobeLand30 are the highest, followed by MCD12Q1 and those of GlobCover2009 are the lowest. In terms of specific land type, although cropland and forestland have high precision in these products, the accuracy of grassland classification is poor. The producer accuracy of water body and artificial surface in GlobeLand30 is much higher than the other two products, but the difference of the user accuracy is small. The three land cover products show the spatial confusion especially in forestland, grassland and cropland with the reference data. The confusion degree of GlobeLand30 is lower than the other two kinds of data. This paper illustrates that GlobeLand30 has higher accuracy than other products and it will play a more and more important role in many fields. Not only can the methods and conclusions in this paper pave the way for further research in other areas, but also they can have great significance on promoting the application and value of GlobeLand30. Moreover, because of the spatial resolution of GlobeLand30 is much higher than other land cover products, the use of GlobeLand30 for further application and research is the focus in the next step. In addition, there are a lot of remote sensing images, vector data, and other multi-source data and how to improve the quality of the global land cover data is one of the problems that should be considered.

Cite this article

MA Jingzhen , SUN Qun , XIAO Qiang , WEN Bowei . Accuracy Assessment and Comparative Analysis of GlobeLand30 Dataset in Henan Province[J]. Journal of Geo-information Science, 2016 , 18(11) : 1563 -1572 . DOI: 10.3724/SP.J.1047.2016.01563

1 引言

地表覆盖是指地球表面各种类型及其自然属性与特征的综合体,科学准确地测定其空间分布及动态变化,对研究全球的气候变化、能量循环、生态环境以及可持续发展等具有十分重要的意义[1-3]。随着卫星遥感技术以及制图技术的快速发展,经过国际社会的共同努力,目前全球的地表覆盖数据主要包括[4-7]:① 美国马里兰大学生产的UMD产品;② 美国地质调查局生产的IGBP-DISCover产品; ③ 美国波士顿大学生产的MODIS产品;④ 欧盟联合中心生产的GLC2000产品;⑤ 欧洲空间局生产的GlobCover产品。2014年国家基础地理信息中心推出了全球首套最高30 m分辨率的地表覆盖遥感制图数据产品GlobeLand30,该数据包含2000年和2010年2期产品,目前中国政府已向联合国捐赠并开放共享了该套数据产品[8-11]
开展地表覆盖数据的精度评价研究,是正确合理使用这些数据的前提和保障,对推动地表覆盖数据的广泛应用,和提高决策的科学性具有重要的意义。由于各地表覆盖数据的数据源、分类体系和分类方法不同,导致各数据的差异很大,开展地表覆盖数据的对比分析研究,能够发现不同数据间的差异,对数据生产者和使用者都很有必要,数据生产者可以选择更好的方法以制作出更高质量的数据产品,数据使用者可以了解不同数据的优缺点,选择更高质量的数据以满足应用需求。
目前,国内外学者主要对中低分辨率的地表覆盖数据进行了研究,Herold等[12]采用独立验证样本评价了4种1 km分辨率地表覆盖数据的精度,并分析了不同土地类型交错分布对数据精度的影响;Giri等采用空间一致性方法对MODIS和GLC2000进行了对比分析,指出2种数据的不同土地类型存在大小不同的差异[13];Pérez-Hoyos等采用误差矩阵和模糊数据集两种方法对欧洲地区的4种地表覆盖数据进行了精度验证[14];吴文斌等以中国耕地为研究对象,对4类地表覆盖数据进行了精度评价,得出MODIS和GLC2000数据的精度要高于UMD和IGBP-DIScover数据[15];宋宏利等以CHINA2000为参考,采用类型面积相关和误差矩阵对中国地区4种低分辨率的全球土地覆被产品进行了精度评价,并分析了误差与空间分布[16];宁佳等对黑龙江流域的MODIS和GlobCover数据进行了对比分析,并研究了2种数据集数量和空间分布上的差异[17]
由于GlobeLand30的时间较短,当前针对该高分辨率地表覆盖数据的研究较少,部分国外学者对欧洲地区该数据的精度进行了评价[18-20],部分国内学者利用该数据做了一些应用分析研究[21-22],但国内还没有开展相关的精度评价和对比研究。本文以2010年中国土地利用数据为参考,采用空间统计、面积一致性和误差矩阵3种分析方法,对河南省地区的GlobeLand30-2010以及与其时相相近的GlobCover2009和MCD12Q1-2010进行精度评价和对比分析,以期为地表覆盖数据的广泛应用提供有效支持和科学依据。

2 研究区及数据

2.1 研究区域概况

河南省(图1)位于中国中东部、黄河中下游(31°23′~36°22′N,110°21′~116°39′E),东接安徽省、山东省,北接河北省、山西省,西接陕西省,南临湖北省,总面积16.7万km2。河南省呈西高东低地势,北、西、南三面千里太行山脉、伏牛山脉、桐柏山脉、大别山脉沿省界呈半环形分布;中、东部为黄淮海平原;西南部为南阳盆地,跨越海河、黄河、淮河、长江四大水系,山水相连;平原和盆地、山地、丘陵分别占55.7%、26.6%、17.7%,属暖温带-亚热带、湿润-半湿润季风气候。
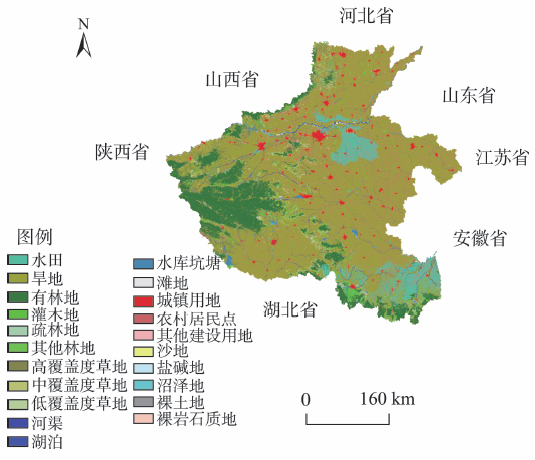
Fig. 1 The land use map of Henan Province in 2010

图1 河南省2010年土地利用分布图

2.2 数据来源

2.2.1 待评价数据
本文要评价的地表覆盖数据包括GlobeLand30、GlobCover和MCD12Q1,这3种数据的特点如表1所示。GlobeLand30是由中国国家基础地理信息中心牵头研制的全球地表覆盖遥感制图产品,该数据覆盖南北纬80°的陆地范围,包括耕地、森林等10种地表覆盖类型,其采用WGS84坐标系统和UTM投影,全球共853幅分幅产品,包含2000年和2010年2个时相的数据[23]。GlobCover是欧洲空间局通过全球合作生产的全球土地覆盖产品,采用FAO的LCCS土地覆盖分类系统,共有22个分类,分辨率为300 m,包括2005年和2009年的全球土地覆盖信息[7]。MCD12Q1是MODIS三级数据土地覆盖类型产品,采用IGBP土地覆盖分类系统,共有17个分类,分辨率为500 m,该数据每年更新一次,包括2001-2015年的全球土地覆盖信息[14]。本文以2010年为基准时相,选择GlobeLand30-2010、GlobCover2009和MCD12Q1-2010数据进行研究。
Tab. 1 The characteristics comparison of three land cover products

表1 3种地表覆盖数据的特点对比

产品名称 制作单位 卫星影像 时相/年 分类方法 分类数量 分辨率/m
GlobeLand30 国家基础地理
信息中心
Landsat TM5、ETM+、HJ-1 2000、2010 像元-对象-知识
(POK方法)
10 30
GlobCover 欧洲空间局 MERIS 2005、2009 神经网络分类 22 300
MCD12Q1 美国波士顿大学 Terra/MODIS 2001-2015 决策树分类 17 500
2.2.2 参考数据
本文采用2010年中国1:10万比例尺土地利用矢量数据作为参考数据,该数据以Landsat TM、ETM遥感影像为主要数据源,通过人工目视解译生成。该数据土地利用类型包括耕地、林地、草地等6个一级类型以及25个二级类型,是中国目前精度最高的土地利用产品,已经在国土资源调查、环境监测以及生态保护中发挥着重要的作用[24-25]

2.3 数据处理

由于地表覆盖数据和土地利用数据在数据格式、数据尺度以及坐标系等方面存在差异,因此在进行数据的精度评价和对比分析之前需要进行相应的数据处理操作,数据处理的流程如图2所示。
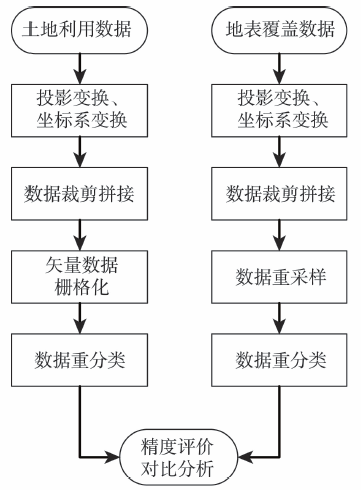
Fig.2 The flow chart of processing land cover land use data

图2 地表覆盖数据和土地利用数据处理流程图

首先,将GlobeLand30、GlobCover2009、MCD 12Q1以及土地利用数据统一到相同的坐标系和地图投影下,本文采用WGS84坐标系和Albers等面积投影;然后,根据所确定的研究区域,通过裁剪、拼接等方法获取边界一致的研究数据;接着,对矢量的参考数据进行栅格化处理,对栅格的地表覆盖数据进行重采样操作,保证数据在进行对比时保持相同的分辨率,以利于进一步评价和分析;最后,由于待评价数据和参考数据分别采用不同的分类体系和分类方法,不能直接进行数据比较,因此需要对这些数据进行重分类处理,将其统一到新的分类系统下。通过数据类别归并,最终形成耕地、林地、草地、水体、人造地表以及其他6种土地使用类型,数据的分类和对应关系如表2所示,重分类后的数据如图3所示。
Tab. 2 Land type reclassification and corresponding relation

表2 土地类型重分类和对应关系表

统一分类 2010年土地利用数据 GlobeLand30 GlobCover2009 MCD12Q1
1耕地 11水田、12旱地 10耕地 11水田、14旱地、20耕地与植被镶嵌体 12耕地
2林地 21有林地、22灌木地、23疏林地、24其他林地 20森林、
40灌木地
30自然植被与耕地镶嵌体、40常绿阔叶或半落叶阔叶林、50常绿阔叶林、60落叶阔叶林、70常绿针叶林、90常绿针叶或落叶针叶林、100针阔混交林、110林地/灌木/草地镶嵌、130灌木 1常绿针叶林、2常绿阔叶林、3落叶针叶林、4落叶阔叶林、5混交林、6稠密灌丛、7稀疏灌丛、14自然植被/耕地镶嵌体
3草地 31高覆盖度草地、32中覆盖度草地、33低覆盖度草地 30草地 120草地/森林/灌木镶嵌、140草地 8木本热带稀树草原、9热带稀树草原、10草地
4水体 41河渠、42湖泊、43水库坑塘、45滩涂、46滩地、64沼泽 50湿地、
60水体
160被水淹没的阔叶林、170永久被水淹没的阔叶林或灌木、180被水淹没的草地、210水体 0水体、11永久湿地
5人造地表 51城镇用地、52农村居民点、53其他建设用地 80人造地表 190人工地表或附属区域 13城市和建筑区
6其他 61沙地、62戈壁、63盐碱地、65裸土地、66裸岩石质地、67其他、44永久性冰川雪地 70苔原、90裸地、100冰川和
永久积雪
150稀疏植被(<15%)、200裸地、220冰川和永久积雪 15冰川和积雪、16裸地或稀疏植被
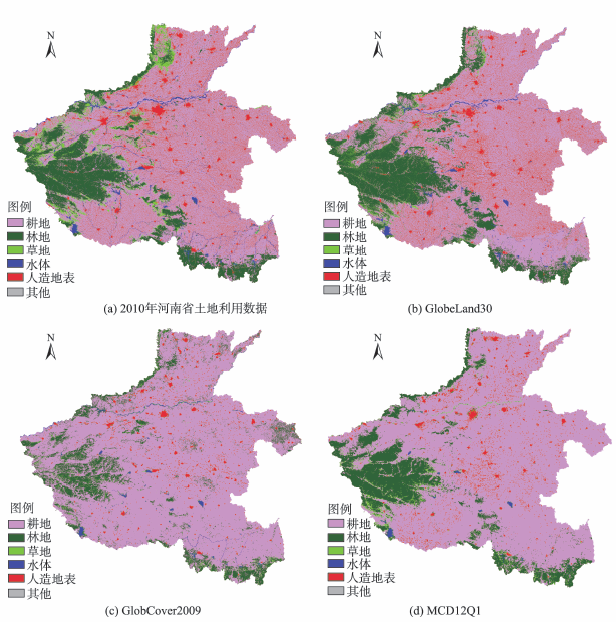
Fig. 3 Map of land cover reclassification in Henan Province

图3 河南省重分类后的土地覆盖图

3 研究方法

本文从栅格图像像元的角度出发,采用空间统计、面积一致性和误差矩阵3种分析方法,依据多种评价指标,对地表覆盖数据和参考数据进行宏观和微观对比分析,得到各数据在面积、数量以及空间位置的差异。

3.1 空间统计分析

分别统计不同数据中不同土地分类的像素数,根据像元数计算不同土地类型的覆盖面积及比例,以参考数据为基准,本文引入误差系数计算地表覆盖数据GlobeLand30、GlobCover2009、MCD12Q1与参考数据的差异。
C = K i - N i N i × 100 % (1)
式中: C 为误差系数; K i 为地表覆盖数据中第 i 类土地的面积; N i 为参考数据中第 i 类土地的面积。计算出的误差系数越小,表明待评价数据与参考数据越接近,反之,表明二者之间的误差较大。

3.2 类型面积相关分析

相关系数 R 是衡量2个随机变量之间线性相关程度的指标,相关系数的平方表示了2个变量相关的强度或大小[16]。本文通过计算GlobeLand30、GlobCover2009、MCD12Q1与土地利用数据的面积的相关系数,对数据间面积的一致性进行分析,相关系数的公式如式(2)所示。
R i = k = 1 r ( x k - x ̅ ) ( y k - y ̅ ) k = 1 r ( x k - x ̅ ) 2 k = 1 r ( y k - y ̅ ) 2 (2)
式中: R i 为相关系数; k 为重分类后的土地覆盖类型; r 为分类数量; x k 为数据集 x 中土地类型 k 的面积; y k 为数据集 y 中土地类型 k 的面积; x ̅ 为数据集 x 中全部土地面积的均值; y ̅ 为数据集 y 中全部土地面积的均值。

3.3 误差矩阵分析

误差矩阵是通过计算分类数据集与参考数据集的像元得到的比较阵列,是图像精度评价中的重要方法。由误差矩阵派生出的精度评价指标有:总体精度(Overall Accuracy,OA)、生产者精度(Produce Accuracy,PA)、使用者精度(User Accuracy,UA)和Kappa系数。其中,总体精度表示所有类型中正确分类面积的比例;生产者精度表示某一类型中正确分类的面积占待评价数据中该类型面积的比例;使用者精度表示某一类型中正确分类的面积占参考数据中该类型面积的比例;Kappa系数(K)是一个用来评价分类结果的精度和一致性的综合指标,这几种指标的计算公式如式(3)-(6)所示。
OA = i = 1 r n ii N (3)
P A i = n ii n + i (4)
U A i = n ii n i + (5)
K = N i = 1 r n ii - i = 1 r ( n i + n + i ) N 2 - i = 1 r ( n i + n + i ) (6)
式中: N 为总的像元数量; n ii 为正确分类的像元数量; n i + 为待评价数据中某一类型的像元数量; n + i 为参考数据中某一类型的像元数量; r 为分类数量。
Pontius和Millones[26]提出了2个新的评价指标用来评价待评价数据和参考数据之间的不一致性:分布不一致(Allocation Disagreement,AD)和数量不一致(Quantity Disagreement,QD)。其中,分布不一致是指待评价数据与参考数据相比,在空间分布上小于最优匹配的空间类别所占的比例;数量不一致是指与参考数据相比,没有正确分类的类型数量所占的比例,计算公式如式(7)、(8)所示。
AD = i = 1 r 2 × min n + i N - n ii N , n i + N - n ii N 2 × 100 % (7)
QD = i = 1 r n + i N - n i + N 2 × 100 % (8)
此外,总体精度、分布不一致和数量不一致存在如下关系(式(9))。
OA + AD + QD = 1 (9)

4 结果与分析

4.1 空间统计和面积一致性比较

表3是根据空间统计得到的不同土地类型的面积及误差系数,图4是不同土地类型的面积对比情况。经过统计分析可得,参考数据中河南省2010年土地利用以耕地、林地和人造地表为主,面积分别为107 202.08、27 382.47、19 390.31 km2,分别占河南省总面积的64.19%、16.40%、11.61%,草地、水体和其他土地较少,分别为8952.73、4061.01、11.41 km2,所占比例为5.36%、2.43%、0.007%。3种地表覆盖数据中,土地类型都以耕地为主,林地和人造地表次之,草地、水体和其他土地较少。其中,GlobeLand30中耕地占河南省总面积的64.96%,林地和人造地表分别占19.53%、11.33%,剩余土地占4.18%;GlobCover2009中耕地、林地和人造地表分别占83.93%、11.16%和2.84%,剩余土地占2.07%;MCD12Q1中耕地、林地和人造地表分别占78.69%、14.59%和3.83%,剩余土地占2.89%。
Tab. 3 Area statistics and error coefficient of different land types for the land use and land cover data in Henan province

表3 河南省土地利用数据和地表覆盖数据不同类型土地面积统计及误差系数

土地类型 土地利用数据 GlobeLand30 GlobCover2009 MCD12Q1
面积/km2 面积/km2 误差系数C/(%) 面积/km2 误差系数C/(%) 面积/km2 误差系数C/(%)
耕地 107 202.08 108 484.06 1.20 140 166.68 30.75 131 406.38 22.58
林地 27 382.47 32 618.58 19.12 18 636.51 31.94 24 364.52 11.02
草地 8952.73 4755.97 46.88 2162.03 75.85 4257.22 52.45
水体 4061.01 2147.33 47.12 1204.70 70.33 487.58 87.99
人造地表 19 390.31 18 917.68 2.44 4741.39 75.55 6396.34 67.01
其他 11.41 76.38 - 88.68 - 87.96 -
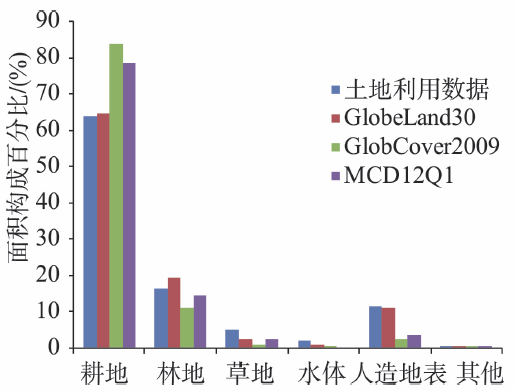
Fig. 4 Comparison of the area of different land types forland use and land cover data in Henan province

图4 河南省土地利用数据和地表覆盖数据不同类型土地面积的对比

在误差系数方面,总体来说,GlobeLand30与参考数据对比误差系数最小,MCD12Q1次之,GlobCover2009最大。其中,对于耕地,GlobeLand30与参考数据几乎相同,误差系数仅为1.2%,GlobCover2009与MCD12Q1中耕地面积均大于参考数据,分别为30.75%和22.58%;对于林地,MCD12Q1与参考数据最为接近,误差系数为11.02%,GlobeLand30林地面积大于参考数据,误差系数为19.12%,GlobCover2009林地面积小于参考数据,误差系数为31.94%;对于人造地表,GlobeLand30与参考数据几乎一致,差别仅为2.44%,其余2种数据误差较大,为70%左右;对于草地和水体,地表覆盖数据中这2类土地类型的面积均小于参考数据,误差系数在40%以上,表现出较大的差异性;其他类型的土地所占的比例很小,各数据间差别很大,下文中不再对此类型的土地进行分析。
面积相关系数可以反映出各类土地面积与参考数据的相关性程度,GlobeLand30与参考数据的面积相关性最强,相关系数为0.9846,MCD12Q1的相关系数为0.9438,GlobCover2009与参考数据的面积相关性最差,相关系数为0.9257。

4.2 基于误差矩阵的精度评估

将参考数据分别与GlobeLand30、GlobCover2009和MCD12Q1建立误差矩阵,在误差矩阵的基础上通过计算得到相关的精度评价指标,如表4所示。其中,GlobeLand30的总体精度和Kappa系数最高,分别为81.51%、0.6550,MCD12Q1次之,GlobCover2009总体精度和Kappa系数最低,分别为70.66%和0.3306。在2个不一致性精度评价指标中,GlobeLand30的分布不一致最高,为14.50%,GlobCover2009的分布不一致最低,为9.56%;而GlobeLand30的数量不一致最低,仅为3.99%,GlobCover2009的数量不一致最高,为19.78%,MCD12Q1位于二者之间。
Tab. 4 The comparison of accuracy assessment criteria of three land cover products

表4 3种地表覆盖数据的相关精度评价指标对比

地表覆盖数据 OA/(%) AD/(%) QD/(%) Kappa系数
GlobeLand30 81.51 14.50 3.99 0.6550
GlobCover2009 70.66 9.56 19.78 0.3306
MCD12Q1 75.08 10.34 14.58 0.4640
Fig. 5 Comparison of producer accuracy and user accuracy of different land types in the three land cover data

图5 3种地表覆盖数据中不同类型土地的PA和UA对比

图5是3种地表覆盖数据中不同土地类型的生产者精度和使用者精度情况,结果表明:(1)在对耕地的分类中,3种数据的生产者精度很高,均在90%以上,使用者精度在70%~90%之间;(2)在对林地的分类中,GlobeLand30和MCD12Q1的生产者精度较高,在70%以上,GlobCover2009仅为50%左右,但3种数据的使用者精度在70%以上;(3)在对草地的分类中,3种数据的生产者精度和使用者精度都很低,均低于50%,其中GlobeLand30稍高,生产者精度为21%,使用者精度为41%,其余2种数据均低于20%,GlobCover不足10%;(4)由于参考数据与地表覆盖数据中水体面积相差较大,3种数据的生产者精度较低,在50%以下,其中GlobeLand30稍高,为43%,但3种数据的使用者精度较高,在75%以上;(5)对于人造地表,GlobeLand30的生产者精度较高,为68%,其余2种数据仅为20%,GlobeLand30的使用者精度为70%,GlobCover2009和MCD12Q1分别为59%、50%。
综上,与参考数据相比,GlobeLand30的精度和一致性最高,MCD12Q1次之,GlobCover2009最差。在具体的土地类型方面,3种地表覆盖数据中耕地和林地的精度均较高,GlobeLand30中水体和人造地表的生产者精度远高于其他2种数据,但使用者精度相差不大,3种数据对草地的分类精度都较差。

4.3 不同类型土地的混淆分析

图6是3种地表覆盖数据中不同类型土地的混淆情况,结果表明:
(1)GlobeLand30中,耕地和林地的混淆程度较低,一致性在85%以上;草地的混淆程度较高,其中30.09%被误分为耕地,47.17%被误分为林地,仅有21.67%与参考数据保持一致;由于水体面积在GlobeLand30和参考数据中差异较大,GlobeLand30中有43.68%被误分为耕地,6.54%被误分为林地,43.21与参考数据保持一致;在人造地表的分类中,有30.32%被误分为耕地,68.13%与参考数据保持 一致。
(2)GlobCover2009中,耕地的分类精度最高,达到了94.49%;在林地的分类中,有47.46%被误分为耕地,5.36%被误分为草地,46.97%与参考数据保持一致;草地、水体和人造地表3种土地类型对耕地的混淆比较严重,分别达到了83.64%、58.81%、82.37%,与参考数据的一致性分别为0.37%、22.32%和14.41%。
(3)MCD12Q1中,耕地的分类精度最高,达到了94.21%;林地的混淆程度也比较低,其中19.31%被误分为耕地,7.23%被误分为草地;由于MCD12Q1中草地、水体和人造地表3种类型土地面积与参考数据相差较大,因此与参考数据相比,这3种土地类型的混淆程度较高,其中草地的一致性仅为8.73%,漏分误差达到了91.27%,水体和人造地表的一致性分别10.31%和16.62%。
Fig. 6 The confusion degree of different land types in the three land cover products

图6 3种地表覆盖数据中不同类型土地的混淆程度

4.4 地表覆盖数据的误差分析

造成地表覆盖数据与参考数据产生不一致的误差原因主要如下:
(1)各数据采用的分类系统、分类方法不同 (表1、2)。此外,各数据对相同土地类型的定义也存在差异,如GlobeLand30中将草地定义为“天然草本植被覆盖,且盖度大于10%的土地,包括草原、草甸、稀树草原、荒漠草原,以及城市人工草地等”,GlobCover2009中将草地定义为“冠层敞开或封闭(>15%)草地”,以及“草地(50%~70%)/森林、灌丛(20%~50%)镶嵌”,MCD12Q1将草地定义为“草本类型覆盖的土地,通常为禾草状,林地和灌木覆盖低于10%”,2010年土地利用数据将草地定义为“覆盖度>50%的天然草地、改良草地和割草地,覆盖度在20%~50%的天然草地和改良草地以及覆盖度在5%~20%的天然草地”,其他各土地类型的定义也都存在差异。
(2)各数据采用的影像来源、时相不同,数据的空间分辨率存在较大差异。其中,GlobeLand30采用Landsat TM5、ETM+、HJ-1影像,数据时相为2009-2011年,分辨率为30 m;GlobCover2009采用MERIS影像,时相为2009年,分辨率为300 m;MCD12Q1采用MODIS影像,数据时相为2010年,分辨率为500 m;2010年土地利用数据采用Landsat TM影像,时相为2010年,原数据为1:10万矢量数据,这些指标也是造成误差的重要原因。例如,河南省的水体以线状河流为主,线状河流具有一定的宽度但又不会超过一定的宽度限制,在本文所采取的几种数据中,参考数据的空间分辨率最高,在该数据中线状河流表示得很清楚,在地表覆盖数据中,Globeland30分辨率相对较高,能表示出一部分线状河流,但很多没有达到30 m分辨率的要求,没有表示出来,其余2种数据的差异更大,因此水体存在明显的低估现象。
(3)各数据本身存在误差。由于各数据均以遥感影像作为数据源,对遥感影像进行解译、提取、加工处理得到的遥感制图产品,耕地、林地和草地等几种土地类型在遥感影像上具有相似的光谱特征,容易形成同谱异物现象,易造成不同土地类型之间的混淆。此外,由于河南省以平原和山地为主,其他土地类型极易与其产生混淆,因此地表覆盖数据中耕地、林地和草地等土地类型存在误差。
(4)实验处理过程中产生数据误差。本文在实验处理的过程中需要进行投影转换、坐标系转换、数据裁剪拼接等操作,对矢量数据和栅格数据要分别进行重采样和矢量数据栅格化处理,这些实验处理的过程也会造成数据误差。

5 结论

本文以河南省为研究区,利用2010年土地利用数据作为参考数据,采用空间统计、面积一致性以及误差矩阵等分析方法,对国家基础地理信息中心推出的GlobeLand30(2010年)以及与其时相相近的GlobCover2009、MCD12Q1(2010年)全球地表覆盖数据进行了精度评价和对比分析研究,主要结论 如下:
(1)3种地表覆盖数据对于河南省土地构成的描述与参考数据基本一致,即都以耕地、林地为主,草地、水体和人造地表为辅,而且土地面积的相关性很强,相关系数均在0.9以上。但是与参考数据相比,3种地表覆盖数据的分类土地面积均存在大小不同的差异。
(2)对3种地表覆盖数据进行精度评估,结果表明,GlobeLand30的总体精度和Kappa系数最高,MCD12Q1次之,GlobCover2009最低。在土地类型方面,3种地表覆盖数据中耕地和林地的精度均较高,草地的分类精度均较差,GlobeLand30中水体和人造地表的生产者精度远高于其他2种数据,使用者精度相差不大。
(3)GlobeLand30、GlobCover2009和MCD12Q1与参考数据在空间上存在类型混淆情况,混淆主要发生于林地、草地、水体、人造地表与耕地之间。其中,3种地表覆盖数据中耕地和林地的分类精度较好,对草地的混淆程度都比较高,对于水体和人造地表,GlobeLand30的混淆程度要低于其他2种 数据。
GlobeLand30是中国最新推出的30 m分辨率的全球地表覆盖数据,目前对该数据的评价、应用、分析等的研究还较少,本文以河南省为例,对其精度进行了评估,并与其他2种全球地表覆盖数据GlobCover2009和MCD12Q1进行了对比分析,研究结果表明,GlobeLand30的数据精度要高于另外2种数据。本文的方法和结论可以为进一步研究其他区域该数据的精度提供支持,本文的研究结果可以为GlobeLand30的用户提供更精准的决策依据,对于推动该产品的应用,提升该产品价值具有重要的意义。
由于GlobeLand30本身的空间分辨率要远高于其他地表覆盖数据,因此,利用GlobeLand30数据进行进一步应用研究是未来需重点研究的问题。另外,本文研究发现,GlobeLand30以及其他2种数据都存在不同程度的土地混淆情况,考虑目前已有大量的遥感影像、矢量数据以及其他多源数据,如何进行数据标准化及综合利用,使得不同数据之间可以相互补充验证,提升数据质量水平,也是接下来应当考虑的问题之一。

The authors have declared that no competing interests exist.

[1]
Pervez M S, Henebry G M.Assessing the impacts of climate and land use and land cover change on the freshwater availability in the Brahmaputra River basin[J]. Journal of Hydrology Regional Studies, 2015,3:285-311.New hydrological insights for the region: Basin average annual ET was found to be sensitive to changes in CO 2 concentration and temperature, while total water yield, streamflow, and groundwater recharge were sensitive to changes in precipitation. The basin hydrological components were predicted to increase with seasonal variability in response to climate and land use change scenarios. Strong increasing trends were predicted for total water yield, streamflow, and groundwater recharge, indicating exacerbation of flooding potential during August–October, but strong decreasing trends were predicted, indicating exacerbation of drought potential during May–July of the 21st century. The model has potential to facilitate strategic decision making through scenario generation integrating climate change adaptation and hazard mitigation policies to ensure optimized allocation of water resources under a variable and changing climate.

DOI

[2]
Clerici N, Paracchini M L, Maes J.Land-cover change dynamics and insights into ecosystem services in European stream riparian zones[J]. Ecohydrology & Hydrobiology, 2014,14(2):107-120.Riparian zones, transitional environments between terrestrial and freshwater ecosystems, have been historically threatened in Europe by land reclamation and exploitation of their natural resources. These fragile environments deliver a large number of ecological and societal services, while simultaneously playing a key role in the maintenance of biodiversity in fragmented landscapes. At large scales, one of the clearest and most informative indicators of alteration of state and characteristics of ecological systems is land-cover change. A newly available European riparian zone distribution dataset and continental land-cover change information allowed us to obtain an unprecedented continental overview of riparian land conversion and associated drivers, as well as a broad indication of their loss of capacity to provide ecosystem services. The analysis shows that only 1.8% of riparian zones experienced land-cover changes in the period 2000鈥2006. The majority of riparian changes involved forest loss and forest regrowth due to forestry activities and, to a lesser extent, to fires. Approximately 9% of land-cover changes involved conversion to artificial and agricultural surface, with trajectories largely affecting their ecological integrity. Using land-cover proxy-based indicators we show that the loss of riparian zones鈥 capacity to support ecological integrity and ecosystem services was overall significantly higher than the proportion of converted surface. The methodological approach can be used to support the assessment of environmental policy targets, and for regional planning and management of riparian zones.

DOI

[3]
陈利军,陈军,廖安平,等. 30m全球地表覆盖遥感分类方法初探[J].测绘通报,2012(S1):350-353.全球地表覆盖分布及变化是气候变化研究、生态环境评估、地理国情监测、宏观调控分析等不可或缺的重要基础信息。由于全球范围内地表覆盖复杂多样,光谱差异大,单一的分类算法缺乏通用性,提出层次分类策略并进行试验分析。结果表明,层次分类策略要优于SVM、J48、RF和贝叶斯等分类方法。通过全球范围10个试验区的试验,除受大面积云影响的马来西亚试验区精度为65%之外,其他区域的总体分类精度均达到70%以上,具有较强的鲁棒性和通用性,可以用于30 m全球地表覆盖产品的研制。

[Chen L J, Chen J, Liao A P, et al.A preliminary study on the method of30 m global land cover classification[J]. Bulletin of Surveying and Mapping, 2012(S1):350-353. ]

[4]
Hansen M C, Reed B, Defries R S, et al.A comparison of the IGBP DISCover and University of Maryland 1 km global land cover products[J]. International Journal of Remote Sensing, 2000,21(6-7):1365-1373.Two global 1 km land cover data sets derived from 1992-1993 Advanced Very High Resolution Radiometer (AVHRR) data are currently available, the International Geosphere-Biosphere Programme Data and Information System (IGBP-DIS) DISCover and the University of Maryland (UMd) 1 km land cover maps. This paper makes a preliminary comparison of the methodologies and results of the two products. The DIS...

DOI

[5]
Friedl M A, Mciver D K, Hodges J C F, et al. Global land cover mapping from MODIS: algorithms and early results[J]. Remote Sensing of Environment, 2002,83(83):287-302.Until recently, advanced very high-resolution radiometer (AVHRR) observations were the only viable source of data for global land cover mapping. While many useful insights have been gained from analyses based on AVHRR data, the availability of moderate resolution imaging spectroradiometer (MODIS) data with greatly improved spectral, spatial, geometric, and radiometric attributes provides significant new opportunities and challenges for remote sensing-based land cover mapping research. In this paper, we describe the algorithms and databases being used to produce the MODIS global land cover product. This product provides maps of global land cover at 1-km spatial resolution using several classification systems, principally that of the IGBP. To generate these maps, a supervised classification methodology is used that exploits a global database of training sites interpreted from high-resolution imagery in association with ancillary data. In addition to the IGBP class at each pixel, the MODIS land cover product provides several other parameters including estimates for the classification confidence associated with the IGBP label, a prediction for the most likely alternative class, and class labels for several other classification schemes that are used by the global modeling community. Initial results based on 5 months of MODIS data are encouraging. At global scales, the distribution of vegetation and land cover types is qualitatively realistic. At regional scales, comparisons among heritage AVHRR products. Landsat TM data, and results from MODIS show that the algorithm is performing well. As a longer time series of data is added to the processing stream and the representation of global land cover in the site database is relined, the quality of the MODIS land cover product will improve accordingly.

DOI

[6]
Bartholomé E, Belward A S.GLC2000: a new approach to global land cover mapping from Earth observation data[J]. International Journal of Remote Sensing, 2005,26(9):1959-1977.A new global land cover database for the year 2000 (GLC2000) has been produced by an international partnership of 30 research groups coordinated by the European Commission's Joint Research Centre. The database contains two levels of land cover information鈥攄etailed, regionally optimized land cover legends for each continent and a less thematically detailed global legend that harmonizes regional legends into one consistent product. The land cover maps are all based on daily data from the VEGETATION sensor on-board SPOT 4, though mapping of some regions involved use of data from other Earth observing sensors to resolve specific issues. Detailed legend definition, image classification and map quality assurance were carried out region by region. The global product was made through aggregation of these. The database is designed to serve users from science programmes, policy makers, environmental convention secretariats, non-governmental organizations and development-aid projects. The regional and global data are available free of charge for all non-commercial applications from http://www.gvm.jrc.it/glc2000.

DOI

[7]
Olivier A, Patrice B, Frederic A, et al.GLOBCOVER: the most detailed portrait of Earth[J]. ESA bulletin. Bulletin ASE. European Space Agency, 2008,136:24-31.ABSTRACT The Medium Resolution Imaging Spectrometer (MERIS) of Envisat environmental satellite produced a new map of Earth's surface. ESA is responsible for the production of the MERIS 300 m Full Resolution Full Swath (FRS) products. The map data can be used to study the land-cover trends, ecosystem, and climate change. The online information about the map can be found on the map server tool on ESA's GlobCover web site. The GlobCover products provide the detailed information of land cover and land surface. These information are useful for studying sustainable management of natural resources, environmental protection, food security, climate change, and humanitarian programs. The GlobCover is able to provide maps of croplands, wetlands, forest, artificial surfaces, water bodies, snow, and ices. The GlobCover has a GlobCover software, the execution environment, and the associated hardware.

[8]
陈军,陈晋,廖安平,等.全球30 m地表覆盖遥感制图的总体技术[J].测绘学报,2014,43(6):551-557.针对全球30m分辨率地表覆盖遥感制图这一世界性难题,提出了以多源影像最优化处理、参考资料服务化整合、覆盖类型精细化提取、产品质量多元化检核为主线的总体研究思路,研发了影像几何与辐射重建、异质异构服务化集成、对象化分层分类、知识化检核处理等主体技术方法;用于制定了相应数据产品规范、生产技术规范,研发了多项生产型软件,用于研制了2000和2010两个基准年的全球30m地表覆盖数据产品,将空间分辨率提高了1个数量级。

DOI

[Chen J, Chen J, Liao A P, et al.Concepts and key techniques for 30m global land cover mapping[J]. Acta Geodaetica et Cartographica Sinica, 2014,43(6):551-557. ]

[9]
陈军,陈晋,宫鹏,等.全球地表覆盖高分辨率遥感制图[J].地理信息世界,2011,9(2):12-14.全球地表覆盖分布及变化是气候变化研究、生态环境评估、地理国情监测、宏观调控分析等不可或缺的重要基础信息。国际上现有全球五套地表覆盖数据产品的空间分辨率为1km或300m,数据精度、分类体系、时空分辨率等均存在不足。为了满足全球变化研究与地球模式模拟的需求,应该研制具有较高时空分辨率、更符合全球变化需要、精度较好的全球地表覆盖数据产品。本文简要介绍了全球地表覆盖遥感制图的情况和数据产品的不足,讨论了对新一代地表覆盖数据产品的需求,介绍了我国研制全球30m地表覆盖数据产品的863重点项目。

DOI

[Chen J, Chen J, Gong P, et al.Higher resolution global Land cover mapping[J]. Geomatics World, 2011,9(2):12-14. ]

[10]
Jun C, Ban Y, Li S.China: Open access to Earth land-cover map[J]. Nature, 2014,514(7523):434.Not Available

DOI PMID

[11]
廖安平,彭舒,武昊,等. 30 m全球地表覆盖遥感制图生产体系与实践[J].测绘通报,2015(10):4-8.在以"多源影像最优化处理、参考资料服务化整合、覆盖类型精细化提取、产品质量多元检核"为主线的总体研究基础上,依托生产技术规范体系、全过程质量控制手段和支持环境,通过30 m地表覆盖产品和技术设计、多源影像资料收集整合处理、分区按类型地表覆盖数据提取组织实施及数据产品集成与优化,构建了工程化的30 m全球地表覆盖遥感制图生产体系,实现了预期的产品指标,完成了2000和2010两个基准年的30 m地表覆盖数据产品研制。通过精度评价,该套数据产品分类精度达到80%以上。该生产体系的构建为开展较高分辨率全球地表覆盖数据产品研制、细化、更新奠定了基础,为开展大规模遥感影像信息提取、表达和应用起到了示范作用。

DOI

[LIAO A P, Peng S, Wu H, et al.The production system of 30 m global land cover mapping and its application[J]. Bulletin of Surveying and Mapping, 2015,10:4-8. ]

[12]
Herold M, Mayaux P, Woodcock C E, et al.Some challenges in global land cover mapping: An assessment of agreement and accuracy in existing 1km datasets[J]. Remote Sensing of Environment, 2008,112(5):2538-2556.Many investigators need and use global land cover maps for a wide variety of purposes. Ironically, after many years of very limited availability, there are now multiple global land cover maps and it is not readily apparent (1) which is most useful for particular applications or (2) how to combine the different maps to provide an improved dataset. The existing global land cover maps at 1km spatial resolution have arisen from different initiatives and are based on different remote sensing data and employed different methodologies. Perhaps more significantly, they have different legends. As a result, comparison of the different land cover maps is difficult and information about their relative utility is limited. In an attempt to compare the datasets and assess their strengths and weaknesses we harmonized the thematic legends of four available coarse-resolution global land cover maps (IGBP DISCover, UMD, MODIS 1-km, and GLC2000) using the LCCS-based land cover legend translation protocols. Analysis of the agreement among the global land cover maps and existing validation information highlights general patterns of agreement, inconsistencies and uncertainties. The thematic classes of Evergreen broadleaf trees, Snow and Ice, and Barren show high producer and user accuracy and good agreement among the datasets, while classes of mixed tree types show high commission errors. Overall, the results show a limited ability of the four global products to discriminate mixed classes characterized by a mosaic of trees, shrubs, and herbaceous vegetation. There is a strong relationship between class accuracy, spatial agreement among the datasets, and the heterogeneity of landscapes. Suggestions for future mapping projects include careful definition of mixed unit classes, and improvement in mapping heterogeneous landscapes.

DOI

[13]
Giri C, Zhu Z, Reed B.A comparative analysis of the Global Land Cover 2000 and MODIS land cover data sets[J]. Remote Sensing of Environment, 2005,94(1):123-132.Accurate and up-to-date global land cover data sets are necessary for various global change research studies including climate change, biodiversity conservation, ecosystem assessment, and environmental modeling. In recent years, substantial advancement has been achieved in generating such data products. Yet, we are far from producing geospatially consistent high-quality data at an operational level. We compared the recently available Global Land Cover 2000 (GLC-2000) and MODerate resolution Imaging Spectrometer (MODIS) global land cover data to evaluate the similarities and differences in methodologies and results, and to identify areas of spatial agreement and disagreement. These two global land cover data sets were prepared using different data sources, classification systems, and methodologies, but using the same spatial resolution (i.e., 1 km) satellite data. Our analysis shows a general agreement at the class aggregate level except for savannas/shrublands, and wetlands. The disagreement, however, increases when comparing detailed land cover classes. Similarly, percent agreement between the two data sets was found to be highly variable among biomes. The identified areas of spatial agreement and disagreement will be useful for both data producers and users. Data producers may use the areas of spatial agreement for training area selection and pay special attention to areas of disagreement for further improvement in future land cover characterization and mapping. Users can conveniently use the findings in the areas of agreement, whereas users might need to verify the informaiton in the areas of disagreement with the help of secondary information. Learning from past experience and building on the existing infrastructure (e.g., regional networks), further research is necessary to (1) reduce ambiguity in land cover definitions, (2) increase availability of improved spatial, spectral, radiometric, and geometric resolution satellite data, and (3) develop advanced classification algorithms.

DOI

[14]
Pérez-Hoyos A, García-Haro F J, San-Miguel-Ayanz J. Conventional and fuzzy comparisons of large scale land cover products: Application to CORINE, GLC2000, MODIS and GlobCover in Europe[J]. Isprs Journal of Photogrammetry & Remote Sensing, 2012,74(11):185-201.Overall accuracies between datasets based on a generalized nomenclature ranged from 35% (GlobCover–MODISLC) to 57% (CORINE–GLC2000). A further assessment based on a flexible Boolean comparison allowed us to minimize part of the uncertainty introduced by ambiguity of legends, resulting in an overall increase of agreement of around 10% in absolute terms. Reduction of positional errors produced an agreement increase of around 5%. The fuzzy approach allowed us to examine certain criteria used in classification systems to better understand the causes of discrepancies among datasets and express them in terms of relevant land attributes, irrespective of class names. This method served to highlight the consistency of the land cover maps under consideration, especially for datasets that showed higher divergences. In particular, it allows the identification of areas that are very close in land attributes, even when a Boolean comparison shows them as different.

DOI

[15]
吴文斌,杨鹏,张莉,等.四类全球土地覆盖数据在中国区域的精度评价[J].农业工程学报,2009,25(12):167-173.该研究以中国耕地类别为研究对象,选择2000年中国土地利用数据(NLCD-2000)为参考数据,利用比较分析法,从面积数量精度和空间位置精度两方面对目前4类全球土地覆盖数据(UMD、IGBP-DISCover、MODIS和GLC2000)产品进行了精度验证,并分析研究了4类数据精度的异同性。结果表明,4类全球数据对中国耕地数量特征和空间位置特征的估测具有明显的区域差异性。MODIS数据集和GLC2000数据集对中国耕地制图的总体精度要高于UMD数据集和IGBP-DISCover数据集。4类数据制图精度高的区域主要分布在中国的农业主产区,而误差大的区域主要分布在中国山区或耕地比例低的区域。低空间分辨率的信息源、基于像元的分类方法,以及中国复杂地形特征是4类全球土地覆盖数据精度差异的主要原因。

DOI

[Wu W B, Yang P, Zhang L, et al.Accuracy assessmentof four global land cover datasets in China[J]. Transactionsof the Chinese Society of Agricultural Engineering,2009,25(12):167-173. ]

[16]
宋宏利,张晓楠.中国区域多源土地覆被遥感产品精度分析与验证[J].农业工程学报,2012,28(22):207-214.国家及区域尺度的土地覆被信息对于解决环境演变、生物多样性保护、生态系统评价及环境建模等一系列问题起着至关重要的作用。该文以中国科学院CHINA2000数据为参考,从国家尺度比较了当前全球4种土地覆被遥感产品的分类精度,以便解释验证数据与参考数据在空间及专题上的一致性和异质性。结果表明:与参考数据相比,4种遥感产品的土地覆被类别的空间分布,从整体上表现出较高的一致性,但在局部区域差异性较大,特别是在景观异质性较强的西南和东南地区;GLC2000遥感产品从相关系数和总体精度方面都表现出与参考数据较好的一致性,其相关系数为0.92,总体精度为55.86%,GLOBCOVER产品则表现出与参考数据较差的一致性;4种产品与参考数据在空间上表现出明显的混淆现象,混淆主要发生于林地、灌木、草地和耕地之间,这表明粗空间分辨率遥感产品在识别叶类土地覆被类型的能力上仍需要改进,该文为中国用户合理利用遥感产品提供了科学合理的依据。

DOI

[Song H L, Zhang X N.Precision analysis and validationof multi-sources land cover products derived from remotesensing in China[J]. Transactions of the Chinese Societyof Agricultural Engineering, 2012,28(22):207-214. ]

[17]
宁佳,张树文,蔡红艳,等. MODIS和GLOBCOVER全球土地覆盖数据集对比分析——以黑龙江流域为例[J].地球信息科学学报,2012,14(2):240-249.随着全球气候变化的日益加剧,全球变化研究对全球土地覆盖数据的需要也越来越迫切。目前全球土地覆盖数据产品主要包括由欧洲和美国生产的5类数据产品,其中,美国波士顿大学生产的全球土地覆盖数据产品(即MODIS数据集)和欧洲空间局通过全球合作生产的全球土地覆盖数据产品(即Globcover数据集)具有较好的实效性,应用越来越广泛。由于数据来源、分类系统和分类方法不同,两个数据集在土地覆盖类型的数量和空间分布上有明显的差异。本研究从数据使用者的角度,对比了MODIS和Globcover数据集在黑龙江流域上数量和空间分布的差异,并采用LANDSAT TM/ETM+影像随机采样和野外照片验证两种方式对两个数据集的分类精度进行了验证。结果表明,在黑龙江流域,两个数据集数量和空间分布差异较大。在数量上,两个数据集一级土地覆盖类型均以森林和农田为主,草地次之,但二级土地覆盖类型差异较大。在空间上,二级类空间一致性区域和一级类空间一致性的区域分别仅占流域的22.5%和53.6%。两个数据集精度均不高,一级土地覆盖类型精度约为60%,Glob-cover数据较MODIS数据破碎化明显,整体精度略低于MODIS数据集,不同的二级土地覆盖类型精度不同。考虑到黑龙江流域的代表性,我们认为Globcover数据集和MODIS数据集可满足较低要求的土地覆盖分析需求。本研究为全球气候变化研究选择合适的数据集提供了基础。

DOI

[Ning J, Zhang SW, Cai H Y, et al.A comparative analysis of the MODISland cover data sets and Globcover land cover data sets in Heilongjiang basin[J]. Journal of Geo-Information Science,2012,14(2):240-249. ]

[18]
Manakos I, Petrou Z I, Filchev L, et al.Globalland30 Mapping Capacity of Land Surface Water in Thessaly, Greece[J]. Land, 2015,4(1):1-18.The National Geomatics Center of China (NGCC) produced Global Land Cover (GlobalLand30) maps with 30 m spatial resolution for the years 2000 and 2009鈥2010, responding to the need for harmonized, accurate, and high-resolution global land cover data. This study aims to assess the mapping accuracy of the land surface water layer of GlobalLand30 for 2009鈥2010. A representative Mediterranean region, situated in Greece, is considered as the case study area, with 2009 as the reference year. The assessment is realized through an object-based comparison of the GlobalLand30 water layer with the ground truth and visually interpreted data from the Hellenic Cadastre fine spatial resolution (0.5 m) orthophoto map layer. GlobCover 2009, GlobCorine 2009, and GLCNMO 2008 corresponding thematic layers are utilized to show and quantify the progress brought along with the increment of the spatial resolution, from 500 m to 300 m and finally to 30 m with the newly produced GlobalLand30 maps. GlobalLand30 detected land surface water areas show a 91.9% overlap with the reference data, while the coarser resolution products are restricted to lower accuracies. Validation is extended to the drainage network elements, i.e. , rivers and streams, where GlobalLand30 outperforms the other global map products, as well.

DOI

[19]
Arsanjani J J, See L, Tayyebi A.Assessing the suitability of GlobeLand30 for mapping land cover in Germany[J]. International Journal of Digital Earth, 2016.ABSTRACTGlobal land cover (LC) maps have been widely employed as the base layer for a number of applications including climate change, food security, water quality, biodiversity, change detection, and environmental planning. Due to the importance of LC, there is a pressing need to increase the temporal and spatial resolution of global LC maps. A recent advance in this direction has been the GlobeLand30 dataset derived from Landsat imagery, which has been developed by the National Geomatics Center of China (NGCC). Although overall accuracy is greater than 80%, the NGCC would like help in assessing the accuracy of the product in different regions of the world. To assist in this process, this study compares the GlobeLand30 product with existing public and online datasets, that is, CORINE, Urban Atlas (UA), OpenStreetMap, and ATKIS for Germany in order to assess overall and per class agreement. The results of the analysis reveal high agreement of up to 92% between these datasets and GlobeLand30 but that large...

DOI

[20]
Ran Y H, Xin L I.First comprehensive fine-resolution global land cover map in the world from China—Comments on global land cover map at 30-m resolution[J]. Science China Earth Sciences, 2015,58(9):1-2.正Land cover maps are of fundamental importance in studies of the complex interactions between human activities and global change.Mapping land cover using remote sensing is a traditional but still very active field.In the past 45 years,nearly 30000 papers about land cover mapping were published worldwide,including approximately 10000 papers

DOI

[21]
陈军,陈利军,李然,等.基于GlobeLand30的全球城乡建设用地空间分布与变化统计分析[J].测绘学报,2015,44(11):1181-1188.城乡建设用地分布与变化是人类活动的直观标志和生态足迹,在环境变化研究、地理国(世)情监测和可持续发展研究等方面发挥着重要作用。以往人们对一些城市、区域或国家的城乡建设用地分布与变化进行过较为深入系统的研究,但在全球尺度上,这方面研究尚为空白。本文是利用我国自主研制的世界上首套30m空间分辨率全球地表覆盖数据集GlobeLand30的人造地表数据层,首次开展了全球城乡建设用地的空间分布及变化的统计分析。它采用用地面积、构成占比和增量占比等主要指标,统计全球范围内城乡建设用地的空间分布及2000年至2010年10年间的变化,重点分析了2010年全球、各大洲及主要国家的城乡建设用地分布现状与地域差异,2000年至2010年全球、主要国家的建设用地变化以及其主要土地来源。研究结果表明,2010年全球城乡建设用地总面积为118.75×10⁴km2,占全球陆表面积的0.88%;2000年至2010年全球城乡建设用地面积增加了5.74×10⁴ km2,变化率为5.08%,其中,中国和美国新增城乡建设用地约占全球的一半;新增城乡建设用地占用最多的是耕地,占总量的50.26%。这些为研究全球陆表人类活动的空间分布特征与变化趋势提供了翔实的信息和知识。

DOI

[Chen J, Chen L J, Li R, et al.Spatial distribution and ten years change of global built-up areas derived from GlobeLand30[J]. Acta Geodaetica et Cartographica Sinica, 2015,44(11):1181-1188. ]

[22]
鲁楠,张委伟,陈利军,等.顾及城乡差异的大区域人口密度估算——以山东省为例[J].测绘学报,2015,44(12):1384-1391.现有大区域人口密度估算结果大多是在千米级尺度上,仅能宏观地反映城乡人口分布的范围,无法准确地刻画城乡人口空间分布的细节特征.本文将首套30 m全球地表覆盖数据(GlobeLand30)引入城乡人口密度估算中,基于实现城乡划分的GlobeLand30人造地表数据,在城镇区域运用夜间灯光强度与人口的相关性将城镇人口细划到30 m尺度上来估算城镇人口密度;在乡村区域引入样方估算的方法修正乡村居民地面积以估算乡村人口密度.以山东省为试验区的研究表明,本文方法无论在城乡居民地刻画还是人口空间分布的表达上均优于参考数据,所使用的GlobeLand30的全球性也保证了该方法推广的可行性.

DOI

[Lu n, Zhang W W, Chen L J, et al. Estimation of large regional urban and rural population density based on the differences of population distribution between urban and rural: take Shandong province as example[J]. Acta Geodaetica et Cartographica Sinica, 2015,44(12):1384-1391. ]

[23]
Chen J, Chen J, Liao A, et al.Global land cover mapping at 30 m resolution: A POK-based operational approach[J]. Isprs Journal of Photogrammetry & Remote Sensing, 2015,103:7-27.Over 10,000 Landsat-like satellite images are required to cover the entire Earth at 30聽m resolution. To derive a GLC map from such a large volume of data necessitates the development of effective, efficient, economic and operational approaches. Automated approaches usually provide higher efficiency and thus more economic solutions, yet existing automated classification has been deemed ineffective because of the low classification accuracy achievable (typically below 65%) at global scale at 30聽m resolution. As a result, an approach based on the integration of pixel- and object-based methods with knowledge (POK-based) has been developed. To handle the classification process of 10 land cover types, a split-and-merge strategy was employed, i.e. firstly each class identified in a prioritized sequence and then results are merged together. For the identification of each class, a robust integration of pixel-and object-based classification was developed. To improve the quality of the classification results, a knowledge-based interactive verification procedure was developed with the support of web service technology. The performance of the POK-based approach was tested using eight selected areas with differing landscapes from five different continents. An overall classification accuracy of over 80% was achieved. This indicates that the developed POK-based approach is effective and feasible for operational GLC mapping at 30聽m resolution.

DOI

[24]
刘纪远,张增祥,徐新良,等. 21世纪初中国土地利用变化的空间格局与驱动力分析[J].地理学报,2009,64(12):1411-1420.在全球环境变化研究中,以土地利用与土地覆盖动态为核心的人类-环境耦合系统研究逐渐成为土地变化科学(LCS)研究的新动向。基于覆盖中国21世纪初5年间隔的遥感卫星数据获取的1km网格土地利用变化空间信息,依据近5年土地利用变化区域分异的显著特征,以及自然地理、经济发展与国家宏观政策因素综合考虑,设计针对21世纪初5年新的中国土地利用动态区划图,揭示土地利用变化的空间格局与驱动因素。总体上,21世纪初5年中国处于土地利用快速变化期,黄淮海平原、东南沿海地区与四川盆地城乡建设用地显著扩张,占用大规模优质农田,导致南方水田面积明显减少;西北绿洲农业发展与东北地区开垦导致北方旱地面积略有增加;受西部开发"生态退耕"政策的影响中西部地区林地面积显著增加,国家退耕还林还草政策成效明显,对区域土地覆盖状况的改善产生积极的影响;这一时段国土开发与区域发展战略的实施,包括"西部大开发"、"东北振兴"等国家重大政策,加之快速的经济发展是该阶段土地利用变化格局形成的主要驱动因素。

DOI

[Liu J Y, Zhang Z X, Xu X L, et al.Spatial patterns and driving forces of land use change in China during the early 21st century[J]. Acta Geographica Sinica, 2009,64(12):1411-1420. ]

[25]
刘纪远,匡文慧,张增祥,等. 20世纪80年代末以来中国土地利用变化的基本特征与空间格局[J].地理学报,2014,69(1):3-14.土地利用/土地覆被变化(LUCC)是人类活动与自然环境相互作用最直接的表现形式,本文采用相同空间分辨率的卫星遥感信息源和相同的技术方法,对中国1980 年代末到2010 年土地利用变化数据进行定期更新。在此基础上,提出并发展土地利用动态区划的方法,研究土地利用变化的空间格局与时空特征。我们发现:1990-2010 年的20 年间,中国土地利用变化表现出明显的时空差异。“南减北增,总量基本持衡,新增耕地的重心逐步由东北向西北移动”是耕地变化的基本特征;“扩展提速,东部为重心,向中西部蔓延”是城乡建设用地变化的基本特征;“林地前减后增,荒漠前增后减,草地持续减少”是非人工土地利用类型变化的主要特征。20 世纪末与21 世纪初两个10 年相比,中国土地利用变化空间格局出现了一些新特征,原有的13 个土地利用变化区划单元演变为15 个单元,且部分区划单元边界发生变化。主要变化格局特征为黄淮海地区、东南部沿海地区、长江中游地区和四川盆地城镇工矿用地呈现明显的加速扩张态势;北方地区耕地开垦重心由东北地区和内蒙古东部转向西北绿洲农业区;东北地区旱作耕地持续转变为水田;内蒙古农牧交错带南部、黄土高原和西南山地退耕还林还草效果初显。近20 年间,尽管气候变化对北方地区的耕地变化有一定的影响,但政策调控和经济驱动仍然是导致我国土地利用变化及其时空差异的主要原因。2000 年后的第一个10 年,土地利用格局变化的人为驱动因素已由单向国土开发为主,转变为开发与保护并重。在空间格局变化的分析方法方面,应用“动态区划法”开展世纪之交两个10 年中国LUCC空间格局变化的分析,有效揭示了20 年来中国LUCC“格局的变化过程”,即动态区划边界的推移、区划单元内部特征的变化与单元的消长等;以及“变化过程的格局”,即土地利用变化过程与特征的分阶段区域差异,清晰刻画了LUCC动态区划中区划单元的消长,单元边界的变动,以及前后10 年的变化强度特征,揭示了土地利用“格局”与“过程”之间的交替转化规律,以及不同类型和区域的变化原因,证明了该分析方法的有效性。

DOI

[Liu J Y, Kuang W H, Zhang Z X, et al.Spatio temporal characteristics, patterns and causes of land use changes in China since the late 1980s[J]. Acta Geographica Sinica, 2014,69(1):3-14. ]

[26]
Pontius Jr R G, Millones M. Death to Kappa: birth of quantity disagreement and allocation disagreement for accuracy assessment[J]. Health Policy, 2011,32(15):4407-4429.The family of Kappa indices of agreement claim to compare a map's observed classification accuracy relative to the expected accuracy of baseline maps that can have two types of randomness: (1) random distribution of the quantity of each category and (2) random spatial allocation of the categories. Use of the Kappa indices has become part of the culture in remote sensing and other fields. This article examines five different Kappa indices, some of which were derived by the first author in 2000. We expose the indices' properties mathematically and illustrate their limitations graphically, with emphasis on Kappa's use of randomness as a baseline, and the often-ignored conversion from an observed sample matrix to the estimated population matrix. This article concludes that these Kappa indices are useless, misleading and/or flawed for the practical applications in remote sensing that we have seen. After more than a decade of working with these indices, we recommend that the profession abandon the use of Kappa indices for purposes of accuracy assessment and map comparison, and instead summarize the cross-tabulation matrix with two much simpler summary parameters: quantity disagreement and allocation disagreement. This article shows how to compute these two parameters using examples taken from peer-reviewed literature.

DOI

Outlines

/