Orginal Article

Classification of Urban Rail Transit Stations based on SAX

  • ZHANG Liying , 1, 2 ,
  • MENG Bin , 3, * ,
  • YIN Qin 4
Expand
  • 1. College of Geoscience and Surveying Engineering, China University of Mining& Technology, Beijing 100083;
  • 2. College of Geophysics and Information Engineering, China University of Petroleum, Beijing 102249
  • 3. College of Applied Arts & Sciences of Beijing Union University, Beijing 100191;
  • 4. College of Resource Environment and Tourism, Capital Normal University, Beijing 100048
*Corresponding author: MENG Bin, E-mail:

Received date: 2016-08-04

  Request revised date: 2016-10-18

  Online published: 2016-12-20

Copyright

《地球信息科学学报》编辑部 所有

Abstract

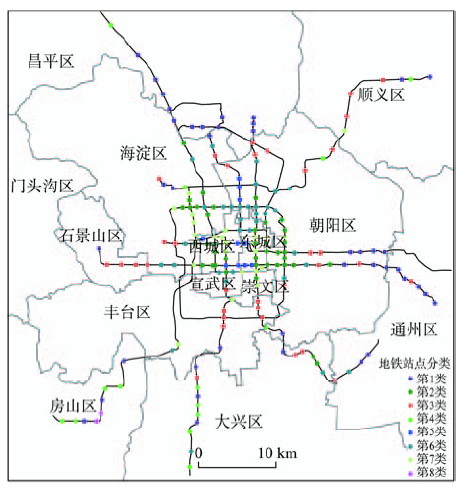
:Urban rail transit stations are the key nodes of the basic urban rail transit network system. The scientific classification of the rail transit stations is significant to understand the urban functional zoning and evaluate the construction of the rail transit infrastructure. The time series data of urban rail transit stations objectively records the important information of observed stations at all-time points. The time series data contains different patterns, which reflect different sequence genesis. Therefore, studying cluster of the time series data is an important means to recognize and understand the essence of time series data formation. It is also a major method to mine higher value of principle and knowledge that implied in time series data. In this paper, we use smart card data of urban rail transit stations in Beijing, and divide the big data into four data sets: weekdays boarding data set (WB), weekdays alighting data set (WA), weekends (rest day) boarding data set (RB) and weekends alighting data set (RA) to describe characteristics of each station’s daily passenger volume. Symbolic Aggregate approXimation (SAX) is firstly introduced to analyze four data sets, which effectively reduces the dimensionality of high-dimensional data and realizes similarity measure between stations. Finally, it is more reasonable to classify the 195 rail transit stations into 8 types according to the DB index by hierarchical clustering method. They are residential stations, work stations, partial residential-based residential and work mixed stations, dislocation stations, tourist attractions and commercial stations, partial work-based residential and work mixed stations, integrated stations and other stations. The performance of SAX is compared with Euclidean distance similarity measure. The results indicate that SAX outperforms Euclidean distance in terms of accuracy and efficiency. The paper analyzes characteristics of daily passenger boarding and alighting volume on four data sets and spatial distribution of each type. It is found that residence and dislocation stations are mostly located in the far end of the subway, while the types of work stations, tourist attractions and commercial stations, partial work-based residential and work mixed stations, and integrated stations are concentrated in the urban areas. Partial residential-based residential and work mixed stations scatter around the city center. The results can help to interpret the different functional zoning of the city and the characteristics of residents' travel behavior, which provides a basis for understanding the urban spatial pattern and its evolution process, and also provides some objective reference for planning, design and management services of rail transit stations.

Cite this article

ZHANG Liying , MENG Bin , YIN Qin . Classification of Urban Rail Transit Stations based on SAX[J]. Journal of Geo-information Science, 2016 , 18(12) : 1597 -1607 . DOI: 10.3724/SP.J.1047.2016.01597

1 引言

轨道站点是城市轨道交通基本线网系统中的关键节点,随着国内城市轨道交通建设的全面展开,轨道在城市交通中发挥着越来越重要的作用。2013年北京市交通发展年度报告指出北京轨道交通占公共交通出行的比重由2000年13.6%增至 2012年38.2%[1],对改善北京市交通结构、优化城市空间布局、提高生活环境质量发挥了重要作用。不同类型的站点在城市中的区域特征、交通功能、用地功能等方面均存在差异[2],科学的地铁站点分类,对了解城市功能分区、解读居民出行特征、理解城市格局和演化以及评价轨道交通基础设施建设情况具有重要意义。
国内外学者针对轨道交通站点开展了大量的研究。国外对轨道交通站点的分类研究一般以城市地铁站点为研究对象,把郊区地铁站点作为其中的子类[3],根据站点交通节点的特性,或者开放空间的场所特性进行分类指标选取,如站点客流量大小、站点服务地区的主要功能、站点衔接方式种类、或者与某个指定参照系统的相关关系等[4]。日本东京、大阪等城市根据地铁站点所处区位,首先将地铁站点划分为市区和郊区站点,再通过站点衔接方式种类、换乘比例等指标将其各划分为3个不同的等级[5]。国内学者对轨道站点分类研究主要采用2种分类标准:①国内部分城市轨道建设采用的分类标准,一般采用站点衔接的交通方式、轨道线路数以及站点周围的土地利用类型等作为分级指标,将地铁站点划分为3-4个等级[6]。吴娇蓉等[7-8]按照站点区位特征、站点周边土地利用性质、开发规模和强度等数据,将上海市郊区轨道交通站点划分为7大类。段德罡等[2]综合考虑站点的区域特征和交通功能,对西安地铁2号线的站点进行分类研究。余丽洁等[9]使用西安地铁2号线现状及规划特征年的数据,采用几种不同的谱聚类算法对站点分类效果进行了评述。②通过轨道交通的运营资料数据进行分类。马小毅[10]根据不同类型站点的客流特征差异,将站点分为居住型、办公型、商业型和枢纽型。王静等[11]通过分析站点进站客流的波动性对站点进行聚类,归纳出周边不同用地类型的车站客流时空分布差异性特征规律。谭啸[12]按轨道站点的职能进行了站点分类的研究。从国内外研究现状看,大多学者是通过实地调研数据、站点交通职能或站点周边土地利用情况对某些线路的站点分类进行了研究。采用大规模的数据对城市的轨道站点分类的研究相对比较少。
公交IC卡的使用为研究轨道交通站点的交通职能积累了具有地理标识和时间标签的大数据,其数据具有连续性好、覆盖面广、信息全面且动态更新等优点[13]。国内外学者利用公交IC卡数据也展开了很多研究: Ali等[14]利用公交智能卡数据作为大型活动的输入数据,基于公共交通仿真分析有关公交出行的用户行为;Gitanjali等[15]对公交智能卡数据使用数据挖掘的聚类方法,实现更好地理解旅行模式和评价旅客的旅行行为属性;Long等[16]使用IC卡数据研究北京通勤的模式;Joh和Hwang [17]利用IC卡数据分析了公交卡持有者的出行轨迹与都市区的土地利用特征;Jang[18]利用IC卡数据对公交出行时间和换乘信息进行估计;Bagchi等[19]使用IC卡数据对公共交通市场进行分析;Roth等[20]基于伦敦实时的Oyster卡数据库,获得地铁乘客移动特征;Ma等[21]使用IC卡数据对公共交通乘客的出行模式进行了研究;尹芹等[22] 使用IC卡地铁刷卡客流量数据,引入客流特征的时间序列聚类方法,对地铁站点进行分类研究;戴霄等[23]研究了数据挖掘技术在公交卡信息处理方面的运用;杨智伟等[24]基于大连的IC卡数据进行客流预测。总体上,这些研究侧重于研究用户的出行行为、通勤模式、公共交通市场分析以及客流预测。使用IC卡数据对轨道站点进行分类研究,尤其是从工作日和休闲日进出站形成的多元时间序列的角度对轨道站点进行分类的研究相对较少。
轨道交通站点时间序列中蕴藏着不同的模式,不同的模式反映了不同的时间序列成因。对轨道交通站点的时间序列进行聚类分析,是认识和理解轨道站点时间序列形成本质的重要手段,也是挖掘轨道交通站点时间序列中隐含的有较高价值规律知识的重要方法[25-26]。由于时间序列具有海量、高维的特性,研究者提出了近似表示的思路,实现对时间序列作降维处理[27]。其基本思想是保留时间序列的主要形态,对时间序列进行压缩表示,用新的表示近似替代原始的时间序列。代表性的时间序列近似表示有离散傅立叶变换(the Discrete Fourier, DWT)[28]、分段累积近似(Piecewise Aggregate Approximation,PAA)[29]、符号集合近似(Symbolic Aggregate approXimation,SAX)[30-32]、可索引符号聚集近似(indexable SAX,iSAX)、分段线性近似(Piecewise Linear Approximation,PLA)、分段线性聚集近似(piecewise linear aggregate approximation,PLAA)[33]等方法。其中,符号集合近似(SAX)是由Keogh E在分段累积近似(PAA)的基础上提出的一种有效的时间序列离散化降维方法,因其计算简单且高效、支持下界函数、算法不依赖于具体试验数据等特点而得到越来越多的关注,一经提出,便成为一种非常受欢迎的时间序列降维表示法[30-31,34-36]。IC卡记录刷卡时间精确到秒,轨道交通站点进站或出站的刷卡数据形成的一日时间序列维数达到上万,引入SAX方法可以有效地对IC卡刷卡时间序列实现降维,且能保留时间序列的主要形态,有助于挖掘轨道站点的时间序列中蕴藏的不同模式。
随着大数据挖掘及可视化技术日渐成熟,大数据逐渐应用到城市空间、城市等级体系及居民时空行为等研究领域[37],本文拟基于2013年北京市连续三周的IC卡轨道站点刷卡日客流量数据,对具有完整数据源的195个轨道站点,探讨利用IC卡进出站刷卡数据形成的时间序列,引入时间序列分析方法——SAX方法,对时间序列进行降维和相似性度量,研究轨道站点的分类问题。

2 数据与方法

2.1 数据描述

本文使用的轨道交通站点数据为2013年3月北京市1-20日无重大节假日的完整的出行(包含完整进出站刷卡记录)记录数共74 516 278条,轨道站点共208个。为了保证数据的质量,对采集到的数据进行清洗,去掉进出站刷卡记录不完整的站点,包括机场轨道站点T2航站楼、T3航站楼、三元桥j、东直门j、北京西、白碓子、丰台东大街、丰台科技园、丰台南路、科怡路、六里桥、六里桥东、七里庄。最终选择具有完整的进出站刷卡记录的轨道站点共195个作为研究对象,研究日常情况下轨道站点的分类问题。记录包含的基本信息如表1所示。
Tab. 1 Smart card data of some subway stations in Beijing on March 1st, 2013

表1 北京市部分地铁站点2013年3月1日刷卡数据

ID 进站名称 进站刷卡时间 出站名称 出站刷卡时间
10007510*****6142 长椿街 8:03:00 复兴门 8:10:26
10007510*****5723 苹果园 8:12:00 玉泉路 8:29:08
10007510*****2821 通州北苑 8:28:00 军事博物馆 9:25:23
10007510*****6032 和平门 9:36:00 五棵松 10:07:08
10007510*****5779 古城路 11:10:00 王府井 11:58:26

2.2 数据处理

每个轨道站点从每日的早4时到晚24时内进出站客流量数据按时间顺序形成了时间序列,由于IC卡记录刷卡时间精确到秒,因此一日的轨道交通站点进站或出站的刷卡数据形成的时间序列长度为72 000,通常又被称为时间序列的维数[38],大数据带来大样本的同时,也带来了维数灾难,维数膨胀给高维数据中模式识别和规则发现带来极大挑 战[38],如果直接对其进行分析将会带来巨大的计算资源耗费,且不利于发现数据间的内部关系[39]。本文通过PAA[29]方法实现对轨道站点时间序列降维,窗口间隔为3600,把原始时间序列的维数由72000降维到72 000÷3600=20。
图1是安定门工作日及休息日进站客流量分布图。从图1可以看出,周一到周五的日客流量分布特征基本相似,具有相同的双高峰时段和平峰时段,而周六到周日的日客流量分布特征也基本相似,从早8:00到晚8:00客流量比较平稳。因此,把进站数据集分为工作日进站和休息日进站2类数据集来描述轨道站点进站的客流量分布特征。根据各站点的日出站客流量分布也可以得出相同结论,出站数据集可以分为工作日出站和休息日出站2类数据集来描述出站的客流量分布特征。图2是天通苑的工作日休息日进站和出站的日客流量分布图,可以看出其工作日进出站高峰时段完全不同,工作日进站高峰发生在早上上班时段,工作日出站高峰发生在下午下班时段,休息日高峰时段也是有差异的,这说明各个站点工作日休息日的进出站日客流量分布是有区别的,因此轨道站点的日客流量分布特征可以使用工作日进站数据集(WB)、工作日出站数据集(WA)、休息日进站数据集(RB)和休息日出站数据集(RA)共4个数据集来描述。
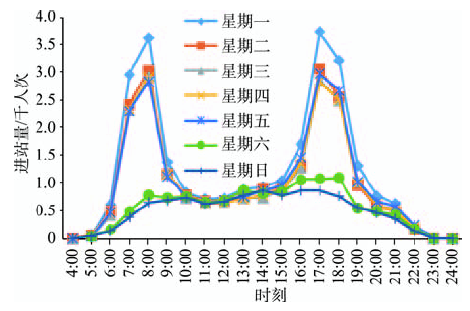
Fig. 1 Distribution of daily passenger boarding volume at AN DING MEN on weekdays and weekends

图1 安定门工作日休息日进站日客流量分布

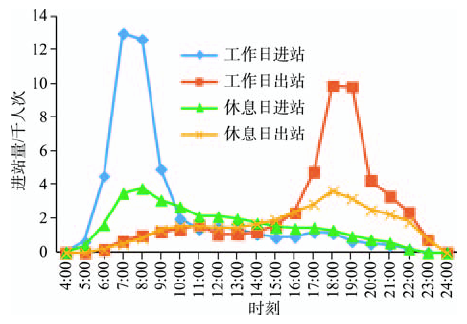
Fig. 2 Distribution of daily passenger boarding and alighting volume at TIAN TONG YUAN on weekdays and weekends

图2 天通苑工作日休息日进出站日客流量分布

2.3 SAX方法

SAX[31,40]是由Keogh E在分段累积近似(PAA)的基础上提出的一种有效的时间序列离散化降维方法,在时间序列相似性度量的研究中作为变换函数有着非常多的优点[30-31,34-36],如具有较高的压缩率,保留了数据的局部信息,有效地实现了数据降维,解决了维数过高引起的问题;对噪声数据有较高的承受能力。分段过程既实现了消除噪声又实现了数据平滑处理,视觉直观简洁,具有多分辨率特性等优点,因此成为一种非常受欢迎的时间序列降维表示法,在时间序列挖掘的诸多领域都有广泛的应用。
2.3.1 符号化表示
SAX把一条任意长度为m的时间序列转换成一个长度为n的(n<<m)符号串,n是分段后子序列的数目。已知时间序列 X = { x 1 , x 2 , , x m } ,SAX的实现过程可分为以下3步:
(1)正规化。把原始时间序列X按式(1)标准化为均值为0方差为1的序列 X = { x 1 , x 2 , , x m } 。此标准化不会改变原始序列X的形状和尺度[41]
x i = x i - u x σ x (1)
式中: x i 是序列X中的某一时刻的观测值; u x 是序列X中所有观测值的平均值; σ x 是序列X所有观测值的标准差。
(2)PAA降维。利用PAA方法,按子序列长度为w把长度为m的时间序列划分为长度为n的序列 X ̅ = { x ̅ 1 , x ̅ 2 , , x ̅ n } ,并根据式(2)计算出每一段子序列的均值。
x ̅ j = n m i = m n ( j - 1 ) + 1 m n j x i (2)
(3)符号化表示。由于序列 X ̅ 近似服从高斯分布,可以将其划分为 α 个等概率的区间,划分区间系列分裂点 β i 是按照表2来取值,位于同一区间的序列值用相同的符号表示,最终得到其符号化表示 X ˜ = { x 1 ˜ , x 2 ˜ , , x n ˜ } 图3是安定门工作日进站客流量时间序列的SAX表示,原始时间序列长度为72 000,窗口间隔为3600,使用PAA方法降维后的时间序列长度为20,将其划分为 α = 6 个等概率区间,划分区间系列分裂点 β i 的值分别为-0.97、-0.43、0、0.43、0.97,最终得其符号化序列表示为AABEFDCCBCCCDFFDBBBA。
Tab. 2 DB index of two clustering methods

表2 2种方法聚类的DB指数表[40]

方法 分类个数
6 7 8 9 10
SAX 1.27 1.30 1.26 1.26 1.29
欧式距离 1.39 1.50 1.38 1.37 1.36
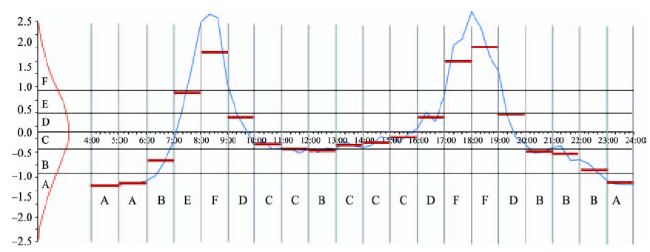
Fig. 3 SAX representation of distribution of passenger boarding volume at AN DING MEN on weekdays

图3 安定门工作日进站客流量时间序列的SAX表示

2.3.2 相似性度量方法
时间序列长度为m的任意2个时间序列Q={ q 1 , q 2 , , q m }和 C = { c 1 , c 2 , , c m } ,使用SAX方法得到长度为n的符号化序列表示分别为 Q ˜ = { q 1 ˜ , q 2 ˜ , , q n ˜ } C ˜ = { c 1 ˜ , c 2 ˜ , , c n ˜ } 。为了对符号化序列进行聚类,首先需要计算各符号化序列之间的相似性,SAX方法里采用式(3)[40]来计算序列 Q ˜ C ˜ 之间的距离值,以此表示它们之间的相似度。其中, dist ( q ˜ i - c ˜ i ) 表示2个符号之间的距离值,其计算方法按照文献[40]表3来计算。
MINDIST ( Q ˜ , C ˜ ) = m n i = 1 n ( dist ( q ˜ i - c ˜ i ) ) 2 (3)
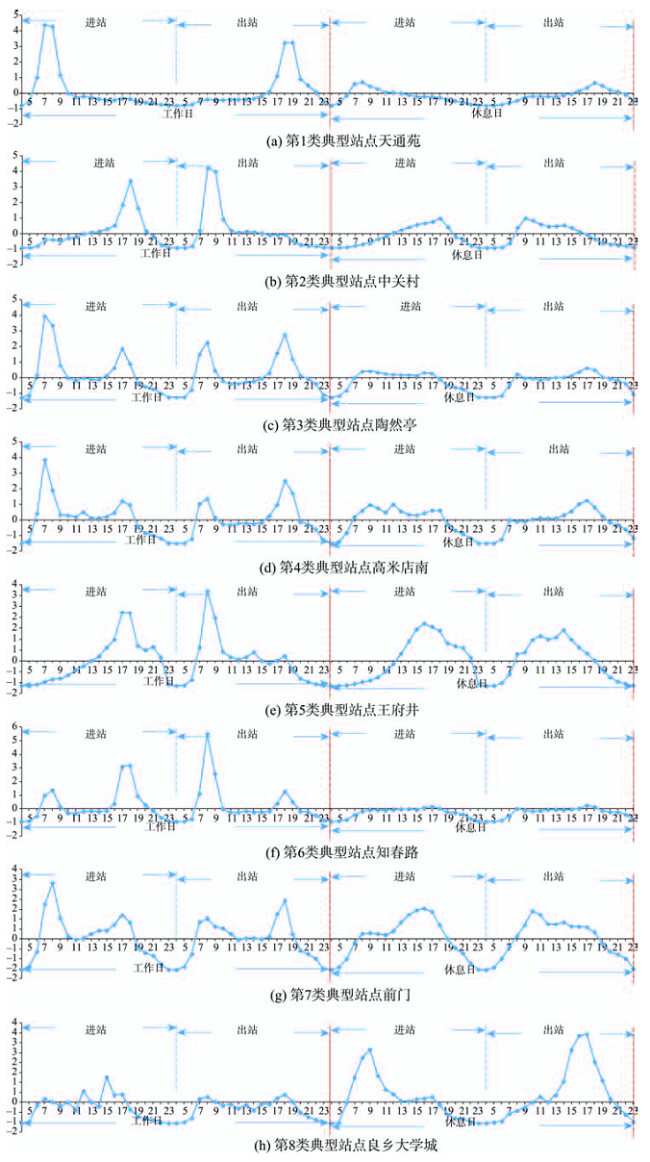
Tab. 3 The time distribution features of eight types of subway stations

表3 8类轨道站点的曲线特征

类别 工作日曲线特征 休息日曲线特征
进站 出站 进站 出站
峰值及时间 峰值个数 峰值及时间 峰值个数 峰值及时间 峰值个数 峰值及时间 峰值个数
1 4.53 7:00 1 3.33 18:00 1 0.74 8:00 1 0.82 18:00 1
2 3.04 18:00 1 5.45 8:00 1 0.26 17:00 1 0.31 8:00 1
3 4.27 7:00
0.96 17:00
2 1.26 8:00
3.20 18:00
2 0.58 8:00
0.13 17:00
2 -0.12 8:00
0.68 18:00
2
4 3.82 8:00
0.68 18:00
2 0.58 8:00
2.90 18:00
2 0.74 9:00
0.65 16:00
2 0.47 11:00
1.15 17:00
2
5 1.49 17:00
-0.11 21:00
2 1.93 8:00
0.07 13:00
0.23 18:00
3 2.34 16:00 1 2.05 10:00
1.66 14:00
2
6 2.27 8:00
2.56 17:00
2 4.43 8:00
2.07 18:00
2 0.14 9:00
0.30 15:00
2 0.22 8:00
0.34 17:00
2
7 1.42 8:00
2.47 17:00
2 3.60 8:00
1.65 18:00
2 0.08 10:00
0.95 16:00
2 0.80 8:00
0.37 13:00
0.49 17:00
3
8 0.10 7:00
-0.33 10:00
0.31 12:00
0.50 15:00
4 0.88 8:00
-0.15 11:00
-0.22 13:00
-0.16 15:00
0.41 18:00
5 1.20 9:00
0.78 12:00
1.11 17:00
3 0.68 11:00
2.66 17:00
2

2.4 层次聚类方法[41]

层次聚类(Hierarchical Clustering)通过计算不同类别数据点间的相似度来创建一棵有层次的嵌套聚类树。在聚类树中,不同类别的原始数据点是树的最低层,树的顶层是一个聚类的根节点。创建聚类树有自下而上凝聚和自上而下分裂2种方法。凝聚型层次聚类的算法是通过计算每一个类别的数据点与所有数据点之间的距离来确定它们之间的相似性,距离越小,相似度越高,并将距离最近的2个数据点或类别进行组合,生成聚类树。本文采用的是凝聚型层次聚类,数据点之间的相似性采用式(3)实现,最终的聚类个数根据DB指标[42]确定。

3 结果分析

3.1 聚类结果

针对北京195个轨道站点,每个站点的日客流特征使用4个数据集描述,采用Matlab编程实现SAX方法和相似性度量,采用层次聚类对轨道交通站点分类,并根据DB指标[42]从聚类个数为6-10类中选择DB指数最小的值对应的8类,作为最优的聚类个数。8类结果如表4所示,8个类别的站点工作日休息日进出站分时段客流量分布特征曲线如图4(a)-(h)所示。
Tab. 4 Eight clusters of hierarchical clustering

表4 层次聚类8类结果类

类别 站点数量 站点名称
1 41 八里桥 北宫门 草房 常营 传媒大学 次渠 次渠南 褡裢坡 稻田 俸伯 巩华城 管庄 广阳城 果园 黄村火车站 黄渠 回龙观 回龙观东大街 霍营 旧宫 梨园 良乡大学城西 临河里 龙泽 苹果园 沙河 沙河高教园 生命科学园 石门 天通苑 天通苑北 天通苑南 通州北苑 土桥 西红门 西苑 小红门 新宫 育新 枣园 朱辛庄
2 39 白石桥南 朝阳门 车公庄 车公庄西 磁器口 大望路 大钟寺 灯市口 东大桥 东单 东四十条 阜成门 复兴门 高碑店 国贸 海淀黄庄 呼家楼 惠新西街北口 建国门 金台夕照 亮马桥 灵镜胡同 柳芳 木樨地 南礼士路 荣京东街 三元桥 苏州街 团结湖 万源街 五道口 西二旗 西土城 宣武门 雍和宫 永安里 张自忠路 知春里 中关村
3 34 安和桥北 八宝山 八角游乐园 北苑 慈寿寺 崔各庄 高米店北 公益西桥 古城路 海淀五路居 后沙峪 花梨坎 角门西 劲松 九棵树 立水桥 立水桥南 林萃桥 刘家窑 马家堡 南法信 蒲黄榆 青年路 十里堡 双桥 四惠东 宋家庄 孙河 陶然亭 同济南路 亦庄桥 亦庄文化园 永泰庄 玉泉路
4 14 高米店南 黄村西大街 篱笆房 良乡南关 马泉营 南邵 清源路 顺义 苏庄 天宫院 肖村 义和庄 圆明园 长阳
5 10 奥林匹克公园 奥体中心 北海北 动物园 南锣鼓巷 森林公园南门 天安门东 天安门西 王府井 西单
6 33 安定门 安华桥 安贞门 北土城 北苑路北 菜市口 大葆台 大屯路东 鼓楼大街 光熙门 和平里北街 和平门 和平西桥 花园桥 惠新西街南口 健德门 金台路 经海路 牡丹园 荣昌东街 上地 芍药居 生物医药基地 双井 四惠 太阳宫 万寿路 望京 望京西 五棵松 西小口 长椿街 知春路
7 22 巴沟 北京大学东门 北京南站 北京站 北新桥 崇文门 东四 东直门 郭公庄 国家图书馆 国展 积水潭 军事博物馆 农业展览馆 平安里 前门 人民大学 天坛东门 魏公村 西四 西直门 新街口
8 2 良乡大学城 良乡大学城北
Fig. 4 Time distribution of passenger boarding and alighting volume of eight types of stations on weekdays and weekends

图4 8类典型站点工作日休息日进出站分时段客流量分布

3.2 聚类有效性指标

DB 指标[42]是基于样本的类内散度与各聚类中心间距的测度,进行类数估计时其最小值对应的类数作为最优的聚类个数。表2是采用SAX方法和欧式距离2种方法对时间序列的相似性进行度量,使用层次聚类聚6~10类,计算其各自的聚类有效性DB指标。从表2可以得出,SAX方法的DB值更小,说明使用SAX方法进行相似性度量,其聚类质量更好。结合图4(a)-(h)的曲线特征,也进一步证明了SAX方法的合理性。

3.3 类别特征分析和空间分布分析

首先按照工作日进站、出站和休息日进站、出站对8类聚类结果求平均值,得到每类站点工作日进站、出站和休息日进站、出站对应的4条时间序列;然后分别对每类时间序列求其峰值、对应的时间以及峰值个数。判断峰值的方法为每类聚类结果的平均值序列中某一元素的值比相邻2个元素的值都大且峰值的最小高度大于此类序列的平均值。8类轨道站点的曲线特征描述见表3。结合 图4(a)-(h)和表3,每类站点的类别特征分析描述 如下:
第1类站点工作日进出站日客流时间分布呈单峰型,进出站客流高峰时间较为集中,在时间上具有明显的潮汐性,早高峰以进站客流为主且发生在上班时间,晚高峰以出站客流为主且发生在下班时间,早晚峰值平均值比较大。休息日和工作日类似,但高峰客流量远低于工作日。命名为居住型站点。例如,天通苑、回龙观就是典型的居住型站点,站点的主要功能是为上班人群提供交通职能。
第2类站点工作日进出站客流时间分布呈单峰型,进出站客流高峰时间较为集中,在时间上具有明显的潮汐性,但和1类相反,早高峰以出站客流为主且发生在上班时间,晚高峰以进站客流为主且发生在下班时间,早晚峰值平均值比较大。休息日和工作日类似,但高峰客流量远低于工作日。命名为办公型站点。例如,复兴门、中关村和西二旗等是典型的办公型站点。
第3类站点工作日进出站客流时间分布呈双峰型,进出站客流高峰时间较为集中,发生在上、下班时间,但进站客流早高峰大于晚高峰、出站客流早高峰低于晚高峰,且进站客流早高峰大于出站客流早高峰、进站客流晚高峰低于出站客流晚高峰,进出站早晚峰值低于第1类和第2类。休息日和工作日类似,但高峰客流量远低于工作日且整体客流量相对平缓。命名为居住与办公混合型但偏居住型站点。典型的站点有陶然亭、立水桥和四惠东等,此类站点周围既有居民区又有办公区,但居民区的功能比重大于办公区。
第4类工作日进站客流时间分布呈双峰型,和第3类类似,但休息日高峰客流量整体比第3类大且相对平缓,休息日进站早高峰比第3类延迟1 h、晚高峰提前1 h,休息日出站早高峰推迟3 h,晚高峰提前1 h。此类站点周边既有居住地又有办公地,在此居住的居民,工作地可能在其它地点,也有部分人居住在别处,但在此类站点附近工作,表现出职住错位。命名为错位型站点。
第5类站点工作日客流时间分布进站呈双峰型,时间分别为下午17:00和晚上21:00,出站呈三峰型,时间分别为上午8:00、中午13:00和下午18:00。相比于第3、4类,进站晚高峰时间段长,出站高峰多了中午时段。休息日进站客流时间分布呈单峰,和第2类相比,差异比较大,中午12:00后以进站客流为主,且在下午15:00-16:00达到最大值,之后下降;休息日出站客流时间分布呈双峰型,和第3、4类相比从上午8:00之后以出站客流为主一直持续到晚上19:00,且峰值出现在10:00和14:00。命名为景区及商业型站点。例如,王府井、天安门东、奥林匹克公园等站点。
第6类站点工作日进出站客流时间分布呈双峰型,进出站客流高峰时间较为集中,发生在上、下班时间,但进站客流早高峰略低于晚高峰、出站客流早高峰高于晚高峰,且进站客流早高峰低于出站客流早高峰、进站客流晚高峰高于出站客流晚高峰,与第3类相反,进出站早晚峰值低于第1类和第2类。休息日和工作日类似,但高峰客流量远低于工作日且整体客流量相对平缓。命名为居住与办公混合但偏办公型站点。典型的站点有知春路、上地和生物医药基地等,此类站点周围既有居民区又有办公区,但居民区的功能比重小于办公区。
第7类站点工作日进出站客流时间分布呈双峰型,与第6类相似,但出站早高峰时段一直到12:00,推迟了2 h,进站晚高峰时段从中午12:00开始,提前了3 h。休息日进站日客流量呈双峰,但峰值出现在上午10:00和下午16:00,比第5类峰值出现早且高峰开始时段提前了4 h,出站日客流量呈三峰,与第5类工作日出站相似。命名为综合型站点。典型站点如前门、北京站、西直门站点,此类站点周围用地类型具有多样性特点。
第8类站点工作日进出站客流时间分布分别呈四峰和五峰,工作日进站呈三峰,出站呈双峰型,波动性比较大,命名为其它类型。
各类轨道站点在空间分布的位置如图5所示。从图5可以看出,第1类居住型站点和第4类错位型站点多数分布在地铁最远端,如昌平区、顺义区、大兴区、通州区和朝阳区与通州区交界处,这些区是人口居住密集的地区。不同的是,居住型站点更多集中在昌平区、顺义区、通州区和朝阳区,而错位型站点更多集中在大兴区和房山区,这和大兴区为北京经济技术开发区有一定的关系,一方面有居住其它地方的居民到这里工作,另一方面居住此地的居民工作地点在别处。第2类办公类类型站点、第5类景区及商业类站点、第6类居住型与办公型混合但偏办公型站点和第7类综合型站点大部分集中在市区。第3类居住型与办公型混合但偏居住型站点围绕市中心分散在周围;第8类站点其它类型的站点波动性大,休息日客流量远远大于工作日,这和周围是大学城有一定的关系,学生工作日在学校上课,周末外出频繁。
Fig. 5 Space distribution of subway stations types

图5 轨道站点类型空间分布图

4 结论与讨论

本文使用北京IC卡轨道站点刷卡数据形成的日客流量时间序列对轨道交通站点分类进行了研究。
首先,根据北京IC卡每个站点工作日及休息日进出站客流量分布图的特征不同,提出了描述轨道站点的4个数据集,即工作日进站数据集(WB)、工作日出站数据集(WA)、休息日进站数据集(RB)和休息日出站数据集(RA)。在此基础上,得到的聚类结果表明从这4个角度刻画站点日客流量特征的有 效性。
其次,使用时间序列分析方法对轨道站点分类进行研究,首次引入符号集合近似(SAX)方法,对轨道站点日客流量形成的高维时间序列实现了高效的降维和相似性度量,通过在实际数据集上和欧式距离相似性度量方法的实验对比,证明了SAX方法的有效性,为轨道站点的分类研究提供了新思路。
再次,采用层次聚类方法并根据聚类有效性DB指数确定将195个站点分为8类更为合理,分别为居住类型、办公类型、居住与办公混合型但偏居住型、错位型、景区及商业型、居住与办公混合但偏办公型、综合型和其它型。
最后,结合8类站点的空间分布,发现居住型和错位型站点多数分布在地铁最远端,而办公型、景区及商业型、居住与办公混合型但偏办公型和综合型站点大部分集中在市区,居住与办公混合型但偏居住型站点围绕市中心分散在周围,其结果有助于解读城市的不同功能分区及其所体现的居民出行行为特征,对理解城市空间格局及其演化过程提供了一定的依据。
今后将从以下2个方面开展后续研究:①随着轨道交通线路的建设,轨道交通出行比例较前几年有了很大的上升,因此将通过进一步获得北京轨道站点交通信息,得到更完善的北京各个轨道交通站点的出行信息;②由于城市的重大交通设施与空间结构之间存在互为基础、循环反馈的作用机制[43-44],将结合每个站点的空间维度信息和其它相关辅助信息,如站点周边土地利用情况及兴趣点等信息,实现对轨道站点进行更加准确地分类,为研究城市功能和轨道交通站点规划设计和管理服务提供更准确的科学依据。

The authors have declared that no competing interests exist.

[1]
北京交通发展研究中心.2013年北京市交通发展年度报告[R].北京:北京交通发展研究中心,2013.

[ Beijing Transportation Research Center. Beijing transportation annual report 2013[R]. Beijing: Beijing Transportation Research Center, 2013 ]

[2]
段德罡,张凡.土地利用优化视角下的城市轨道站点分类研究——以西安地铁2号线为例[J].城市规划,2013,37(9):39-45.以站点周边不同交通接驳(主要指步行、自行车接驳)时间距离为路径,基于GIS研究确定轨道站点对周边地区的一般影响范围,并从城市设计角度对地块边界进行修订,划定轨道站点对周边用地的合理影响范围;基于影响区域内用地功能特征,定量计算各站点的用地优势度和用地均匀度指数.综合考虑站点的区域特征和交通功能,采用定性、定量相结合的分析方法,对城市轨道交通站点进行类型划分,以科学合理地指导轨道交通站点周边土地利用优化调整,同时为后续城市轨道交通站点周边的土地利用规划和设计标准制定提供参考依据.

[ Duan D G, Zhang F.Study on classification of urban rail transit stations from the perspective of land use optimization: A case study on Xi′an subway line 2[J]. City Planning Review, 2013,37(9):39-45. ]

[3]
Korf J L,Demetsky MJ. Analysis of rapid transit access mode choice. Transportation research record.1981,817:29-35.The application of the logit modeling methodology to the development of rapid transit access-mode-choice models that are transferable among different stations in a system is described. Rapid transit stations are classified into groups by using discriminant analysis to test for common behavior at sites within groups and to verify differences in behavior among groups. Eighteen variables are used to define the physical nature and accessibility of the terminal and the socioeconomic structure of the surrounding area. Five station groups are identified: (a) central city; (b) dense residential; (c) predominantly residential, some commercial; (d) predominantly commercial, some residential; and (e) sparse residential and undeveloped land. Multinomial logit access-mode-choice models are described for the different station groups in the Bay Area Rapid Transit system. The modes considered are drive alone, kiss-and-ride, bus, carpool, and walk. An areawide model is compared with the station group models. The results show that models for classified station groups have coefficients that differ from each other and from a model calibrated with the data for all stations in all groups. These models, however, do not offer sufficient uniqueness to justify recommendations. More precise, detailed calibration data are needed to establish transferable models. (Author)

[4]
Bates Jr EG.A study of passenger transfer facilities(abridgment)[J]. Transportation research record, 1978,662:23-25.Throughout the country, a considerable effort is being made to improve public transit. However, one element of the total transit system which has not been studied at any level of detail and which has not improved to any great extent is the passenger transfer facility. The success of transit is going to depend on improvements made to all segments of the system, including safe, convenient transfer facilities. This study includes an inventory of facilities in some larger communities in New England, and a classification of facilities by size of area served and extent of system. According to an attitude survey, transit operators see a need for improved transfer facilities, minimized transfer times, and provision of shelters. The survey showed that pulsating systems had the highest number of transfers, averaging 27 percent; while transfers on non-pulsating systems generally averaged about 6 percent. The study concludes that transfer facilities must be improved to make transit more efficient and to encourage usage. /Author/

[5]
谢屾. 城市轨道交通站点周边空间形态整合浅析:以南京为例[D].南京:南京大学,2011.

[ Xie S.Study on morphological integration of space surrounding urban rail transit stations: A case study of Nanjing[D]. Nanjing: Nanjing University, 2011. ]

[6]
龚晓芳. 现代城市轨道交通站点地区规划研究[D].西安:长安大学,2009.

[ Gong X F.The planning research of metro rail transit station in modern city[D]. Xi′an: Chang′an University, 2009. ]

[7]
吴娇蓉,毕艳祥,傅博峰.基于郊区轨道交通站点分类的客流特征和换乘系统优先级分析[J].城市轨道交通研究,2007,10(11): 23-28.结合大量实地调研数据,按照站点区位条件、站点周边地区土地利用性质、开发规模和强度等数 据,将郊区轨道交通站点划分为七大类。基于郊区轨道交通站点分类,结合轨道交通站点客流调查数据分析了客流时间分布规律,出行目的、换乘方式、合理交通区 域特征指标。提出基于轨道交通站点分类的换乘系统优先级规划要求。

DOI

[ Wu J R, Bi Y X, Fu B F.Characteristics of in passenger different suburban rail stations and the priority of transfer system[J]. Urban Mass Transit, 2007,10(11):23-28. ]

[8]
傅搏峰,吴娇蓉,陈小鸿.郊区轨道站点分类方法研究[J].铁道学报,2008,30(6):19-23.运用步行接驳客流聚集效应函数曲线,界定郊区轨道站点影响范围; 基于影响区域内土地使用性质,引入景观生态学中景观优势度概念,定义并计算各类用地的优势度指数.综合考虑站点的交通功能与场所特征,采用定性与定量分析 相结合的方法,对郊区轨道站点进行类别划分.研究成果应用于上海申通地铁股份有限公司2012年上海轨道交通基本线网设计.将郊区轨道站点分为"7大类 11小类"的分类方法,可以为大都市郊区轨道站的规划和制定设计标准提供参考.

DOI

[ Fu B F, Wu J R, Chen X H.Method of classification of suburban rail transit station sites[J]. Journal of the China Railway Society, 2008,30(6):19-23. ]

[9]
余丽洁,李岩,陈宽民.基于谱聚类的城市轨道站点分类方法[J].交通信息与安全,2014,32(1):122-125,129.为明确城市轨道站点的功能与定位,以对站点的设计与建设提供指 导,建立了基于谱聚类算法的城市轨道站点分类方法。在确立影响轨道站点属性因素参数的基础上,应用西安地铁2号线现状及规划特征年的数据分别对快速聚类法 及非规格化谱聚类算法、SM 算法、NJW 算法等谱聚类算法的站点分类效果进行评述。结果显示谱聚类算法中的 NJW 算法,能够抓住站点的特征进行分类,且能准确反映随着轨道线网和城市发展,站点特性的变化。

DOI

[ Yu L J, Li Y, Chen K M.Using spectral clustering for urban rail station classification[J]. Journal of Transport Information and Safety, 2014,32(1):122-125,129. ]

[10]
马小毅,金安,刘明敏,等.广州市轨道交通客流特征分析[J].城市交通,2013,11(6):35-42.科学合理的预测轨道交通客流状况已成为轨道交通系统决策中面临的重大课题,需要在实践中不断积累、完善和提高。根据广州市轨道交通运营资料,从网络、线路、车站三个层面探讨轨道交通从单线向网络转变过程中的客流特征和成长规律,为客流预测模型的参数选择提供参考。分析发现:随着轨道交通网络的扩展,客运强度边际效应递减、换乘系数增大、平均运距增长;从线到网,换乘客流成为客流增长的主要来源;不同类型车站的客流特征差异较大,预测时应分类考虑。

DOI

[ Ma X Y, Jin A, Liu M M, et al. Rail transit passenger flow characteristics in guangzhou[J].Urban Transport of China, 2013,11(6):35-42. ]

[11]
王静,刘剑锋,马毅林,等.北京市轨道交通车站客流时空分布特征.城市交通,2013,11(6):18-27.轨道交通线网客流特征实质上是车站客流时空分布叠加及交换的效果体现,通过分析车站客流的波动性,发现北京轨道交通系统在不同时间维度和区域范围均呈现出明显的不均衡特征。针对车站特点进行聚类分析,归纳出周边不同用地类型的车站客流时空分布差异性特征规律,并进一步分析了进站客流和换乘站客流特征以及进出站客流接驳特征。在此基础上,对北京市轨道交通发展提出应建立多层次的轨道交通系统和多样化的轨道交通运营组织方式;重视换乘站在网络中的合理布局,改进换乘站设计与运行组织;结合车站区位特征制定差异化接驳服务等建议。

DOI

[ Wang J, Liu J F, Ma Y L, et al. Temporal and spatial passenger flow distribution characteristics at rail transit stations in beijing[J]. Urban Transport of China, 2013,11(6):18-27. ]

[12]
谭啸. 天津城市轨道交通站点周边土地利用优化研究[D].天津:天津大学,2012.

[ Tan X.Study on optimization of land-use surrounding the urban rail station in Tianjin[D]. Tianjin: Tianjin University, 2012. ]

[13]
龙瀛,张宇,崔承印.利用公交刷卡数据分析北京职住关系和通勤出行[J].地理学报,2012,67(10):1339-1352.基于位置服务(Location Based Service, LBS) 技术为研究城市系统的时空动态规律提供了新的视角, 已往多基于移动通讯(GSM)、全球定位系统(GPS)、社会化网络(SNS) 和无线宽带热点(Wi-Fi) 数据开展研究, 但少有研究利用公交IC 卡刷卡数据进行城市系统分析。普遍存在的LBS数据虽然具有丰富的时间和空间信息, 但缺乏社会维度信息, 使其应用范围受到一定限制。本文基于2008 年北京市连续一周的公交IC 卡(Smart Card Data, SCD) 刷卡数据, 结合2005 年居民出行调查、地块级别的土地利用图, 识别公交持卡人的居住地、就业地和通勤出行, 并将识别结果在公交站点和交通分析小区(TAZ) 尺度上汇总:① 将识别的通勤出行分别从通勤时间和距离角度, 与居民出行调查数据和其他已有北京相关研究进行对比, 显示较好的吻合性;② 对来自3 大典型居住区和去往6 大典型办公区的通勤出行进行可视化并对比分析;③ 对全市基于公交的通勤出行进行可视化, 并识别主要交通流方向。本研究初步提出了从传统的居民出行调查和城市GIS 数据建立规则, 用于SCD数据挖掘的方法, 具有较好的可靠性。

DOI

[ Long Y, Zhang Y, Cui C Y.Identifying commuting pattern of beijing using bus smart card data[J]. Acta Geographica Sinica, 2012,67(10):1339-1352. ]

[14]
Ali A, Kim J, Lee S.Travel behavior analysis using smart card data[J]. KSCE Journal of Civil Engineering, 2016,20(4):1532-1539.Electronic fare payment systems have gained much popularity in large public transport systems across the world. Though their main purpose is to collect the revenue and improve passenger鈥檚 comfort, they also generate huge amount of detailed and accurate data on onboard transactions which is of extreme importance for transit planners for efficient short-term and long-term transit operation and service planning. This paper attempts to utilize the smart card data as an input for large-scale activity based public transport simulation for analyzing travel behavior pertaining to transit users, using an open source agent-based transport simulation package, MATSim. Transit vehicles are optimized based on input demand generated by smart card and a high temporal resolution of waiting time and its components at different stations is extracted which is very important in managing the frequency and headway of transit vehicles. Since no card swipe is needed for transfers within subway system in Seoul, the data is not readily available to detect frequent transfer locations. However, after validating the boarding and alighting volumes at different stations, a methodology is presented to calculate within subway transfer volumes at different stations. We suggest that by improving the statistical analysis and utilizing advanced data mining techniques, smart cards can effectively generate the microsimulation travel demand models. 漏 2015 Korean Society of Civil Engineers and Springer-Verlag Berlin Heidelberg

DOI

[15]
Gitanjali J.Data mining from smart card data using data clustering[J]. International Journal of Applied Engineering Research, 2016,11(1):347-352.

[16]
Long Y, Thill J C.Combining smart card data and household travel survey to analyze jobs-housing relationships in Beijing[J]. Computers, Environment and Urban Systems, 2015,53:19-35.Location Based Services (LBS) provide a new perspective for spatiotemporally analyzing dynamic urban systems. Research has investigated urban dynamics using LBS. However, less attention has been paid to the analysis of urban structure (especially commuting pattern) using smart card data (SCD), which are widely available in most large cities in China, and even in the world. This paper combines bus SCD for a one-week period with a oneday household travel survey, as well as a parcel-level land use map to identify job鈥揾ousing locations and commuting trip routes in Beijing. Two data forms are proposed, one for jobs鈥揾ousing identification and the other for commuting trip route identification. The results of the identification are aggregated in the bus stop and traffic analysis zone (TAZ) scales, respectively. Particularly, commuting trips from three typical residential communities to six main business zones are mapped and compared to analyze commuting patterns in Beijing. The identified commuting trips are validated by comparison with those from the survey in terms of commuting time and distance, and the positive validation results prove the applicability of our approach. Our experiment, as a first step toward enriching LBS data using conventional survey and urban GIS data, can obtain solid identification results based on rules extracted from existing surveys or censuses.

DOI

[17]
Joh C, Hwang C.Time-geographic analysis of trip trajectories and land use characteristics in Seoul metropolitan area by using multidimensional sequence alignment and spatial analysis[C]. 2010 AAG Annual Meeting, Washington, DC, 2010.

[18]
Jang W.Travel time and transfer analysis using transit smart card data[J]. Transportation Research Record: Journal of the Transportation Research Board, 2010,2144(1):142-149.Automatic fare collection systems using smart card technology have become popular because they provide an efficient and cost-saving alternative to the manual fare collection method. In 2004, the City of Seoul, South Korea, introduced a smart card-based transit fare scheme, which was a distance-based, integrated fare collection and calculation system. Over the years, the system was extended twice and now can provide detailed information about public transit use in the region. This information includes each trip鈥檚 boarding and alighting times and locations, as well as the connected trip chains with transfers. This paper examines possibilities for using such data for transportation planning application. First, a process to generate a travel time map is presented. For this, more than 100 million trip data are used to estimate travel times among stops. It is also demonstrated that transfer data can be readily obtainable because the on- and off-boarding information reside in the data set. Although transfers are considered to be important information for public transit planning, it has not been easy to collect such information. This study illustrates that transfer data can be used to locate the critical transfer points that need improvement. It is also demonstrated that a simple data query can quickly identify these locations. In addition, transfer trip patterns between two zones are analyzed, which provides meaningful information about passengers鈥 transfer location choice.

DOI

[19]
Bagchi M, White P R.Use of public transports smart card data for understanding travel behavior[C]. Proceedings of the European Transport Conference, Strasbourg, 2003.

[20]
Roth C, Kang S M, Batty M, et al. Structure of urban movements: polycentric activity and entangled hierarchical flows[J]. PloS one,2011,6(1):e15923.

[21]
Ma X, Wu Y J, Wang Y, et al. Mining smart card data for transit riders’ travel patterns[J].Transportation Research Part C: Emerging Technologies, 2013,36:1-12.To mitigate the congestion caused by the ever increasing number of privately owned automobiles, public transit is highly promoted by transportation agencies worldwide. A better understanding of travel patterns and regularity at the "magnitude" level will enable transit authorities to evaluate the services they offer, adjust marketing strategies, retain loyal customers and improve overall transit performance. However, it is fairly challenging to identify travel patterns for individual transit riders in a large dataset. This paper proposes an efficient and effective data-mining procedure that models the travel patterns of transit riders in Beijing, China. Transit riders' trip chains are identified based on the temporal and spatial characteristics of their smart card transaction data. The Density-based Spatial Clustering of Applications with Noise (DBSCAN) algorithm then analyzes the identified trip chains to detect transit riders' historical travel patternsand the K-Means++ clustering algorithm and the rough-set theory are jointly applied to cluster and classify travel pattern regularities. The performance of the rough-set-based algorithm is compared with those of other prevailing classification algorithms. The results indicate that the proposed rough-set-based algorithm outperforms other commonly used data-mining algorithms in terms of accuracy and efficiency.

DOI

[22]
尹芹,孟斌,张丽英.基于客流特征的北京地铁站点类型识别[J].地理科学进展,2016,35(1):126-134.地铁站点是城市各种社会经济活动的关键节点,不同类型的地铁站点在城市中的区域条件、交通功能、土地利用类型等方面均存在差异,科学的站点分类有助于了解城市功能分区及评价轨道交通基础设施建设状况.本文基于2013年3月份14天工作日地铁刷卡客流量数据,运用引入客流特征的时间序列聚类方法,对北京市195个地铁站点进行分类.研究表明:①地铁站点客流量存在时空差异,也是城市功能分区时空差异的表现之一.②通过引入客流特征的时间序列方法,将地铁站点分为居住导向型、就业导向型、职住错位型、错位偏居住型、错位偏就业型、混合型、综合型及其他型8种不同类型.③利用地铁站点客流量数据,是将空间行为和实体空间进行关联比较的有效途径.

DOI

[ Yin Q, Meng B, Zhang L Y. 2016. Classification of subway stations in Beijing based on passenger flow characteristics[J].Progress In Geography,2016,35(1):126-134. ]

[23]
戴霄,陈学武,李文勇.公交IC卡信息处理的数据挖掘技术研究[J].交通与计算机,2006,24(1):40-42.主要探讨数据挖掘技术在公交IC卡信息处理方面的运用,设计了公交IC数据仓库结构,提出数据挖掘系统的框架.从公交运营决策者和公交规划者两个角度提出数据挖掘目标,并根据挖掘目标阐述数据分析过程及挖掘方法.

DOI

[ Dai X, Chen X W, Li W Y.Study of data mining technique for bus intelligent card data processing[J]. Computer and Communications, 2006,24(1):40-42. ]

[24]
杨智伟,赵骞,赵胜川,等. 基于公交IC卡数据信息的客流预测方法研究[J].交通标准化,2009(9):115-119.根据大连市公交IC卡的历史数据绘制公交线路客流曲线,采用有序聚类Fisher算法划分公交峰值区间,在具有典型特征的峰值区间内进行有针对性的公交客流调查,可得到实际客流数据样本。通过将3EIC卡客流数据与随车客流调查数据相结合,建立不同峰值条件下预测客流的回归方程,可实现对不同峰值区间内总体客流量的预测。

DOI

[ Yang Z W, Zhao Q, Zhao S C, et al. Passenger flow volume forecasting method based on public transitintelligent card (IC) survey data. Transport Standardization, 2009,9:115-119. ]

[25]
何晓旭. 时间序列数据挖掘若干关键问题研究[D].中国科学技术大学,2014.

[ He X X.Study on several key issues of time series data mining[D]. University of Science and Technology of China, 2014. ]

[26]
宋辞,裴韬.基于特征的时间序列聚类方法研究进展[J].地理科学进展,2012,31(10):1307-1317.时间序列聚类可以根据相似性将对象集分为不同的组, 从而反映出同组对象的相似性特征和不同组对象之间的差异特征。当序列维度较高时, 传统的时间序列聚类方法容易受噪声影响, 难以定义合适的相似性度量, 聚类结果往往意义不明确。当数据有缺失或不等长时, 聚类方法也难以实施。基于上述问题, 一些学者提出了基于特征的时间序列聚类方法, 不仅可以解决上述问题, 还可以发现序列本质特征的相似性。本文根据时间序列的不同特征, 综述了基于特征的时间序列聚类方法的研究进展, 并进行了分析和评述;最后对未来研究进行了展望。

DOI

[ Song C, Pei T.Research progress in time series clustering methods based on characteristics. Progress in Geography, 2012,31(10):1307-1317. ]

[27]
Faloutsos C, Ranganathan M, Manolopoulos Y.Fast subsequence matching in time-series databases[C]. Proceedings of the 1994 ACM SIGMOD International Conference on Management of Data, 1994.

[28]
Chan K P, Fu A C.Efficient time series matching by wavelets[C]. Proceedings - International Conference on Data Engineering, 1999:126-133.

[29]
Keogh E, Chakrabarti K, Pazzani M, et al. Locally adaptive dimensionality reduction for indexing large time series databases[J]. ACM SIGMOD Record, 2001,30(2):151-162.

[30]
Keogh E, Lin J, Fu A.Hot sax: Efficiently finding the most unusual time series subsequence[C]. Data mining,IEEE fifth international conference on, 2005:226-233.

[31]
Lin J, Keogh E, Wei L, et al. Experiencing SAX: a novel symbolic representation of time series[J]. Data Mining and knowledge discovery, 2007,15(2):107-144.<a name="Abs1"></a>Many high level representations of time series have been proposed for data mining, including Fourier transforms, wavelets, eigenwaves, piecewise polynomial models, etc. Many researchers have also considered symbolic representations of time series, noting that such representations would potentiality allow researchers to avail of the wealth of data structures and algorithms from the text processing and bioinformatics communities. While many symbolic representations of time series have been introduced over the past decades, they all suffer from two fatal flaws. First, the dimensionality of the symbolic representation is the same as the original data, and virtually all data mining algorithms scale poorly with dimensionality. Second, although distance measures can be defined on the symbolic approaches, these distance measures have little correlation with distance measures defined on the original time series. <div class="AbstractPara"> <div class="">In this work we formulate a new symbolic representation of time series. Our representation is unique in that it allows dimensionality/numerosity reduction, and it also allows distance measures to be defined on the symbolic approach that lower bound corresponding distance measures defined on the original series. As we shall demonstrate, this latter feature is particularly exciting because it allows one to run certain data mining algorithms on the efficiently manipulated symbolic representation, while producing identical results to the algorithms that operate on the original data. In particular, we will demonstrate the utility of our representation on various data mining tasks of clustering, classification, query by content, anomaly detection, motif discovery, and visualization.

DOI

[32]
Keogh E, Chakrabarti K, Pazzani M, et al. Dimensionality reduction for fast similarity search in large time series databases[J]. Knowledge and information Systems, 2001,3(3):263-286.<a name="Abs1"></a> The problem of similarity search in large time series databases has attracted much attention recently. It is a non-trivial problem because of the inherent high dimensionality of the data. The most promising solutions involve first performing dimensionality reduction on the data, and then indexing the reduced data with a spatial access method. Three major dimensionality reduction techniques have been proposed: Singular Value Decomposition (SVD), the Discrete Fourier transform (DFT), and more recently the Discrete Wavelet Transform (DWT). In this work we introduce a new dimensionality reduction technique which we call Piecewise Aggregate Approximation (PAA). We theoretically and empirically compare it to the other techniques and demonstrate its superiority. In addition to being competitive with or faster than the other methods, our approach has numerous other advantages. It is simple to understand and to implement, it allows more flexible distance measures, including weighted Euclidean queries, and the index can be built in linear time.

DOI

[33]
Hung N, Anh D.An improvement of PAA for dimensionality reduction in large time series databases[J]. PRICAI 2008: Trends in Artificial Intelligence, 2008,5351:698-707.Many dimensionality reduction techniques have been proposed for effective representation of time series data. Piecewise Aggregate Approximation (PAA) is one of the most popular methods for time series

DOI

[34]
Camerra A, Palpanas T, Shieh J, et al. iSAX 2.0: Indexing and mining one billion time series[C]. Data Mining (ICDM), 2010 IEEE 10th International Conference on, IEEE, 2010.

[35]
李桂玲,王元珍,杨林权,等.基于SAX的时间序列相似性度量方法[J].计算机应用研究,2012,29(3):893-896.符号化表示是一种有效的时间序列降维技术,其相似性度量是诸多挖掘任务的基础。基于SAX(sym-bolic aggregate approximation)的距离MINDIST_PAA_iSAX不满足对称性,在时间序列挖掘中具有局限性,提出了对称的度量Sym_PAA_SAX,且下界于欧拉距离。在真实数据集和合成数据集上的实验说明下界紧密性较好,相似搜索错报率较低。

DOI

[ Li G L,Wang Y Z,Yang L Q, et al. Research on similarity measure for time series based on SAX[J]. Application Research of Computers, 2012,29(3):893-896. ]

[36]
刘威,邵良杉,曾繁慧,等.基于SAX方法的股票时间序列数据相似性度量方法研究[J].计算机工程与科学,2009,31(9):115-118.特定数据集上高效的相似性度量方法是目前时间序列数据挖掘领域研究的重点内容之一。针对经过SAX方法降维后的股票数据在相似性度量中缺乏趋势变化的动态信息这一问题,本文提出了一种融合了点距离与模式距离优点的新型相似性度量函数——复合距离函数,并通过实证分析验证了该距离函数在相似性度量中的有效性,为揭示股票数据间相互依赖的规律以及时间序列相似性问题的进一步研究提供了新思路。

DOI

[ Liu W, Shao L S, Zeng F H, et al. Research on the stock time series data similarity based on sax[J].Computer Engineering&Science, 2009,31(9):115-118. ]

[37]
秦萧,甄峰,熊丽芳,等.大数据时代城市时空间行为研究方法[J].地理科学进展,2013,32(9):1352-1361.信息技术的快速发展带来了“大数据”时代的到来,改变了城市的空间组织和居民行为,并使得城市时空间行为研究方法面临变革。本文在总结传统城市时空间行为研究方法存在问题的基础上,对影响其变革的数据获取与处理技术进行梳理,重点从居民时空行为、城市空间及城市等级体系3个方面综述了国内外应用大数据进行城市时空间行为研究的最新进展,构建了基于大数据应用的城市时空间行为研究方法框架。本文认为,大数据时代城市时空间行为研究方法的变革主要取决于对反映居民时空行为的网络或移动信息设备数据的挖掘、处理及应用,但是还需要进一步推动相关学科间的交叉与融合,加强社交网站等网络数据在居民时空行为和城市空间研究中的应用,并指导城市规划编制与管理方法的创新。

DOI

[ Qin X, Zhen F, Xiong L F, et al. Methods in urban temporal and spatial behavior research in the big data era[J].Progress in Geography, 2013,32(9):1352-1361. ]

[38]
谭璐. 高维数据的降维理论及应用[D].长沙:国防科学技术大学,2005.

[ Tan L.The theory and application of the dimension reduction on the high-dimensional data set[D]. Changsha: National University of Defense Technology,2005. ]

[39]
郝晓军,闫京海,樊友谊.大数据分析过程中的降维方法[J].航天电子对抗,2014,30(4):58-60.随着大数据时代的到来,高维数组的分析越来越困难。介绍了两种大数据线性降维的方法,通过构造计算矩阵,求解矩阵的特征值和特征向量,可以非常容易地发现数据的极小维度表示,降低后期大数据分析的复杂度。通过采用这些方法进行数据降维,可以找出数据内在的相互关系,非常有利于数据分布规律的分析。

DOI

[ Hao X J, Yan J H, Fan Y Y.Dimensionality reduction of large volumes of data analysis[J]. Aerospace Electronic Warfare, 2014,30(4):58-60. ]

[40]
Lin J, Keogh E, Lonardi S, et al. A symbolic representation of time series, with implications for streaming algorithms. Proceedings of the 8th ACM SIGMOD workshop on Research issues in data mining and knowledge discovery, 2003:2-11.The parallel explosions of interest in streaming data, and data nfining of time series have had surprisingly little intersection. This is in spite of the fact that time series data are typically streaming data. The main reason for this apparent paradox is the fact that the vast majority of work on streaming data explicitly assumes that the data is discrete, whereas the vast majority of time series data is real valued.

DOI

[41]
Kaufman L, Rousseeuw P J.Finding groups in data: an introduction to cluster analysis[M]. John Wiley & Sons, 2009:157-159.

[42]
王开军,李健,张军英,等.聚类分析中类数估计方法的实验比较[J].计算机工程,2008,34(9):198-199.在基因表达数据的探索性聚类分析中,聚类个数的确定是决定聚类质量的关键因素。许多聚类有效性评价指标和方法可用于PAM聚类算法。该文讨论适合于PAM算法的7种常用评价指标和方法,采用4种不同聚类结构特征的基因表达数据对它们的性能进行实验比较。结果表明,系统演化方法和稳定性方法估计聚类个数的性能最好,正确率分别为100%与90%。

[ Wang K J, Li J, Zhang J Y, et al. Experimental comparison of clusters number estimation for cluster analysis[J]. Computer Engineering, 2008,34(9):198-199. ]

[43]
林琳,卢道典.广州重大交通设施建设与空间结构演化研究[J].地理科学,2011,31(9):1050-1055.1949年以来广州实施重大交通设施项目,带动城市空间结构形态发生较大变化,主要可分为3个阶段:①新中国成立至改革开放的30 a间着重实施了以城市道路和桥梁为主体的交通设施项目,使广州形成了沿珠江前航道"带状分散组团状"的空间结构形态;②改革开放后的20 a间,广州重点实施了快速路和高速公路为主体的交通设施项目,使城市空间沿珠江前航道向东和白云山西侧向北拓展,空间结构形态呈现"L形三大组团状";③2000年后的10 a间,番禺、花都"撤市设区"使广州市区范围大大拓展,新白云国际机场、广州铁路客运南站(高铁车站)、南沙深水港、地铁等重大交通设施和轨道交通设施项目在更大范围内进行合理布局和建设,促使了广州"多中心、网络状"空间结构的形成。

[ Lin L, Lu D D.Major transportation facility and spatial structure evolution in guangzhou[J]. Scientia Geographica Sinica, 2011,31(9):1050-1055. ]

[44]
曹小曙,薛德升,阎小培.城市交通运输地理发展趋势[J].地理科学,2006,26(1):111-117.从城市交通运输地理研究的核心概念入手,在对具有代表性的交通运输地理著作及刊物的研究进行综述基础上,对城市交通运输地理的发展进行分析,揭示城市交通运输地理目前研究的主要内容及发展趋势,丰富和发展城市地理学及交通地理学的研究内容.

DOI

[ Cao X S, Xue D S, Yan X P.Development tendency of urban transport geography[J]. Scientia Geographica Sinica, 2006,26(1):111-117. ]

Outlines

/