Orginal Article

Temporal and Spatial Analysis of Agricultural Drought in Yunnan Provincebased on Vegetation Condition Index

  • LV Xiaoran , 1, 2, 3 ,
  • YIN Xiaotian 1, 2, 3 ,
  • GONG Adu , 1, 2, 3, * ,
  • WANG Qianfeng 4 ,
  • LI Jing 1, 2, 3 ,
  • ZHANG Hui 3, 5
Expand
  • 1. State Key Laboratory of Earth Surface Processes and Resource Ecology, Beijing Normal University, Beijing, 100875,China
  • 2. Key Laboratory of Environmental Change and Natural Disaster, MOE, Beijing Normal University, Beijing, 100875
  • 3. Academy of Disaster Reduction and Emergency Management, Beijing Normal University, Beijing, 100875
  • 4. College of Environment and Resources, Fuzhou University, Fuzhou,350116
  • 5. Beijing Social Administration Vocational College, Beijing, 101601
*Corresponding author: GONG Adu, E-mail:

Received date: 2016-02-29

  Request revised date: 2016-06-29

  Online published: 2016-12-20

Copyright

《地球信息科学学报》编辑部 所有

Abstract

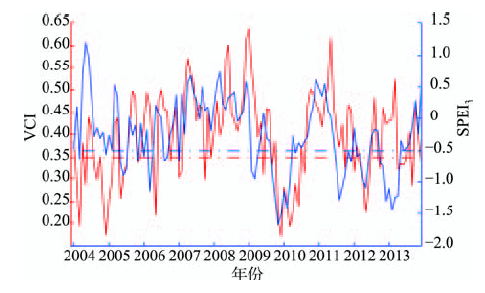
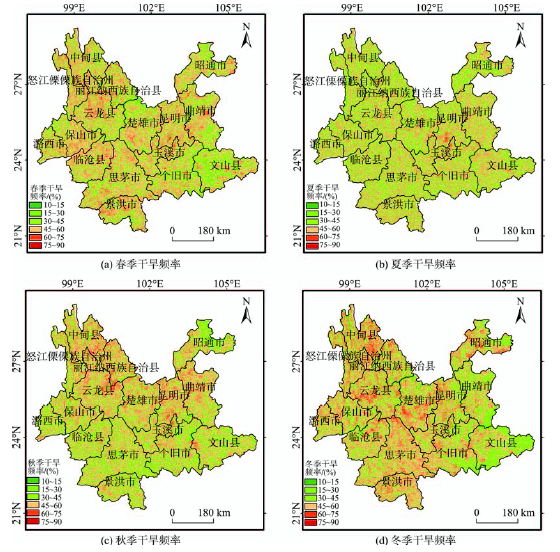
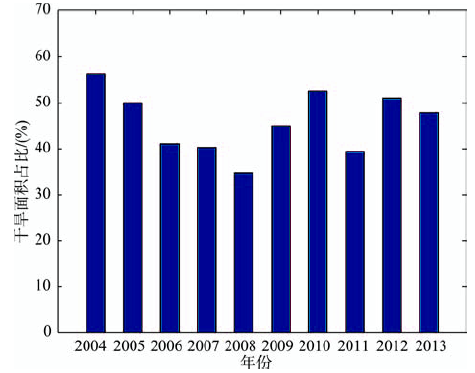
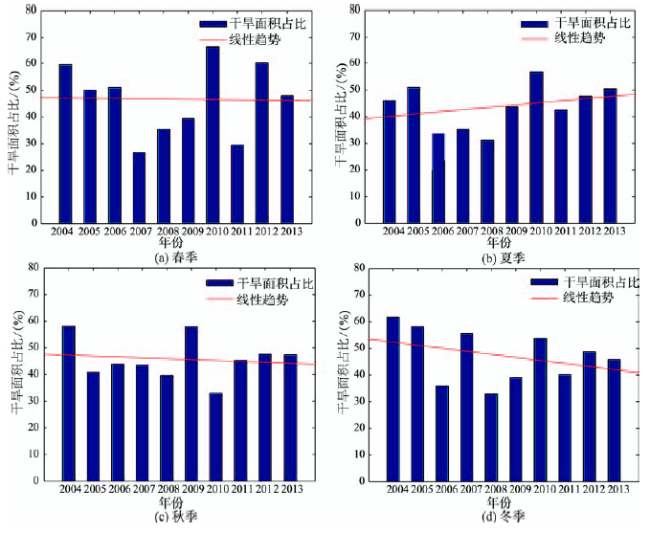
Considering the normalization characteristic of drought in Yunnan Province during recent years, it’s very significant to study the drought in Yunnan province. Nowadays, major studies focus on the meteorological drought in Yunnan Province and the studies focus on agricultural drought in Yunnan Province are few. But the data used in the study methods of meteorological drought can’t represent vegetation growth state. Also they cannot be used to evaluate the effect of drought on vegetation or analyze temporal and spatial distribution of agricultural drought in Yunnan Province. Because of these disadvantages, this paper calculated the vegetation condition index(VCI) of Yunnan Province during 2004-2013, identified agriculture drought events and analyzed temporal and spatial distribution of agricultural drought. Before the temporal and spatial distribution was analyzed, agricultural drought events identified by VCI were compared with meteorological drought events identified by the standardized precipitation evapotranspiration index (SPEI) and the Pearson correlation coefficient was calculated between VCI and precipitation to evaluate the capability of VCI index.We found the similarities and differences between these two types of drought events and analyzed the possible reasons. The results revealed that there were differences between drought events identified by these two indices because drought events identified by SPEI index are based on meteorological elements such as precipitation and temperature while drought events identified by VCI index are based on vegetation growth state which is not only affected by meteorological elements. The low Pearson correction coefficient also demonstrates precipitation is just one of the key factors which affect vegetation growth state. Though there are differences between these two types of drought events, VCI and SPEI can both monitor drought and identify classical drought events well. Based on this conclusion, temporal and spatial distribution characteristics of agricultural drought in Yunnan Province were analyzed using drought frequency index and drought-area-ration index. The results showed that: drought frequency of spring and winter is higher than that of autumn and the drought frequency of summer is the lowest. The spatial distribution of drought frequency during spring, summer and winter is relatively uniform while the drought frequency of northern Yunnan during autumn is higher than that of southern Yunnan. Overall, the drought frequency of northern Yunnan is higher than southern Yunnan and drought-area-ratio of Yunnan during 2004-2013 shows a decreasing-increasing and fluctuating trend. Drought-area-ratio index of spring and winter is the highest whose values are 46.63% and 47.18%, respectively. Both of them show a decreasing trend. Drought-area-ratio index of summer is the lowest whose value is 43.81% and shows an increasing trend. The value of drought-area-ratio index of autumn is between spring and summer and has a decreasing tendency. Based on these results, agricultural drought of spring and winter is most prone to happen and the extent is the maximum while the agricultural drought of summer is least prone to happen and the extent is the minimum. Since vegetation growth state is not only affected by drought but also can be affected by plant diseases and insect pests, irrigation, frozen injury and improper fertilization, this study monitoring agricultural drought based on VCI index has some limitations. Future work should focus on the physical mechanism of agricultural drought and the biophysical response of vegetation to drought in order to monitor and forecast agricultural drought more accurately.

Cite this article

LV Xiaoran , YIN Xiaotian , GONG Adu , WANG Qianfeng , LI Jing , ZHANG Hui . Temporal and Spatial Analysis of Agricultural Drought in Yunnan Provincebased on Vegetation Condition Index[J]. Journal of Geo-information Science, 2016 , 18(12) : 1634 -1644 . DOI: 10.3724/SP.J.1047.2016.01634
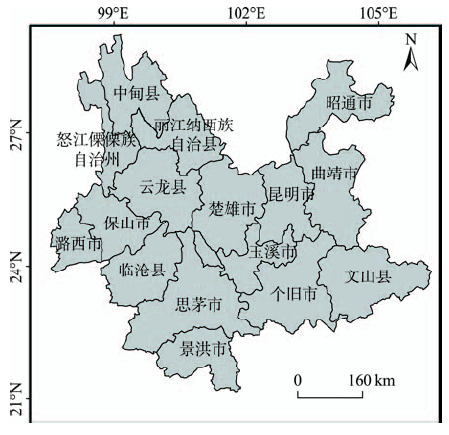
1 引言

旱灾是一种常见的自然灾害,具有很大影响,据统计中国每年遭受各种自然灾害影响的农田面积和粮食作物减产损失中,旱灾占一半以上[1]。一般将干旱分为气象干旱、水文干旱、农业干旱和水分供给干旱[2]4类。目前,区域尺度上的干旱研究主要集中在气象干旱和农业干旱2个方面[3]
遥感是农业干旱监测的重要手段,基于遥感数据的农业干旱监测方法主要分为热惯量法、植被指数法、微波遥感方法和冠层温度方法[4]4类。植被指数直接反映植被生长状态,而植被生长状态与土壤水分密切相关,同时植被指数也具有计算简单、可获得性强的优点,因此基于植被指数的遥感监测是监测农业干旱的重要途径。应用较为广泛的基于植被指数的农业干旱监测指数是Kogan提出的植被状态指数[5](Vegetation Condition Index, VCI),VCI指数能够反应短期天气信号如降水减少对植被的影响。Kogan以美国为研究区,发现VCI指数能够很好地监测大区域尺度干旱,并且与作物产量呈现很好的相关性[6];Tagel[7]、Farai Kuri[8]和Parinaz[9]分别使用VCI指数对不同研究区的干旱及时空变化进行研究,发现VCI指数能够更好地识别出干旱对作物的影响进而对农业干旱进行监测[6,8]
云南省受地理环境、气候条件和人为因素的影响,干旱发生频率高,平均每年有50个县受灾[10],给当地社会发展尤其是农业生产造成了严重影响。目前,国内外已有多位学者对云南省干旱进行研究,任菊章[11]、韩元元[12]、王佳津[13]、张冬冬[14]、张雷[15]分别基于相对湿润度指数、SPI、Palmer和SPEI指数对1961-2010或者1954-2010年云南省气象干旱时空特征进行分析;Dongdong Zhang[16]和HuiCong Jia[17]分别基于综合气象干旱指数和降水数据评估云南省气象干旱风险;Sawaid Abbas[18]和王海[19]分别基于归一化植被供水指数和TVDI指数从农业干旱的角度对云南省2009-2010年旱灾进行时空分析。现有的云南省干旱研究多集中在气象干旱领域,关于农业干旱的研究较少,但是气象干旱方法使用的数据无法代表植被的生长状况、无法评价干旱对植被的影响,无法直接分析云南省农业干旱的时空特征。
因此,本文以云南省为研究区,采用VCI指数作为农业干旱监测指标,对VCI和降水进行Pearson相关分析,评价降水对VCI的影响;识别云南省2004-2013年农业干旱事件,并与SPEI_3识别出的气象干旱事件进行对比分析。在此基础上,将干旱频率和站次比气象干旱定义引入为农业干旱的干旱频率和干旱面积占比指标,分析农业干旱的时空特征,为农业干旱预警提供参考。

2 研究区和数据

2.1 研究区

本文选择云南省作为典型研究区(图1)。云南地处我国西南边陲,经纬度范围为97°~106°E,21°~29°N。气候类型复杂,兼具低纬气候、季风气候、山原气候的特点。全省多年年均降水量为1258 mm,降水时空分布极不均匀[20],南多北少,夏多冬少。有明显的干季、雨季。气温南高北低,年较差小,日较差大,春温高于秋温。云南省的气候特点决定了其是干旱多发区,通过资料分析也证实,近年来云南省干旱呈“常态化”的特点[21]
Fig. 1 Map of Study area

图1 研究区(云南省)概况图

2.2 数据

2.2.1 MODIS数据
MODIS(Moderate resolution imaging spectroradiometer)搭载于EOS Terra和Aqua两颗卫星上,具有36个光谱通道,每1-2d可获取一次全球地表数据。因其光谱范围广,覆盖范围大,数据更新频率快并且数据接收免费的优点对于农业干旱研究具有独特优势。
MOD13A3数据是基于限定角度最大值合成法(Constrained view angle-Maximum Value Composite,CV-MVC)得到的NDVI产品,空间分辨率为1km,时间分辨率为月,每年共12个数据。
本文使用2004-2013年MOD13A3NDVI产品对云南省农业干旱进行研究。
2.2.2 气象数据
从中国气象科学数据共享网(http://cdc.nmic.cn/home.do)提供的中国地面气候资料日值数据集中下载1984-2013年云南省气象站点数据,包括气温、降水等气象要素。下载的数据中某些气象站点的数据采集时间并不能完全涵盖研究时段,因此剔除掉不能涵盖研究时段的站点,最终使用的气象站点为29个,站点分布如图2所示。
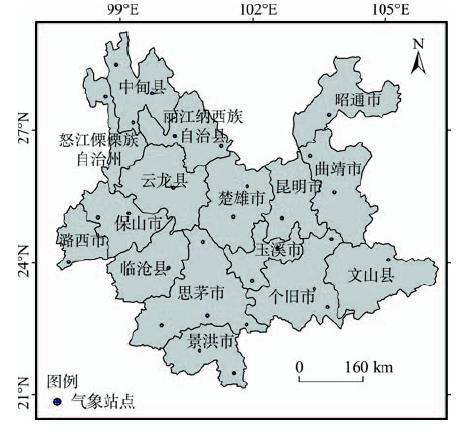
Fig. 2 Distribution of meteorologicalstations in Yunnan Province

图2 云南省气象站点分布

3 研究方法

3.1 农业干旱状态识别方法

植被覆盖区的植被指数变化由2类因素导致:生态系统因素和极端天气因素。极端天气因素并不能通过植被指数(如NDVI)直接监测。Kogan于1993年提出VCI指数[5],假设VCI指数的变化只受天气因素的影响,从而将生态系统因素与极端天气因素剥离开,评价极端天气对植被的影响,监测农业干旱。VCI指数越小表明干旱程度越大。VCI指数的计算方法如式(1)所示。
VC I j = ( NDV I j - NDV I min ) NDV I max - NDV I min (1)
式中: NDV I j 为某年时期j的NDVI值; NDV I max 为多年的时期j的NDVI最大值; NDV I min 为多年的时期j的NDVI最小值。表1是Kogan提出的VCI指数农业干旱判别标准[6]
Tab. 1 Discrimination standard of agriculture drought

表1 农业干旱判别标准

VCI指数 干旱状态
≤0.35 干旱
>0.35 非干旱

3.2 气象干旱状态识别方法

常用的气象干旱指数有标准化降水指数(Standardized Precipitation Index, SPI)、帕尔默干旱指数(PDSI)、标准化降水蒸散指数(the Standardized Precipitation Evapotranspiration Index, SPEI)和降水距平指数等。其中SPEI指数由Vicente-Serrano[22]于2010年提出,SPEI在SPI指数的基础上考虑温度对干旱的影响,是应用于干旱趋势分析的较新并且较为理想的气象干旱指数,在干旱评估和水资源管理领域得到广泛应用[23-25]。SPEI基于多年的月或周时间尺度降水和温度气象数据计算,首先基于Penman-Monteith方程计算区域潜在蒸散,进而使用降水数据计算每月或每周的水分亏损/盈余量并累计为不同时间尺度的水分亏损/盈余量,最后将水分亏损或盈余量时间序列调整为log-logistic概率分布,计算出每月或每周不同时间尺度的SPEI值。SPEI指数气象干旱判别标准[22],如表2所示。
Tab. 2 Discrimination standard of meteorological drought

表2 气象干旱判别标准

SPEI指数 干旱状态
≤-0.5 干旱
>-0.5 非干旱

3.3 农业干旱发生程度评估方法

本文采用干旱频率和干旱面积占比2个指标来评价2004-2013年云南省农业干旱发生程度。
3.3.1 干旱频率
类似于气象上干旱频率 P i 的定义[26],定义干旱频率评价云南省各地区在2004-2013年内农业干旱发生的频繁程度,使用式(2)计算。
P i = n 10 × 100 % (2)
式中:n表2004-2013年发生干旱的总年数。由式(2)可知,干旱频率指示研究时段内干旱的易发性。干旱频率高说明在研究时段内多次发生干旱,干旱频率低说明在研究时段内干旱发生次数少。
基于式(2)计算2004-2013年云南省春季(3-5月)、夏季(6-8月)、秋季(9-11月)和冬季(12-2月)的干旱频率。
3.3.2 干旱面积占比
类似于气象上干旱站次比的定义,用云南省发生农业干旱的面积占云南省总面积的比例来评价农业干旱发生范围的大小[26],定义为干旱面积占比,使用式(3)计算。
P j = m M × 100 % (3)
式中:m代表云南省发生农业干旱的面积;M代表云南省的总面积;j代表不同的年(月、季)。由式(3)可知,干旱面积占比不仅表示某一区域干旱范围的大小,也间接反映干旱的严重程度,干旱面积占比越大,说明该区域大面积发生干旱,干旱影响范围大,较为严重。
本文分别计算了2004-2013年每年的干旱面积占比与每个季节的干旱面积占比。

4 结论与分析

4.1 VCI指数与降水量Pearson相关分析

在对比分析农业干旱和气象干旱识别结果前,首先定量分析气象干旱关键诱导因子之一降水对VCI指数的影响,因此对云南省29个气象站点的VCI和不同时间尺度的累积降水量进行Pearson相关分析。结果如表3所示。
Tab. 3 Pearson correlation analysis of VCI and precipitation of meteorological stations in Yunnan Province

表3 云南省气象站点VCI与降水Pearson相关分析

站点名称 VCI与当月
降水相关
系数
VCI与前2个月累积降水
相关系数
VCI与前3个月累积降水
相关系数
VCI与前4个月累积降水
相关系数
德钦 0.0110 0.0390 0.0195 0.0433
贡山 -0.0890 -0.0838 -0.0645 -0.0373
中甸 -0.0600 -0.0794 -0.0579 -0.0679
维西 -0.0230 -0.0162 -0.0741 -0.0841
昭通 0.0856 0.0594 -0.0126 -0.0653
丽江 0.1067 0.1542 0.1798 0.1942*
华坪 0.0425 0.0075 -0.0397 -0.0635
会泽 0.1517 0.1738 0.1680 0.1566
腾冲 -0.0844 -0.0453 -0.0311 -0.0430
保山 0.1214 0.1548 0.1889* 0.1894*
大理 0.0415 0.0400 0.0706 0.0709
元谋 0.0778 0.1768 0.1382 0.0815
楚雄 -0.0207 0.0044 0.0308 0.0596
昆明 0.0999 0.0638 -0.0076 -0.0833
沾益 0.1050 0.2498** 0.2240* 0.2235*
瑞丽 0.1300 0.1608 0.1879* 0.2012*
景东 0.0100 -0.0373 -0.0425 -0.0396
玉溪 0.0350 0.0984 0.1059 0.0957
泸西 -0.0126 -0.0379 0.0026 0.0458
临沧 -0.0228 0.0022 -0.0153 -0.0469
澜沧 -0.0863 -0.0372 0.0567 0.0907
景洪 0.1079 0.0635 0.0259 0.0081
思茅 -0.0536 -0.1290 -0.1518 -0.1239
元江 0.0775 0.0967 -0.0081 0.0294
勐腊 0.0369 0.0861 0.0983 0.0964
江城 0.0871 0.0911 0.1078 0.1145
蒙自 -0.0367 -0.0459 -0.0467 -0.0016
屏边 -0.1179 -0.1282 -0.0768 -0.0626
广南 -0.1081 -0.0648 -0.0138 0.0134

注:**表示双尾检验显著性水平为0.01;*表示双尾检验显著性水平为0.05

表3可得到如下结论:① VCI和降水相关性较低,相关系数最高只有0.2498,这说明降水只是影响植被生长状态的关键因素之一,植被生长状态不仅受降水减少所导致的干旱的影响,病虫害、灌溉、施肥不当、田间管理等因素均会导致植被生长状态的变化。② 仅有6个站点VCI与当月降水相关系数最高,其余站点Pearson系数均在多月尺度取得最大值,这说明VCI对降水响应具有滞后性。

4.2 2004-2013年农业干旱指数和气象干旱指数干旱事件识别对比分析

SPEI常用的时间尺度为1、3、6、12个月,SPEI_1仅考虑当月标准化降水量,SPEI_n(n>1)考虑当月与前n-1个月的累积标准化降水量。不同时间尺度的SPEI指数识别的干旱起始终止时间和严重程度不同[24],随着时间尺度的增加,识别的干旱事件数目减小,起始终止时间和重现期增加[27]。由于气象干旱指数和农业干旱指数分别基于不同因素识别和评价干旱,多位学者研究了气象干旱指数与农业干旱指数的关系,Singh[28]、Bhuiyan[29]研究表明VCI与水文、气象干旱指数的相关性很弱;Cui Hao[30]以中国西南地区为研究区,发现SPEI_3和SPEI_6与农业干旱指数VCI相关性最高,Zhiyong Wu[27]以中国西南地区为研究区发现SPEI_3与农业干旱指数土壤水分异常百分比(Soil moisture anomaly percentage index,SMAPI)相关性最好。借鉴已有研究成果,本文分别计算2004-2013年研究区VCI和SPEI_3、SPEI_6的相关系数,结果如表4所示。
Tab. 4 Correlation coefficients betweenVCI and SPIE_3、SPEI_6

表4 VCI与SPEI_3、SPEI_6相关系数

SPEI指数 相关系数
SPEI_3 0.1699
SPEI_6 0.1457
表4可看出,VCI与SPEI_3、SPEI_6的相关系数均很低,这和Singh、Bhuiyan的研究相符,但SPEI_3与VCI的相关系数略高于SPEI_6,因此本文使用SPEI_3作为气象干旱监测指数。
图3是2004-2013年共120个月的云南省VCI和SPEI_3时间序列图,根据表1表2给出的干旱指标判别标准,分别对气象干旱和农业干旱进行 识别。
Fig. 3 Time series of VCI and SPEI_3 from2004 to 2013 in Yunnan province

图3 2004-2013年云南省VCI和SPEI_3时间序列图

图3可看出,除去2012年12月到2013年3月,2个指数的变化趋势不同,VCI和SPEI_3呈现基本一致的变化趋势。为了对2种干旱事件识别结果进行精确对比分析,统计2个指数所识别的干旱事件及干旱事件的起始终止时间,将结果分为共同识别的干旱事件、VCI识别但SPEI_3未识别和SPEI_3识别但VCI未识别的干旱事件3类,如表5所示。
Tab. 5 Statistics of agriculture drought events and meteorological drought events during 2004-2013

表5 2004-2013年农业干旱事件与气象干旱事件统计表

共同识别的干旱 VCI识别
SPEI_3未识别
SPEI_3识别
VCI未识别
2004年3月 2004年2月 2006年1月
2004年12月 2004年5月 2009年2-4月
2005年5-7月 2004年8-9月 2011年7-9月
2005年11月 2004年11月 2011年11-12月
2006年3-5月 2005年1-2月 2012年11-12月
2006年8-10月 2007年10月 2013年1-3月
2007年1-2月 2009年6月
2009年9-12月 2010年8月
2010年1-5月 2013年9月
2011年10月 2013年12月
2012年1-6月
2012年10月
2013年4-7月
共计35个月 共计12个月 共计14个月
表5可知,VCI和SPEI_3所识别的干旱事件及日期并不完全相同,对于前人研究中已记录的典型干旱事件:2004年12月干旱[31]、2005年5-7月气象干旱[30]、2009年9月至2010年3月[16]、2011年6月-2011年9月[17]、2012年1月-2012年5月[17]、2012年10-11月[17]和2013年1-5月干旱[17],除了2011年6-9月干旱仅仅被SPEI_3指数识别,其他的典型干旱均被2个指数识别,但是干旱事件的持续时间有所差异。
VCI识别但SPEI_3未识别的干旱事件可分为2类:① 多月尺度的干旱,2004年8-9月和2005年1-2月;② 月尺度的零星干旱。对于2005年1-2月VCI识别但SPEI_3未识别的干旱,这是由于农业干旱相对于气象干旱的延迟效应所导致[3],从表5可看出,2004年12月发生气象干旱和农业干旱,当2005年1月降水增加气象干旱结束后,植被并不能即刻恢复到健康状态,植被指数低,仍显示为农业干旱状态。对于2004年8-9月干旱和1个月尺度的零星干旱,主要原因为:① 植被状态不仅受降水的影响,其他因素如病虫害、施肥不当等的影响,也会导致NDVI减小,VCI减小,识别为农业干旱[32];② NDVI数据本身的系统误差也会造成误判。
SPEI_3识别但VCI未识别的干旱事件主要为多月尺度干旱,对于此类干旱,主要是由2个原因造成:① 灌溉影响,由于VCI基于植被状态监测干旱,因此当降水减少时,农田管理如灌溉措施,仍能保证或者短时间内保证植被的正常生长,因此监测到的农业干旱历时短甚至无农业干旱发生;② 植被对降水减少响应的滞后性,植被的生理特性使得植被对降水减少的响应需要一定时间,因此会出现当SPEI_3指数识别为气象干旱时,所对应的VCI指数并未指示发生了农业干旱。
整体而言,VCI指数和SPEI_3指数均能够较好地监测干旱,并识别同一典型干旱事件,但由于VCI和SPEI_3分别从不同的方面对干旱进行监测,因此识别的干旱事件以及干旱事件的起始终止日期存在差异[32],这和4.1节中VCI与降水具有较低相关性的结论相符。

4.3 基于干旱频率的农业干旱空间特征分析

使用3.3.1节的方法,计算云南省春季(3-5月)、夏季(6-8月)、秋季(9-11月)和冬季(12-2月)的农业干旱频率并统计不同干旱频率区间的面积百分比,如图4、5和表6所示。
Fig. 4 Maps of drought frequency of each season during 2004-2013 in Yunnan Province

图4 云南省2004-2013年不同季节干旱频率图

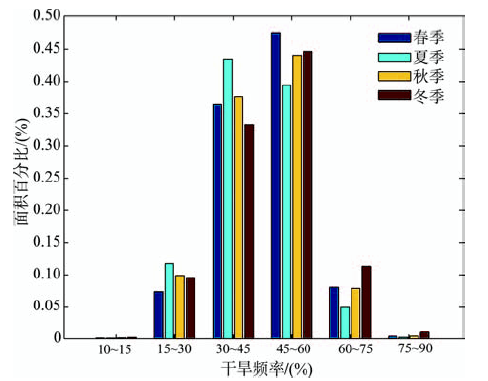
Fig. 5 Area percentage of different droughtfrequency in Yunnan Province

图5 云南省干旱频率面积百分比

Tab. 6 Area percentage of different droughtfrequency in Yunnan province

表6 云南省干旱频率面积百分比

区间 春季/(%) 夏季/(%) 秋季/(%) 冬季/(%)
10%~15% 0.108 0.097 0.141 0.192
15%~30% 7.420 11.758 9.900 9.531
30%~45% 36.493 43.478 37.618 33.305
45%~60% 47.523 39.465 44.052 44.656
60%~75% 8.092 4.997 7.906 11.340
75%~90% 0.364 0.205 0.382 0.976
图4、5和表6可看出,冬春两季干旱频率较高,冬春季干旱频率均主要分布在30%~75%之间,面积百分比分别为89.301%和92.108%;夏秋两季干旱频率较低,夏秋季干旱频率均主要分布在 15%~60%之间,面积百分比分别为94.701%和91.57%。
春季干旱频率面积百分比取得峰值的干旱频率区间为45%~60%。干旱频率在空间上分布比较均匀,高值区域主要分布在云南省北部和西南部,东南部干旱频率较低。夏季,受海洋气团的影响,云南省受赤道低压带和副热带高压天气系统的控制,降水增多,日照小,进入雨季[33],夏季整体干旱频率较春季明显降低,面积百分比取得峰值的干旱频率区间为30%~45%,并且干旱频率区间为 15%~30%的面积百分比为四季最高值,空间分布较均匀,高值区域主要分布在玉溪市北部和昆明市南部。秋季干旱频率较夏季呈增加趋势,面积百分比取得峰值的干旱频率区间为45%~60%,干旱频率呈现北高南低的空间分布模式;冬季由于受到西方干暖气团和北方干冷气团的影响,云南省主要受西风带天气系统控制,降水少,日照充足,进入干 季[34]。从图4(d)可看出,冬季干旱频率较秋季增大,面积百分比取得峰值的干旱频率区间为 45%~60%,并且干旱频率区间为60%~75%的面积百分比为四季最高值,云南省南部干旱频率较秋季大幅度增加,干旱频率的空间分布基本均匀,只有云南省东南角的文山县区域干旱频率较低。
综上所述,云南省农业干旱频率在春季和冬季较高,空间分布相对均匀,秋季干旱频率低于冬春两季,空间分布呈现南低北高的态势,夏季干旱频率最低,空间分布相对均匀。从空间分布上看,整体上云南省北部干旱频率高于南部。其中,西北部夏季干旱频率较低,春秋冬三季干旱频率较高;西南部夏秋两季干旱频率较低,春冬两季干旱频率较高;东北部和东南部各季节间干旱频率相差不大。

4.4 基于干旱面积占比的农业干旱时间特征分析

使用3.3.2节的方法,计算云南省2004-2013年以年和季节为单位的农业干旱面积占比得到图6、7。
Fig. 6 Interannual variation of drought-area-ratioin Yunnan province

图6 云南省干旱面积占比年际变化图

4.4.1 干旱面积占比年际变化
云南省多年平均整体干旱面积占比为45.84%。如图6所示,2004、2005、2010和2012年是干旱面积占比最高的年份,其值均超过了50%。从年际变化上看,2004-2013年均干旱面积占比呈先减小后增加再减小再增加的波动趋势。2004-2008年干旱面积占比整体呈下降趋势,由55%左右下降到35%左右,干旱强度呈降低趋势;2009年干旱面积占比开始上升,2010干旱面积占比达到52%左右,2011年干旱面积占比下降到39%左右,2011-2012年干旱面积占比上升,在2009-2013年内,干旱强度呈波动趋势。
4.4.2 干旱面积占比季节变化
在干旱面积占比年际变化分析的基础上,分析干旱面积占比的季节间变化和同一季节干旱面积占比的年际变化。图7是2004-2013年云南省不同季节的干旱面积占比时间序列图,表7是2004-2013年云南省不同季节的平均干旱面积占比。
Fig. 7 Time series of drought-area-ratio in Yunnan province by seasons

图7 云南省不同季节干旱面积占比时间序列

Tab. 7 Average drought-area-ratio in Yunnan Province by seasons during 2004-2013

表7 云南省2004-2013年不同季节平均干旱面积占比

季节 干旱面积占比/(%)
春季 46.63
夏季 43.81
秋季 45.74
冬季 47.18
图7可看出,对于春季,2004、2006、2010和2012年干旱面积占比超过50%,十年间整体呈略微下降的趋势;对于夏季,2005、2010和2013年干旱面积占比超过50%,10年间整体呈增加趋势;对于秋季,2004年和2009年干旱面积占比超过50%,整体呈下降趋势;对于冬季,2004、2005、2007和2010年干旱面积占比超过50%,整体呈下降趋势。从表7可知,冬季干旱面积占比最大,春季干旱面积占比次之,秋季干旱面积占比小于春季,夏季干旱面积占比最小。因此,云南省冬季和春季农业干旱范围较大,秋季农业干旱范围略低于春冬两季,夏季农业干旱范围最小。
分析同一年份不同季节干旱面积占比的相对大小发现,2004、2006、2008和2012年夏季干旱面积占比最低,其他年份夏季干旱面积占比居中;2006、2010和2012年春季干旱面积占比最大,2007、2009和2011年春季干旱面积占比最低;2004、2005、2007和2013年冬季干旱面积占比最高,其他年份冬季干旱面积占比居中;2008、2009和2011年秋季干旱面积占比最高,2005年秋季干旱面积占比最低,其他年份干旱面积占比居中。干旱面积占比的季节间变化再次论证了云南省冬季和春季农业干旱状况较为严重,干旱范围较大,夏季农业干旱范围最小,秋季农业干旱范围介于冬春季和夏季之间。

5 结论与讨论

5.1 结论

本文计算云南省2004-2013年农业干旱指数VCI,使用Pearson相关系数评价降水与VCI的相关性,基于VCI指数识别云南省农业干旱,并将识别结果与基于SPEI_3气象干旱指标的气象干旱识别结果进行对比分析;在此基础上,参照气象上干旱频率和站次比指标的定义并提出农业干旱的干旱频率和干旱面积占比指标,对云南省2004-2013年农业干旱的时空分布特征进行分析,主要结论如下:
(1)降水与VCI指数具有较低的相关性,降水只是影响植被状态的关键因素之一。VCI指数和SPEI_3指数均能较好地监测干旱并识别同一典型干旱事件。但2个指数的识别结果并非完全相同,这是由于VCI指数和SPEI_3指数是分别基于植被生长状态和气象要素对干旱进行识别。降水与VCI指数相关性分析说明降水只是影响植被生长状态的关键因素之一,其他因素如病虫害、施肥不当、田间管理等均会影响植被状态,从而导致VCI识别为干旱但SPEI_3不识别为干旱的情况。当降水减少时,人为措施如灌溉会保证植被状态不受影响或受影响较轻,从而导致VCI监测到的农业干旱历时短甚至无农业干旱发生。同时降水与VCI较高的相关系数大部分出现在多月尺度,这说明植被状态对降水的响应有滞后性,从而导致VCI识别的农业干旱时间滞后于SPEI_3识别的气象干旱。
(2)云南省农业干旱频率在不同季节具有不同的空间分布特点,春冬季干旱频率较高,空间分布相对均匀;秋季干旱频率低于冬春两季,空间分布呈南低北高的态势;夏季干旱频率最低,空间分布相对均匀。从空间分布上看,云南省整体上北部干旱频率高于南部。其中西北部夏季干旱频率较低,春秋冬三季干旱频率较高;西南部夏秋两季干旱频率较低,春冬两季干旱频率较高;东北部和东南部各季节间干旱频率相差不大。
(3)云南省多年平均整体干旱面积占比为45.84%。2004-2008年,干旱面积占比整体呈下降趋势,2009-2013年,干旱面积占比呈波动趋势;不同季节干旱面积占比的年际变化显示冬春季干旱面积占比较高,干旱范围大并且均呈下降趋势;夏季干旱面积占比最低,干旱范围小但呈上升趋势;秋季干旱面积占比介于中间,干旱范围呈下降趋势。
(4)基于干旱频率和干旱面积占比两个指标可以发现,云南省冬季和春季农业干旱易发性高,并且影响范围大,夏季农业干旱易发性最低,影响范围最小,秋季农业干旱易发性和影响范围介于冬春和夏季中间[35]

5.2 讨论

本文基于VCI指数监测2004-2013年云南省农业干旱及其时空特征,但是VCI指数是植被生长状态的函数,而植被生长状态的优劣不仅仅受干旱影响,病虫害、施肥不当、冻害或者灌溉等其他因素也会引起植被生长状态变化。因此VCI反映的是植被生长状态的综合信息,而不只是降水等气象因素对植被状态的影响,本文仅基于VCI指数监测农业干旱具有一定的局限性。
为了深入研究农业干旱,较好地掌握农业干旱的发生规律,下一步应该从农业干旱发生的物理机制入手,研究剔除掉其他环境因素的影响,仅考虑降水、温度等气象因子对植被状态影响的农业干旱指标,同时研究植被对干旱的生物物理响应过程,结合以上2点更好地研究农业干旱,进而为农业干旱的精确监测甚至预测提供可能。

The authors have declared that no competing interests exist.

[1]
冯强,田国良.全国干旱遥感监测运行系统的研制[J].遥感学报,2003,7(1):14-18.该研究利用1981-1994的NOAA AVHRR 8km分辨率的NDVI资料,以及对应时段全国102个固定农业观测站的20cm深的土壤湿度资料,建立了植被状态指数(VCI)与土壤湿度之间的统计模型,由土壤湿度旱情等级标准来换算出每旬用VCI进行干旱监测的旱情等级标准,以确定出全国的旬旱情分布状况,在此工作的基础上建成了“全国干旱遥感则运行系统”,该运行系统使遥感手段监测全国干旱成为可能,将能提供每年3-9月每旬全国的干旱监测情况,为国家有关决策部门提供干旱减灾的决策依据。

DOI

[ Feng Q, Tian G L.Research on the operational system of drought monitoring by remote sensing in China[J]. Journal of Remote Sensing, 2003,7(1):14-18. ]

[2]
Kallis G.Droughts[J]. Annual Review of Environment and Resources, 2008,33(1):85-118.

[3]
唐侥,孙睿.基于气象和遥感数据的河南省干旱特征分析[J].自然资源学报,2013,28(4):646-655.干旱是一种常见的自然灾害,严重影响着我国的农业生产。论文分别采用标准化降水指数(SPI)和条件植被指数(VCI)对河南省干旱时空特征进行分析,并探讨了气象干旱和农业干旱的相关性。结果表明:近60 a河南省气象干旱频率呈现出轻微上升的趋势,夏秋两季气象干旱频率较高,农业干旱频率在秋冬两季较高,气象干旱和农业干旱频率在不同季节呈现出不同的空间分布特点。整体上看,农业干旱相对于气象干旱,存在一定程度的滞后:冬季最长,约为2个月,春季较长,约为1个月,而夏季最短,小于1个月;河南省SPI和VCI的相关性具有明显的时空分布特征:冬季和春季相关性较强,夏季次之,秋季最差;平原和盆地区等冬小麦/夏玉米种植区正相关性较强,在非耕地区有所减弱,而在信阳南部等水稻种植区正相关性差。

DOI

[ Tang Y, Sun R.Analysis of drought characteristics in Henan province with meteorological and remote sensing data[J]. Journal of Natural Resources, 2013,28(4):646-655. ]

[4]
孙丽,陈焕伟,赵立军,等.遥感监测旱情的研究进展[J].农业环境科学学报,2004,23(1):202-206.干旱是威胁我国及世界农业发展的自然灾害之一,遥感技术已经成为监测旱情的重要手段。本文回顾了近些年来遥感监测旱情的研究进展,并总结了国内外常用的模型,着重从热惯量法,冠层温度法,植被指数法以及微波遥感等几方面做出评述,并对遥感监测旱情的下一步发展提出展望。

DOI

[ Su L, Chen H W, Zhao L J, et al. The advances of drought monitoring by remote sensing[J]. Journal of Agro-Environment Science, 2004,23(1):202-206. ]

[5]
Kogan F, Sullivan J.Development of global drought-watch system using NOAA/AVHRR data[J]. Advances in Space Research, 1993,13(5):219-222.Recently, NOAA/NESDIS developed the Vegetation Condition Index (VCI) which has proved to be a good indicator of drought. This paper provides a background of VCI development, data processing and outlines a PC-based system designed for early-warning drought diagnostics. There are several examples showing the application of VCI during recent years for detecting and tracking droughts.

DOI

[6]
Kogan F.Droughts of the late 1980s in the United States as derived from NOAA polar-orbiting satellite data[J]. Bulletin of the American Meteorological Society, 1995,76(5):655-668.

[7]
Gebrehiwot T, Van der Veen A, Maathuis B. Spatial and temporal assessment of drought in the Northern highlands of Ethiopia[J]. International Journal of Applied Earth Observation and Geoinformation, 2011,13(3):309-321.With the development of global changes, researchers from all over the world increasingly pay attention to drought detection, and severe droughts that may have resulted from climate change. In this paper, spatial and temporal variability of drought is evaluated based on precipitation data and remotely sensed images. The standard precipitation index (SPI) and vegetation condition index (VCI) are used to evaluate the spatial and temporal characteristics of meteorological and vegetative drought in Tigray, Northern Ethiopia. Based on the drought critical values of SPI and VCI defining drought, the spatial and temporal extent of droughts in the study area is established. We processed 396 decadal images in order to produce the multi-temporal VCI drought maps. The results of the SPI and VCI analysis reveal that the eastern and southern zones of the study region suffered a recurrent cycle of drought over the last decade. Results further show that there is a time lag between the period of the peak VCI and precipitation values obtained from the meteorological stations across the study area. A significant agreement was observed between VCI values with the current plus last two-months of precipitation. The study demonstrates the utility of the vegetation condition index in semi-arid and arid regions. (C) 2010 Elsevier B.V. All rights reserved.

DOI

[8]
Kuri F, Murwira A, Murwira K S, et al. Predicting maize yield in Zimbabwe using dry dekads derived from remotely sensed Vegetation Condition Index[J]. International Journal of Applied Earth Observation and Geoinformation, 2014,33(12):39-46.Maize is a key crop contributing to food security in Southern Africa yet accurate estimates of maize yield prior to harvesting are scarce. Timely and accurate estimates of maize production are essential for ensuring food security by enabling actionable mitigation strategies and policies for prevention of food shortages. In this study, we regressed the number of dry dekads derived from VCI against official ground-based maize yield estimates to generate simple linear regression models for predicting maize yield throughout Zimbabwe over four seasons (2009–10, 2010–11, 2011–12, and 2012–13). The VCI was computed using Normalized Difference Vegetation Index (NDVI) time series dataset from the SPOT VEGETATION sensor for the period 1998–2013. A significant negative linear relationship between number of dry dekads and maize yield was observed in each season. The variation in yield explained by the models ranged from 75% to 90%. The models were evaluated with official ground-based yield data that was not used to generate the models. There is a close match between the predicted yield and the official yield statistics with an error of 33%. The observed consistency in the negative relationship between number of dry dekads and ground-based estimates of maize yield as well as the high explanatory power of the regression models suggest that VCI-derived dry dekads could be used to predict maize yield before the end of the season thereby making it possible to plan strategies for dealing with food deficits or surpluses on time.

DOI

[9]
Bajgiran P R, Darvishsefat A A, Khalili A, et al. Using AVHRR-based vegetation indices for drought monitoring in the Northwest of Iran[J]. Journal of Arid Environments, 2008,72(6):1086-1096.In order to evaluate the capability of NOAA-AVHRR data for drought monitoring in the northwest of Iran having cold semi-arid climate, a study plan was designed involving the production of normalized difference vegetation index (NDVI) and vegetation condition index (VCI) indices and correlating their values to precipitation data. Raw AVHRR images were processed and geometric and radiometric corrections were performed. Seven-day maximum NDVI maps were produced and VCI was calculated using the maximum and minimum NDVI values for the same time period. Precipitation statistics from 19 synoptic meteorological stations were collected. The study covered a five-year time period with three consecutive months in the growing season. Pearson correlation was performed to correlate NDVI and VCI values to precipitation data. Different time lag schemes were tried and the highest correlation coefficients (<em>r</em> values) were obtained while correlating NDVI and VCI to three-month (current plus last two months) precipitation. Better agreement was observed between NDVI and precipitation as compared with that between VCI and precipitation in individual stations. Good correlations were also obtained between average NDVI and VCI of the study area and average three-month precipitation. The results indicated that NOAA-AVHRR derived NDVI well reflects precipitation fluctuations in the study area promising a possibility for early drought awareness necessary for drought risk management.

DOI

[10]
黄宝俊. 灾害管理文库第六卷灾害防御对策研究[Z].北京:当代中国出版,1999.

[ Huang B J. The sixth volume of Disaster management library: Research on disaster prevention contermeasures[Z]. Beijing: Contemporary China Publishing House, 1999. ]

[11]
任菊章,黄中艳,郑建萌.基于相对湿润度指数的云南干旱气候变化特征[J].中国农业气象,2014,35(5):567-574.基于云南15个代表站1961-2010年气候资料,使用相对湿润度(M)指数和Morlet小波变换方法分析云南干旱气候的时空变化规律和特征。结果表明:雨季M指数主要反映降水对干旱的影响,干季M指数对气温、日照等共同引发的蒸散量变化有相应的响应。云南气候干湿年际波动大、年代际变化明显;雨季M指数主要表现为10~16a、6~8a和2~4a的周期性变化,干季M指数的变化周期以8a和4~6a为主;雨季M指数的地区性差别比干季大。云南的严重干旱均为上年雨季(或其末期) M指数偏小、随后的干季M指数典型偏低和当年雨季开始偏晚相叠加的结果。在全球变暖背景下,云南雨季有气候变干的趋势,干季大多区域呈干旱略加强趋势。近年云南多数区域M指数的主要变化周期相继进入谷值期,并与降水偏少同步出现,导致严重干旱发生频率加大。研究结果对云南干旱预测、评估及其风险管理和应用决策具有指导性和实用性。

DOI

[ Ren J Z, Huang Z Y, Zheng J M.Analysis on drought climate change in Yunnan based on relative moisture index[J]. Chinese Journal of Agrometeorology, 2014,35(5):567-574. ]

[12]
韩元元,刘辉.云南中北部地区1954-2012年干旱评价研究[J].水资源与水工程学报,2015,22(1):111-115.利用云南中北部地区6个气象站点1954-2012年资料,选用 标准化指数计算各站点干旱指数,统计分析了云南中北部地区1954-2012年发生干旱的年份及发生不同干旱的频次。研究结果表明:①临沧站出现干旱的年 份较多,但蒙自站出现极端干旱的年份明显高于其他5站;②各站点在不同季节出现干旱的频次不同,其中腾冲在春季相比于其他5站,发生干旱的频率较高 35.6%,临沧站在夏季和冬季发生干旱频率均较大,分别为35.6%和37.9%,蒙自站在秋季发生干旱频率最大,为34.8%。研究成果可为云南中北 部地区的干旱评价分析和水资源保护提供一定的参考价值。

DOI

[ Han Y Y, Liu H.Study on evaluation of drought in central north region of Yunnan province from 1954 to 2012[J]. Journal of Water Resources & Water Engineering, 2015,22(1):111-115. ]

[13]
王佳津,孟耀斌,张朝,等.云南省Palmer 旱度模式的建立——2010年干旱灾害特征分析[J].自然灾害学报,2012,21(1):190-197.2010年春季云南省发生了特大干旱灾害,造成了严重的经济损失。按照Palmer旱度模式的思路,利用云南省的气象和土壤数据,建立了云南省的Palmer旱度模式。通过将计算得到的Palmer指数值与云南省的实际旱涝灾情历史记录进行对比,发现所建立的Palmer旱度模式能够较好地反映云南省的旱涝情况。基于该模式对2010年云南特大干旱灾害进行了特征分析,结果表明,此次干旱灾害是云南省30年来干旱变化过程中的一次突变。而且结果显示,在2010年的云南干旱灾害中,严重干旱地区整体呈现东西走向的空间分布,极端干旱地区主要分布在云南省的东南部。

[ Wang J J, Meng Y B, Zhang Z, et al. Establishment of Palmer drought severity model for Yunnan Province: analysis of characteristics of drought disaster in 2010[J]. Journalof Natural Disasters, 2012,21(1):190-197. ]

[14]
张冬冬,鲁帆,严登华,等.云南省干旱时空演变规律及季节连旱的概率特征分析[J].应用基础与工程科学学报,2014,22(4):705-717.选取云南省29个气象站点1960--2010年的降水数据,计算每个站点季尺度和年尺度的标准化降水指数(SPI),分析了云南省干旱的时空演变规律.在此基础上,利用广义极值分布(GEV)拟合季节SPI序列分布,通过离差平方和最小准则(OSL)法选择Frank Copula拟合各季节肛,二维联合概率分布,研究云南地区季节连续干旱及连续特旱事件的概率特征.研究结果表明,云南省在过去51年呈不显著变旱的趋势,其中,夏、秋和冬季发生干旱的频率均呈增加趋势,而春季发生干旱的频率呈减少趋势;春夏、夏秋和冬春连续干旱与连续特旱发生频率呈北多南少的规律,高频率地区主要集中在云南省西北、东北及中部,而秋冬连续干旱与连续特旱高频率地区则主要集中在云南省西南部.

[ Zhang D D, Lu F, Yan D H, et al. Spatio-temporal analysis of drought and the characteristic of continuous seasonal droughts probability in Yunnan province[J]. Journal of Basic Science And Engineering, 2014,22(4):705-717. ]

[15]
张雷,王杰,黄英,等.1961-2010年云南省基于SPEI的干旱变化特征分析[J].气象与环境学报,2014,31(5):141-146.近年来云南省干旱频发,给当地农业生产、经济发展和生态环境造成了严重影响。根据云南省29个水文、气象站(1961—2010年)的逐月降水、气温资料,选用综合了降水和气温变化共同效应的新的干旱表征指标—标准化降水蒸发指数(SPEI)计算云南省各地区平均SPEI-12值,对云南省1961—2010年干旱演变特征、干旱事件发生频次、干旱事件持续时间和干湿变化周期进行分析,结果表明21世纪后云南各地区无论是干旱持续时间还是干旱程度都明显增加,特别是滇东北和滇东南地区最为显著;降水是影响云南干旱的主要因素,但气温的升高加剧了云南地区的干旱化趋势;21世纪前10年云南地区总干旱事件和严重及以上程度干旱事件的发生次数都显著增加;云南省多发生持续时间超过6个月的干旱;通过小波分析得出云南省干湿变化表现为5年左右振荡周期,且未来几年云南的干旱趋势为偏旱。

[ Zhang L, Wang J, Huang Y, et al. Characteristics of drought based on standardized precipitation evapotranspiration index from 1961 to 2010 in Yunnan province[J]. Journal of Meteorology and Environment, 2015,31(5):141-146. ]

[16]
Zhang D, Yan D, Lu F, et al. Copula-based risk assessment of drought in Yunnan province, China[J]. Natural Hazards, 2015,75(3):2199-2220.Yunnan is one of the provinces which had been frequently and heavily affected by drought disasters in China. Recently, large severe droughts struck Yunnan, caused considerable social, economic and eco

DOI

[17]
Jia H, Pan D.Drought risk assessment in Yunnan province of China based on wavelet analysis[J]. Advances in Meteorology, 2016,2016(3):1-10.A wavelet transform technique was used to analyze the precipitation data for nearly 60 years (1954–2012) in Yunnan Province of China. The wavelet coefficients and the variance yield of wavelet were calculated. The results showed that, in nearly 60 years, the spring precipitation increased slightly; however, the linear trend of other seasonal and annual precipitations showed a reducing trend. Seasonal and annual precipitation had the characteristics of multiple time scales. Different time scales showed the different cyclic alternating patterns. Overall, in the next period of time, different seasons and the annual precipitation will be in the periods of precipitation-reduced oscillation; high drought disaster risks may occur in Yunnan province. Particularly, by analyzing large area of severe drought of Yunnan province in 2009–2012, the predicted results of wavelet were verified. The results may provide a scientific basis for guiding agricultural production and the drought prevention work for Yunnan Province and other places of China.

DOI

[18]
Abbas S, Nichol J, Qamer F, et al. Characterization of drought development through remote sensing: a case study in central Yunnan, China[J]. Remote Sensing, 2014,6(6):4998-5018.This study assesses the applicability of remote sensing data for retrieval of key drought indicators including the degree of moisture deficiency, drought duration and areal extent of drought within different land cover types across the landscape. A Normalized Vegetation Supply Water Index (NVSWI) is devised, combining remotely sensed climate data to retrieve key drought indicators over different vegetation cover types and a lag-time relationship is established based on preceding rainfall. The results indicate that during the major drought event of spring 2010, Evergreen Forest (EF) experienced severe dry conditions for 48 days fewer than Cropland (CL) and Shrubland (SL). Testing of vegetation response to drought conditions with different lag-time periods since the last rainfall indicated a highest correlation for CL and SL with the 4th lag period (i.e., 64 days) whereas EF exhibited maximum correlation with the 5th lag period (i.e., 80 days). Evergreen Forest, which includes tree crops, appears to act as a green reservoir of water, and is more resistant than CL and SL to drought due to its water retention capacity with deeper roots to tap sub-surface water. Identifying differences in rainfall lag-time relationships among land cover types using a remote sensing-based integrated drought index enables more accurate drought prediction, and can thus assist in the development of more specific drought adaptation strategies.

DOI

[19]
王海,杨祖祥,王麟,等.TVDI在云南2009/2010年干旱监测中的应用[J].云南大学学报(自然科学版),2014,36(1):59-65.云南2009/2010年遭遇了一次百年一遇的全省性特大旱灾,对当地的生产和人民生活造成了严重影响.笔者利用2009年11月&mdash;2010年4月NASA(美国国家航空航天局)&mdash;MODIS(中分辨率成像光谱仪)1km&times;1km分辨率的归一化植被指数(NDVI)和地表温度(LST)数据,在构建了温度植被干旱指数(TVDI)的基础上,对2009/2010年云南省干旱情况进行了反演.进一步与昆明、昭通、江城3站实测的土壤湿度数据进行比较验证后,获得了云南省2009/2010年干旱等级的时空分布情况.基于TVDI的卫星监测结果表明:从2009年11月云南进入旱季以后,全省出现大范围不同程度的干旱;2010年2月、3月干旱情况最为严重,中等干旱面积达到全省的50%以上,严重干旱面积达到全省的27%左右;严重干旱区域主要分布在云南省的中东部和南部地区;全省唯有西北的迪庆、怒江自治州较为湿润或者正常.</br>

DOI

[ Wang H, Yang Z X, Wang L, et al. The application of TVDI in drought monitoring over Yunnan Province during 2009 to 2010[J]. Journal of Yunnan University, 2014,36(1):59-65. ]

[20]
许玲燕,王慧敏,段琪彩,等.基于SPEI 的云南省夏玉米生长季干旱时空特征分析[J]. 资源科学, 2013,35(5):1024-1034.基于云南省29个典型气象站1953年-2011年的气象资料和16个州(市)1979年-2011年的玉米生产资料,分析云南省夏玉米生长季4个时间尺度的干旱风险时空变化特征,计算其标准化降水蒸散指数(Standardized Precipitation Evapotranspiration Index,SPEI),并验证了其与玉米减产率的正相关性.结果表明,SPEI能够较好地反映云南省历史干旱变化的时空特征和夏玉米的产量变化情况:①随着时间尺度的增加,SPEI值变化幅度减小,干旱频率降低、持续时间增长.3个月尺度的SPEI-3和6个月尺度的SPEI-6可体现干湿季节变化,12个月尺度的SPEI-12更能反映干旱年际变化情况;②从云南夏玉米不同生长期的干旱频率看,播种期>花丝期>成熟期;③从干旱频率空间分布特征看,总体上是滇东北>滇中>滇西南;④从年代际变化特征看,云南省玉米全生育期干旱呈加重趋势,以昆明市为例,玉米全生育期干旱指数Sep-SPEI-6最小值出现在2010年;⑤从统计分析结果看,云南省16个州(市)SPEI与玉米减产率均呈正相关关系,其中年均SPEI-3、年均SPEI-6、玉米全生育期干旱指数Sep-SPEI-6与玉米减产率相关性较大,表明了玉米生长季的干温情况对玉米产量的影响较大.

[ Xu L Y, Wang H M, Duan Q C, et al. The temporal and spatial distribution of droughts during summer corn growth in Yunnan Province based on SPEI[J]. Resources Science, 2013,35(5):1024-1034. ]

[21]
付奔,胡关东,杨帆,等.云南干旱“常态化”的分析[J].水文,2014,34(4):82-85.近年来云南持续发生严重干旱,云南干旱是否日趋“常态化”成为社会各界关心的一个热点问题,相关报道不断见诸媒体.本文从水文的角度对云南省的历史干旱、水文要素以及趋势预测等方面进行了深入的分析.在历史依据和现代气象水文观测数据的支撑下,考察近100年来全球增暖可能导致部分地区干旱化的可能,从而认为近年来提出的云南干旱“常态化”存在科学依据;但干旱“常态化”仅能局限于近现代时期这一时间范畴,对于今后更长时期云南省干旱发展趋势,依据现有技术手段及研究成果尚难以判断把握.

DOI

[ Fu B, Hu G D, Yang F, et al. Analysis of drought normalization in Yunnan province[J]. Journal of China Hydrology, 2014,34(4):82-85. ]

[22]
Vicente-Serrano S M, Beguería S, López-Moreno J I. A multi-scalar drought index sensitive to global warming: The Standardized Precipitation Evapotranspiration Index-SPEI[J]. Journal of Climate, 2010,23(7):1696-1718.

[23]
Zhao H, Gao G, An W, et al. Timescale Differences between SC-PDSI and SPEI for Drought Monitoring in China[J]. Physics & Chemistry of the Earth Parts A/b/c, 2015:1-11.The Palmer Drought Severity Index (PDSI) has been widely used to monitor drought. Its characteristics are more suitable for measuring droughts of longer timescales, and this fact has not received much attention. The Standardized Precipitation Evapotranspiration Index (SPEI) can better reflect the climatic water balance, owing to its combination of precipitation and potential evapotranspiration. In this study, we selected monthly average air temperature and precipitation data from 589 meteorological stations of China's National Meteorological Information Center, to compare the effects of applying a self-calibrating PDSI (SC-PDSI) and SPEI to monitor drought events in the station regions, with a special focus on differences of event timescale. The results show the following. 1) Comparative analysis using SC-PDSI and SPEI for drought years and characters of three dry periods from 1961 to 2011 in the Beijing region showed that durations of SC-PDSI-based dry spells were longer than those of 3-month and 6-month SPEIs, but equal to those of 12-month or longer timescale SPEIs. 2) For monitoring evolution of the fall 2009 to spring 2010 Southwest China drought and spring 2000 Huang-Huai drought, 3-month SPEI could better monitor the initiation, aggravation, alleviation and relief of drought in the two regions, whereas the SC-PDSI was insensitive to drought recovery because of its long-term memory of previous climate conditions. 3) Analysis of the relationship between SC-PDSI for different regions and SPEI for different timescales showed that correlation of the two indexes changed with region, and SC-PDSI was maximally correlated with SPEI of 9鈥19 months in China. Therefore, SC-PDSI is only suitable for monitoring mid- and long-term droughts, owing to the strong lagged autocorrelation such as 0.4786 for 12-month lagged ones in Beijing, whereas SPEI is suitable for both short- and long-term drought-monitoring and should have greater application prospects in China.

DOI

[24]
Wang K Y, Li Q F, Yang Y, et al. Analysis of spatio-temporal evolution of droughts in Luanhe River Basin using different drought indices[J]. Water Science & Engineering, 2015,8(4):282-290.Based on the monthly precipitation and air temperature from 1960 to 1989 in the Luanhe River Basin, the standardized precipitation evapotranspiration index(SPEI) and standardized precipitation index(SPI) at three- and six-month time scales and the self-calibrating Palmer drought severity index(sc-PDSI) were calculated to evaluate droughts in the study area. Temporal variations of the drought severity from 1960 to1989 were analyzed and compared based on the results of different drought indices, and some typical drought events were identified. Spatial distributions of the drought severity according to the indices were also plotted and investigated. The results reveal the following: the performances of different drought indices are closely associated with the drought duration and the dominant factors of droughts; the SPEI is more accurate than the SPI when both evaporation and precipitation play important roles in drought events; the drought severity shown by the sc-PDSI is generally milder than the actual drought severity from 1960 to 1989; and the evolution of the droughts is usually delayed according to the scPDSI. This study provides valuable references for building drought early warning and mitigation systems in the Luanhe River Basin.

DOI

[25]
Wang W, Zhu Y, Xu R, et al. Drought severity change in China during 1961-2012 indicated by SPI and SPEI[J]. Natural Hazards, 2015,75(3):2437-2451.Using monthly meteorological observation data at 633 sites in China during 1961–2012, the drought severity change has been investigated in terms of the Standardized Precipitation Index (SPI) and the Standardized Precipitation Evapotranspiration Index (SPEI) with potential evapotranspiration estimated by the Penman–Monteith equation (SPEI_pm). Significant wetting appeared to have occurred in northwestern corner of China (Xinjiang Province), especially in winter. The middle to northeastern Tibetan Plateau also experienced wetting in the last 52 years in general. Significantly, drying occurred in Central China (mostly in the middle Yellow River basin) and southwestern China (Yunnan–Guizhou Plateau) in spring and in autumn. There is no evidence of an increase in drought severity over China taking the whole country into account. On the contrary, the hyper-arid and arid zones got significantly wetter in the last 52 years as indicated by both SPI and SPEI. Copyright Springer Science+Business Media Dordrecht 2015

DOI

[26]
黄晚华,杨晓光,李茂松,等.基于标准化降水指数的中国南方季节性干旱近58a 演变特征[J].农业工程学报,2010,26(7):50-59.近年来南方地区季节性干旱频繁发生,对农业生产造成了严重影响。分析其演变特征和发生规律,能为应对全球气候变化背景下制订抗旱减灾对策提供理论依据。该研究利用中国南方15个省(市、区)的气象台站降水资料,选择采用标准化降水指数(SPI)为干旱指标,计算了南方地区最近58 a(1951-2008年)各月干旱指数,在此基础上分析了全年及各季季节性干旱的站次比(发生干旱站数与总站数之比)和干旱强度的年际变化。研究结果表明:干旱程度在时间尺度上呈不同程度增加趋势;干旱的季节性特征为春旱和秋旱有加重的趋势,而夏旱和冬旱有减轻的趋势。季节性干旱空间演变特征表现为:长江中下游地区、西南地区、华南地区等各区域季节性干旱变化与整个南方总体干旱变化表现基本一致。在当前气候变化背景下,我国南方干旱整体上呈现对农业生产的不利影响加重的趋势。研究和验证表明标准化降水指数(SPI)能很好地体现季节性干旱的年际变化特征。

[ Huang W H, Yang X G, Li M S, et al. Evolution characteristics of seasonal drought in the south of China during the past 58 years based on standardized precipitation index[J]. Transactions of the CSAE, 2010,26(7):50-59. ]

[27]
Wu Z, Mao Y, Li X, et al. Exploring spatiotemporal relationships among meteorological, agricultural, and hydrological droughts in Southwest China[J]. Stochastic Environmental Research & Risk Assessment, 2015,2016(30):1-12.It is expected that climate warming will be experienced through increases in the magnitude and frequency of extreme events, including droughts. This paper presents an analysis of observed changes and

DOI

[28]
Corresponding R P S, Kogan S R F. Vegetation and temperature condition indices from NOAA AVHRR data for drought monitoring over India[J]. International Journal of Remote Sensing, 2003,24(22):4393-4402.Not Available

DOI

[29]
Bhuiyan C, Singh R P, Kogan F N.Monitoring drought dynamics in the Aravalli region (India) using different indices based on ground and remote sensing data[J]. International Journal of Applied Earth Observation & Geoinformation, 2006,8(4):289-302.The hard-rock hilly Aravalli terrain of Rajasthan province of India suffers with frequent drought due to poor and delayed monsoon, abnormally high summer-temperature and insufficient water resources. In the present study, detailed analysis of meteorological and hydrological data of the Aravalli region has been carried out for the years 1984鈥2003. Standardised Precipitation Index (SPI) has been used to quantify the precipitation deficit. Standardised Water-Level Index (SWI) has been developed to assess ground-water recharge-deficit. Vegetative drought indices like Vegetation Condition Index (VCI) and Temperature Condition Index (TCI) and Vegetation Health Index (VHI) have been computed using NDVI values obtained from Global Vegetation Index (GVI) and thermal channel data of NOAA AVHRR satellite. Detailed analyses of spatial and temporal drought dynamics during monsoon and non-monsoon seasons have been carried out through drought index maps generated in Geographic Information Systems (GIS) environment. Analysis and interpretation of these maps reveal that negative SPI anomalies not always correspond to drought. In the Aravalli region, aquifer-stress shifts its position time to time, and in certain pockets it is more frequent. In comparison to hydrological stress, vegetative stress in the Aravalli region is found to be slower to begin but quicker to withdraw.

DOI

[30]
Hao C, Zhang J, Yao F.Combination of multi-sensor remote sensing data for drought monitoring over Southwest China[J]. International Journal of Applied Earth Observation & Geoinformation, 2015,35:270-283.Drought is one of the most frequent climate-related disasters occurring in Southwest China, where the occurrence of drought is complex because of the varied landforms, climates and vegetation types. To monitor the comprehensive information of drought from meteorological to vegetation aspects, this paper intended to propose the optimized meteorological drought index (OMDI) and the optimized vegetation drought index (OVDI) from multi-source satellite data to monitor drought in three bio-climate regions of Southwest China. The OMDI and OVDI were integrated with parameters such as precipitation, temperature, soil moisture and vegetation information, which were derived from Tropical Rainfall Measuring Mission (TRMM), Moderate Resolution Imaging Spectroradiometer Land Surface Temperature (MODIS LST), AMSR-E Soil Moisture (AMSR-E SM), the soil moisture product of China Land Soil Moisture Assimilation System (CLSMAS), and MODIS Normalized Difference Vegetation Index (MODIS NDVI), respectively. Different sources of satellite data for one parameter were compared with in situ drought indices in order to select the best data source to derive the OMDI and OVDI. The Constrained Optimization method was adopted to determine the optimal weights of each satellite-based index generating combined drought indices. The result showed that the highest positive correlation and lowest root mean square error (RMSE) between the OMDI and 1-month standardized precipitation evapotranspiration index (SPEI-1) was found in three regions of Southwest China, suggesting that the OMDI was a good index in monitoring meteorological drought; in contrast, the OVDI was best correlated to 3-month SPEI (SPEI-3), and had similar trend with soil relative water content (RWC) in temporal scale, suggesting it a potential indicator of agricultural drought. The spatial patterns of OMDI and OVDI along with the comparisons of SPEI-1 and SPEI-3 for different months in one year or one month in different years showed significantly varied drought locations and areas, demonstrating regional and seasonal fluctuations, and suggesting that drought in Southwest China should be monitored in seasonal and regional level, and more fine distinctions of seasons and regions need to be considered in the future studies of this area.

DOI

[31]
李振. 云南省干旱发生时空特征研究[D].昆明:昆明理工大学,2014.

[ Li Z.Study on the temporal and spatial distribution of drought in Yunnan Province[D]. Kunming: Kunming University of Science and Technology, 2014. ]

[32]
沙莎,郭铌,李耀辉,等.植被状态指数VCI与几种气象干旱指数的对比——以河南省为例[J].冰川冻土,2013,35(4):990-998.使用1982-2006年GIMMS AVHRR NDVI数据集与同期的CI、K、Pa、SPI、Z、PDSI等干旱指数做了对比分析, 讨论了河南省植被状态指数VCI对气象干旱的滞后效应及干旱监测能力. 结果表明: VCI指数与气象干旱指数的相关性受不同下垫面的影响较大, 农地的VCI与气象干旱指数相关性要明显高于林地, 农地VCI与气象干旱指数呈现正相关关系. 在河南省不同的作物生长阶段, VCI对气象干旱有着不同的滞后效应, 其中, 3-5月份冬小麦生长期VCI对气象条件的反应滞后1~3个月, 7、9月份夏玉米生长期VCI对气象条件的反应滞后1月. 总体上看, 结合前期的气象数据, VCI对河南省气象干旱有一定的指示作用和监测能力.

DOI

[ Sha S, Guo N, Li Y H, et al. Comparison of the vegetation condition index with meteorological drought indices: a case study in Henan Province[J]. Journal of Glaciology and Geocryology, 2013,35(4):990-998. ]

[33]
索渺清,尤卫红,马学文,等.思茅境内澜沧江径流变化量与云南气候变化的关系[J].云南地理环境研究,2005,17(3):1-8.以思茅澜沧江流域下游思茅境内水文站1960年1月~2001年 12月的逐月径流量和云南的月雨量(气温)场格点资料为基础,用相关分析的方法,研究了思茅境内澜沧江流域的东西部径流量变化及其与云南气候变化的关系. 结论为:思茅境内澜沧江下游流域的径流量变化与滇西南的降水量变化有显著的相关关系,其季节特征为春夏季较好,秋冬季次之;与元江河谷一带的气温变化也有 显著的反相关关系,其中西部流域还与滇南的气温变化有显著的相关关系,其季节特征则为冬春季较好,夏秋季不显著.20世纪80年代以来,该流域的气温变化 呈上升趋势,且西部升温的上升趋势更显著,气温上升对径流量的变化起减小的作用;20世纪90年代以来,该流域的东西部降水量变化出现了显著的差异,其东 部的降水量明显增多,与此相一致,其东部径流量变化的增幅也明显大于其西部.

DOI

[ Suo M Q, You W H, Ma X W, et al. Correlation characteristics between the Simao Lancang river flows and the climate variations in Yunnan[J]. Yunnan Geographic Environment Research, 2005,17(3):1-8. ]

[34]
陶云,樊风,段旭,等.云南不同气候带气温变化特征[J].云南大学学报(自然科学版),2013,35(5):652-660.利用云南1961—2008年逐月平均气温观测资料,分析了云南不同气候带气温的时空变化特征.结果表明:①近50年来,云南6个气候带的年平均气温总趋势上升,其中高原气候带增暖最明显.除中亚热带和北亚热带增暖突变发生在90年代外,其余气候带增暖突变都发生在80年代.②云南不同气候带年平均气温存在明显不同的年代际变化.③云南各气候带的气温变化对全球气候变暖有较好的正响应.各个气候带年平均气温在全球气候偏冷期(偏暖期)较多年平均偏低(高).④云南各气候带气温变化与亚洲极涡的强度、面积,西太平洋副高的面积、强度、位置及印缅槽、西藏高原高度和均有非常显著的相关关系.在1961—2008年间亚洲极涡面积减小,强度减弱,冷空气偏弱;西太平洋副高面积增大,强度增强,西伸脊点偏西;印缅槽减弱;西藏高原高度和增加,不利于水汽向云南输送,这些因子的这种变化可能是引起云南各个气候带气温明显增加的主要原因之一.

DOI

[ Tao Y, Fan F, Duan X, et al. On the features of temperature variations indifferent climate zones in Yunnan[J]. Journal of Yunnan University, 2013,35(5):652-660. ]

[35]
段琪彩,黄英,王杰,等.云南省干旱时空分布规律[J].水电能源科学,2014,32(8):1-4.干旱是云南省主要自然灾害,开展干旱时空分布规律研究很有必要。基于196个水文气象台站降水量资料,以降水量距平百分率(Pa)为指标划分干旱等级,统计各级别干旱发生频次,并利用ArcGIS生成不同级别干旱频次栅格图。结果表明,云南省轻度、中度、严重、特大干旱的平均频次分别为15.8%、5.8%、1.7%、2.3%;春、秋两季轻度干旱发生频次较高,高频次区域面积分别占全省的77.4%、51.1%;冬季发生中度及以上干旱的频次明显偏高,其中中度、严重、特大干旱的平均频次分别为11.2%、4.8%、7.9%,且中高频次的严重干旱、特大干旱基本发生在冬季。可见云南省干旱时空分布差异明显,春、秋两季易发生轻度干旱,冬季各级别干旱均易发生,夏季不易发生干旱;轻度干旱高频次区分布于全省各地;中度和严重干旱高频次区域主要位于滇中、滇西南、滇东南和滇中偏西北地区,特大干旱高频次区域分别位于滇中北部和滇西南地区。

[ Duan Q C, Huang Y, Wang J, et al. Study on spatial and temporal distribution of drought in Yunnan Province[J]. Water Resources and Power, 2014,32(8):1-4. ]

Outlines

/