Orginal Article

Impacts of the Forests and Built-up Areas on the Spatial Distribution of Aerosol in Xiamen City

  • ZHAO Yanchuang , 1, 2 ,
  • ZHAO Xiaofeng , 1, 2, * ,
  • LIU Lele 1, 2, 3 ,
  • LIU Mengyue 4
Expand
  • 1. Key Lab of Urban Environment and Health, Institute of Urban Environment, Chinese Academy of Sciences, Xiamen 361021, China
  • 2. Xiamen Key Lab of Urban Metabolism, Xiamen 361021, China
  • 3. University of Chinese Academy of Sciences, Beijing 10049, China
  • 4. College of the Environment and Ecology, Xiamen University, Xiamen 361102, China
*Corresponding author: ZHAO Xiaofeng, E-mail:

Received date: 2016-01-04

  Request revised date: 2016-02-17

  Online published: 2016-12-20

Copyright

《地球信息科学学报》编辑部 所有

Abstract

Analyzing factors that affecting the spatial distribution of aerosol can help researchers to understand the changing mechanism of aerosol, which provides a scientific reference for regulating the atmospheric quality. In this research, taking Xiamen city as a case study, the MODIS -Aqua and Landsat8 OLI images were used in the aerosol optical depth (AOD) inversion and land cover classification, respectively. Then, the impacts of forests and built-up areas on the spatial distribution of aerosol were compared by employing the correlation analysis, the simple linear regression model and the variation partitioning. It is concluded that: (1) the combination of Dark Dense Vegetation (DDV) algorithm and the interpolation method was appropriate for the computation of AOD inversion during the spring season in Xiamen; (2) the AOD for the built-up areas was significantly higher than that for the forests; and (3) the forests had more impacts on the spatial distribution of aerosol than the built-up areas. Results of this study have significances and referential values for the improvement of urban atmospheric quality and ecological environment.

Cite this article

ZHAO Yanchuang , ZHAO Xiaofeng , LIU Lele , LIU Mengyue . Impacts of the Forests and Built-up Areas on the Spatial Distribution of Aerosol in Xiamen City[J]. Journal of Geo-information Science, 2016 , 18(12) : 1653 -1659 . DOI: 10.3724/SP.J.1047.2016.01653

1 引言

随着中国经济和城市化的迅速发展,大气污染已成为当前最严重的环境问题之一[1-2],其中气溶胶颗粒是影响大气环境质量的重要污染物。气溶胶颗粒包含多种有害物质,会引发人类呼吸系统疾病和心血管疾病[3]。同时,大气气溶胶还会导致灰霾、酸雨、光化学烟雾等灾害[4],严重影响生态环境。研究大气气溶胶时空分布及变化机制无疑对城市可持续发展具有重要意义,因而受到了学者们的广泛关注。
气溶胶光学厚度(Aerosol Optical Depth,AOD)或(Aerosol Optical Thickness,AOT)是指整层气溶胶的消光系数在垂直方向上的积分,它能够反映大气的污染程度,对评价大气环境具有重要意义[5]。国内外研究表明,城市中的林地和建设用地与大气气溶胶浓度密切相关[6-13]。城市林地对大气气溶胶具有显著的阻滞、截留效果,甚至可以直接吸收和降解[6-8]。例如,Cornejo等[7]和Simonich等[8]均发现林地可以清除形成大气气溶胶的有机污染物;McDonald等[9]研究发现在英国的城市地区增加林地面积可以有效地减少大气颗粒物。而城市建设用地由于人类活动频繁,是大气气溶胶的重要来源[10]。彭威[11]和孙娜[12]分别研究了长江三角洲和珠江三角洲地区大气气溶胶与区域下垫面的关系,均发现建设用地上空的气溶胶浓度明显高于林地、草地和耕地上空的浓度;岳辉[13]对武汉市PM10浓度和土地覆被的相关分析发现PM10浓度与建设用地面积面积比例呈极显著正相关关系。
目前学者们虽然研究了城市中林地和建设用地对大气气溶胶的影响,但关于二者对大气气溶胶影响程度的对比研究相对较少。而城市林地和建设用地作为城市最重要土地覆被类型的组成部分,在全球城市化过程中,正发生着显著变化[14]。对比研究二者对大气气溶胶的影响,有助于了解城市化过程中大气气溶胶变化的驱动因素,更深入地明确大气气溶胶的变化机制与规律,从而为大气环境质量的调控提供科学依据。
本文以厦门市为例,利用MODIS-Aqua卫星遥感影像反演了大气气溶胶光学厚度,同时选取Landsat8 OLI卫星数据进行土地覆被分类。在此基础上,利用相关分析、一元线性回归模型和方差分解,对比研究了林地和建设用地对大气气溶胶变化的驱动作用,以期为缓解城市大气污染、改善城市生态环境提供科技支撑。

2 研究区概况

厦门市位于东经118°03′~118°13′,北纬24°26′~24°28′之间,地处中国东南沿海,属于亚热带海洋性季风气候,温和多雨,年平均降雨量在1200 mm左右,年平均气温在21 ℃左右。至2014年末,全市土地面积1699.39 km²,常住人口数量381万人[15]。厦门市共有24个街道、13个镇,以及4个面积较大的农、林场,由此共得到41个分析单元,如图1所示,其基本统计信息如表1所示。厦门大气环境质量相对较好,然而随着城市建设以及工业化的迅速发展,加之全国灰霾常态化这一趋势,厦门大气环境问题也愈发严重。2014年初,厦门遭遇其历史上延续时间最长、强度最大的一次灰霾[16]。良好的环境质量是厦门城市竞争力中最重要的要素的之一,研究其大气气溶胶的变化机制与规律,进而为改善厦门大气环境质量提供决策支持,无疑具有十分重要的意义。
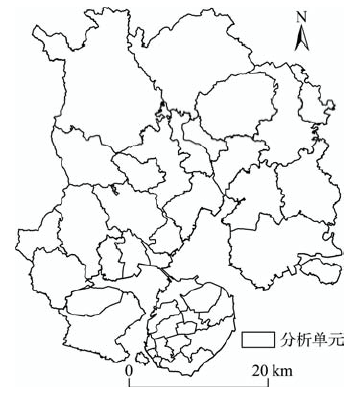
Fig.1 Analytical units in the study area

图1 研究区分析单元

Tab.1 Descriptive statistics of the analytical units

表1 分析单元的基本统计信息

平均值 标准差 最大值 最小值
面积/km2 39.02 40.81 211.45 1.45
林地面积比例/(%) 24.77 28.41 97.81 0.10
建设用面积比例/(%) 45.78 27.01 93.97 0.99
气溶胶光学厚度 0.94 0.50 2.75 0.11

3 研究方法

3.1 数据源与图像预处理

研究使用的遥感影像数据主要来自美国国家航空航天局(NASA)发布的MODIS-Aqua数据和美国地质调查局(USGS)发布的Landsat8 OLI数据。Aqua和Landsat8分别于2002年和2013年发射,其中Aqua卫星搭载的中分辨率成像光谱仪(MODIS)不仅可以获取从可见光到近红外共36个光谱波段的信息,还具有较高的时间分辨率,适合大气气溶胶光学厚度的反演和变化研究。而Landsat8搭载的陆地成像仪的空间分辨率为30 m,具有9个常用通道,是城市尺度土地利用/覆被研究常用数据。
厦门冬春季的气溶胶浓度较高[17],分析这2个季节气溶胶空间分布的影响因素更具有意义。另外,为减少风对气溶胶空间分布的影响,结合气象条件和卫星影像质量,分别选取了2014年4月15日MODIS-Aqua和2014年4月17日Landsat8 OLI的卫星遥感影像(表2)。2幅影像中的研究区均居于各自卫星轨道中心附近,且风速较低,同时天气晴朗、空气质量等级均为良,大气可见度高,总体成像条件和质量较好。2幅影像在几何精纠正过程中均采用WGS-84椭球地理坐标系,并投影到UTM N50带平面坐标系。
Tab.2 Meteorological condition when the images were derived

表2 影像获取时的气象条件

卫星传感器 日期 平均风速/(m/s) 空气质量指数(AQI) 平均相对湿度/(%) 平均气温/℃
MODIS-Aqua 2014-04-15 2.8 60 52% 19.7
Landsat8 OLI 2014-04-17 2.6 54 74% 23.9

3.2 大气气溶胶光学厚度反演

利用MODIS-Aqua卫星遥感影像,根据暗像元算法反演大气气溶胶光学厚度[18]。该原理的理论依据是暗像元(浓密植被)在红蓝波段的反射率相对很低,容易比较精确地从传感器获得的各类信息中将地表和大气的贡献区分开来。具体步骤为:①基于IDL和MATLAB平台,利用6S辐射传输模型计算不同卫星观测条件下,气溶胶光学厚度与大气参数之间的对应关系,建立气溶胶光学厚度查找表。②利用MODIS影像2.1 μm波段提取暗像元,根据暗像元可见光波段与该波段的线性关系,计算红波段地表反射率,并将其从红波段的表观反射率中去除,获取大气参数。进而根据影像数据中的观测几何参数和所建立的查找表,得到暗像元区1 km空间分辨率的气溶胶光学厚度。之后根据反距离加权法进行插值,得到亮像元区的气溶胶光学厚度,最终结果如图2(a)所示。③利用NASA的MODIS气溶胶光学厚度产品对反演结果进行验证,并使用ArcGIS 10.0提取各分析单元中气溶胶光学厚度的基本统计信息,如表1所示。
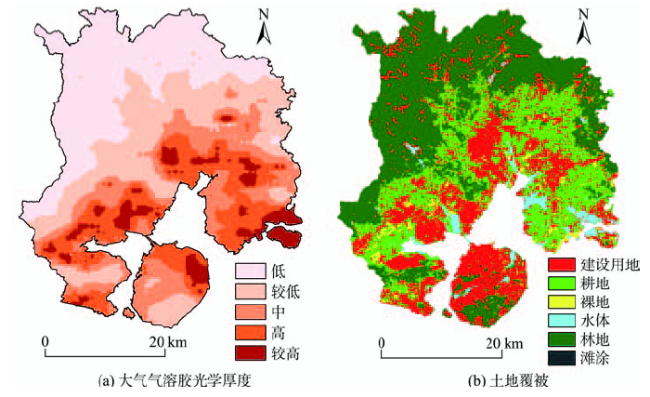
Fig.2 Spatial distribution of AOD and land covers in the study area

图2 研究区大气气溶胶光学厚度空间分布和土地覆被

3.3 林地和建设用地信息提取

监督分类是遥感图像分类中应用最广泛、最成熟的方法之一,其中最大似然算法被认为是分类精度较高的方法[19]。根据其原理,利用Landsat8 OLI影像,参考中华人民共和国国家标准《GB-T21010-2007》的土地利用现状分类系统,并结合厦门市土地覆被实际情况,将地表划分为建设用地、耕地、林地、水体、裸地和滩涂6种类型,如表3所示。然后利用ENVI 4.8在研究区内选择各类别的训练样本,估计其均值和协方差,完成整个研究区的分类,结果如图2(b)所示。最后,利用Fragstats 4.2分别提取各分析单元中林地和建设用地面积所占百分比的基本统计信息,如表1所示。
Tab.3 Description of the land use/cover types

表3 土地利用/覆被类型说明

类别 主要组成
建设用地 城乡商住用地、交通运输用地、工矿仓储用地等
耕地 水田、旱地等耕地以及果园等
林地 乔木、灌木林地、草地等
水体 海洋、河流、湖泊、水库、人工沟渠等
裸地 裸土、裸岩、沙滩等
滩涂 生长沼生、湿生植物的土地

3.4 统计分析

3.4.1 相关分析与一元线性回归模型
为评估林地和建设用地面积比例对气溶胶光学厚度的影响,首先利用Pearson相关分析确定二者是否与气溶胶光学厚度存在显著的相关关系。在此基础上,分别以二者为自变量,以气溶胶光学厚度为因变量,建立一元线性回归模型[20-21],分析二者对气溶胶的影响。
3.4.2 方差分解
为比较林地和建设用地解释气溶胶变化时的相对重要性,本文采用方差分解方法[20],分别计算二者对气溶胶变化的解释度,并据此分析二者对大气气溶胶变化的驱动作用。统计分析主要使用的软件是SPSS 20.0。

4 结果分析与讨论

4.1 大气气溶胶光学厚度反演精度验证

利用ArcGIS 10.0产生20个随机点,分别提取反演的气溶胶光学厚度值和MODIS气溶胶产品光学厚度值,得到二者的散点图如图3所示。可以看出,反演AOD与MODIS AOD产品的相关系数为0.8503,显著水平小于0.01,呈极显著相关,与王中挺等[22]、段文举等[23]的研究结果相近。良好的相关性表明,反演结果适合用于厦门大气气溶胶光学厚度研究。
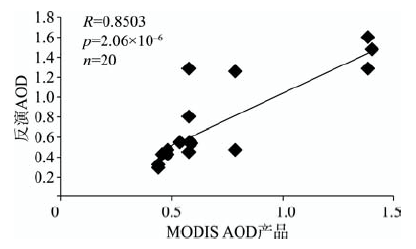
Fig.3 Comparison between the inversion AOD and MODIS AOD products

图3 反演结果与MODIS AOD产品的对比

注:R表示相关系数,p表示显著水平,n表示样点数目

4.2 林地和建设用地上空气溶胶光学厚度分布特征

图2(a)显示了2014年4月15日厦门大气气溶胶光学厚度的空间分布。为便于分析,根据AOD值的统计分布进行阈值分割,划分成5个等级,其中所使用的阈值如表4所示。由图2(a)、(b)可看出,在城市化水平较高的厦门本岛内,面积较大的林地主要分布在南部的东坪山脉和西部的仙岳山、狐尾山等,其上空的气溶胶光学厚度处于较低等级;而建设用地上空气溶胶光学厚度大部分处于中高等级,尤其是本岛东北部,气溶胶光学厚度值最大,等级最高。同样,在本岛外的大陆地区,北部林地上空气溶胶光学厚度处于低等级,各市辖区的城区内气溶胶光学厚度处于高等级。
Tab.4 Thresholds used in the segmentation of AOD

表4 气溶胶光学厚度等级划分中所使用的阈值

AOD值范围 等级 代表意义
<0.5 1
0.5-1.0 2 较低
1.0-1.5 3
1.5-1.7 4
>1.7 5 较高
造成林地和建设用地上空气溶胶光学厚度显著差异的主要原因是林地对大气气溶胶具有显著的阻滞、截留效果。林地植被叶片表面具有一定的湿润度和粗糙度,非常适合气溶胶的沉积[24]。同时,植被还可以增加地表粗糙度,为气溶胶沉降提供有利条件[25]。此外,还有研究表明植物和大气之间的物质能量交换,可以促进大气中一些气溶胶颗粒的直接吸收和降解[26]。而建设用地表面,人类活动强烈,人为源气溶胶浓度大,同时高大密集的建筑会影响气溶胶的扩散,导致气溶胶光学厚度处于高等级。

4.3 相关分析与一元线性回归模型

林地和建设用地面积比例与气溶胶光学厚度的相关分析结果如表5所示,可以看出,林地面积比例和建设用地面积比例与气溶胶光学厚度的Pearson相关系数均通过了双尾显著性检验。其中,林地面积比例与气溶胶光学厚度呈极显著负相关,建设用地面积比例与气溶胶光学厚度呈极显著正相关,且前者相关性强于后者。在此基础上,建立了两个一元线性回归模型,结果如表6所示,两个模型的显著性水平均小于0.01,说明林地和建设用地面积比例与气溶胶光学厚度均呈极显著的线性关系,而两个模型中的回归系数也都达到了极显著水平,进一步证明了模型的合理性。模型的回归系数表明林地面积比例每增加10%,气溶胶光学厚度减少0.11;而建设用地面积比例每增加10%,气溶胶光学厚度则增加0.08。
Tab.5 Correlation coefficients between AOD and the percentage of forest and built-up area

表5 林地和建设用地面积比例与气溶胶光学厚度的相关分析结果

林地面积比例 建设用地面积比例
相关系数 -0.863 0.546
显著性水平(双尾) 2.24×10⁻⁴ 1.29×10⁻¹¹
Tab.6 Results of the simple linear regression models

表6 一元线性回归模型结果

模型 因变量 回归系数 回归系数显著性水平 模型显著性水平 R2
1 AOD 常数 1.360 3.83×10⁻²⁷ 0.00 0.745
林地面积比例 -0.011 1.29×10⁻¹¹
2 AOD 常数 0.787 1.02×10⁻⁹ 0.00 0.298
建设用地面积比例 0.008 2.24×10⁻⁴

4.4 方差分解

由对气溶胶光学厚度变化进行方差分解的结果(图4)可看出,林地和建设用地可分别解释气溶胶变化的45.3%和0.6%,且在解释大气气溶胶的空间变化时,林地明显比建设用地重要;林地和建设用地的共同作用可以解释气溶胶变化的29.2%,这由林地和建设用地之间的自相关引起;此外,有24.9%的气溶胶变化林地和建设用地不能解释。
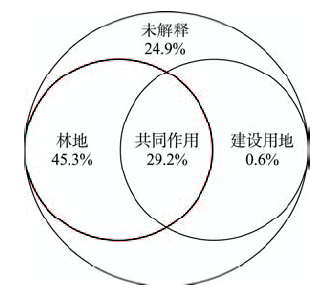
Fig.4 The partitioning results for the variation of AOD

图4 气溶胶变化的方差分解结果

综上所述,从与气溶胶光学厚度的相关关系来看,林地强于建设用地。而回归模型的结果显示,林地和建设用地面积比例变化相同时,前者引起气溶胶的变化是后者的1.38倍。另外,方差分解的结果表明林地单独解释气溶胶变化的面积比例是建设用地的75倍。由此可见,林地对气溶胶的影响作用强于建设用地。

4.5 讨论

本研究基于遥感影像,获取了厦门大气气溶胶光学厚度和土地覆被信息,利用统计分析研究了城市林地与建设用地对大气气溶胶的影响,发现林地对气溶胶的影响作用强于建设用地。但研究中存在着一些不足,给该结果带来了一定的不确定性。① 研究中仅反演了一天的气溶胶光学厚度,不能全面反映厦门市气溶胶的空间分布情况;② 研究中利用插值法得到亮像元区的气溶胶光学厚度,会引入额外的误差;③ 对气溶胶光学厚度的反演结果验证时,由于厦门地区没有NASA的地基气溶胶观测站,缺少实际测量值,所以使用了MODIS的AOD产品进行验证,会影响反演精度的分析结果。鉴于此,在下一步的研究中使用多年不同季节的卫星数据,同时开发精度更好的气溶胶反演算法和验证方法,使反演结果更接近气溶胶的实际空间分布,以便进行更为准确、细致深入的分析。

5 结论

本文以厦门市为例,利用MODIS-Aqua卫星遥感影像,反演了大气气溶胶光学厚度。同时,选取Landsat8 OLI卫星数据进行土地覆被分类。在此基础上,利用相关分析、一元线性回归模型和方差分解,对比研究了林地和建设用地对大气气溶胶变化的影响作用,得出以下结论:① 暗像元与插值法的结合适合厦门地区春季气溶胶光学厚度的反演;②气溶胶的空间分布与城市林地和新建成区的格局一致;③ 林地对气溶胶的影响作用强于建设用地。
本研究对明确城市大气气溶胶的变化规律与机制、缓解城市大气污染和改善城市生态环境具有重要参考价值和意义。

The authors have declared that no competing interests exist.

[1]
Guo J, Zhang X, Wu Y, et al. Spatio -temporal variation trends of satellite -based aerosol optical depth in China during 1980-2008[J]. Atmospheric Environment, 2011,45(37):6802-6811.This paper analyzes TOMS AOD at 500 nm (1980-2001), along with MODIS data (2000-2008) at 550 nm to investigate variations at one-degree grid over eight typical regions in China and the trends in AODs, temporally and spatially. In contrast to recently reported global decrease in AOD over global ocean beginning around 1990, we find there virtually exists no apparent AOD transition in China for that: firstly no notable upward tendencies in AOD during 1980-1992 for the relative low value (+0.001/decade), then during 1996-2001 a discernible ascending tendency with larger magnitude at 0.01/decade, and finally, since 2000, a weak upward trend with +0.004/decade. The large increases during 1996-2001 are presumably consequences of large increases in industrial activities and bear a strong resemblance to the long-term decreasing observations of incident solar radiation and cloud cover in China. Specifically, in late 1990's, only in Taklimakan Desert a negative trend with a maximum magnitude of -0.04/decade is detected. However, over regions such as Jingjinji and Pearl River Delta influenced by industrial activities, positive tendencies at +0.01/decade are observed.<br/>Seasonal patterns in the AOD regional long-term trend are evident. AODs exhibit generally similar seasonality and the summer dominates higher AOD value than the autumn. In particular, during the period 1980-2001, all the eight regions except Taklimakan Desert witness the maximum aerosols in winter while there is not such seasonality during the period 2000-2008. Geographically, we also document spatial patterns of AOD variations over China. Results reveal that no apparent upward trends in AOD (about 15% per decade) are observed in 1980's, while beginning 1990 till 2008, both data (TOMS and MODIS) are indicative of a significant AOD increase across China, especially in 1990's it is indeed the case, roughly in accordance with the overall trends at regional scale. (C) 2011 Elsevier Ltd. All rights reserved.

DOI

[2]
Zhang F, Xu L, Chen J, et al. Chemical characteristics of PM2.5 during haze episodes in the urban of Fuzhou, China[J]. Particuology, 2013,11(3):264-272.Atmospheric fine particles (PM2.5) were collected in this study with middle volume samplers in Fuzhou, China, during both normal days and haze days in summer (September 2007) and winter (January 2008). The concentrations, distributions, and sources of polycyclic aromatic hydrocarbons (PAHs), organic carbon (OC), elemental carbon (EC), and water soluble inorganic ions (WSIIs) were determinated. The results showed that the concentrations of PM2.5, PAHs, OC, EC, and WSIIs were in the orders of haze > normal and winter > summer. The dominant PAHs of PM2.5 in Fuzhou were Fluo, Pyr, Chr, BbF, BkF, BaP, BghiP, and IcdP, which represented about 80.0% of the total PAHs during different sampling periods. The BaPeg concentrations of Sigma PAHs were 0.78, 0.99, 1.22, and 2.43 ng/m(3) in summer normal, summer haze, winter normal, and winter haze, respectively. Secondary pollutants (SO42- NO3-, NH4+, and OC) were the major chemical compositions of PM2.5, accounting for 69.0%, 55.1%, 63.4%, and 64.9% of PM2.5 mass in summer normal, summer haze, winter normal, and winter haze, respectively. Correspondingly, secondary organic carbon (SOC) in Fuzhou accounted for 20.1%, 48.6%, 24.5%, and 50.5% of OC. The average values of nitrogen oxidation ratio (NOR) and sulfur oxidation ratio (SOR) were higher in haze days (0.08 and 0.27) than in normal days (0.05 and 0.22). Higher OC/EC ratios were also found in haze days (5.0) than in normal days (3.3). Correlation analysis demonstrated that visibility had positive correlations with wind speed, and negative correlations with relative humidity and major air pollutants. Overall, the enrichments of PM2.5, OC, EC, SO42-, and NO3- promoted haze formation. Furthermore, the diagnostic ratios of IcdP/(IcdP + BghiP), IcdP/BghiP, OC/EC, and NO3-/SO42- indicated that vehicle exhaust and coal consumption were the main sources of pollutants in Fuzhou. (C) 2012 Chinese Society of Particuology and Institute of Process Engineering, Chinese Academy of Sciences. Published by Elsevier B.V. All rights reserved.

DOI

[3]
Auger F, Gendron M C, Chamot C, et al. Responses of well-differentiated nasal epithelial cells exposed to particles: role of the epithelium in airway inflammation[J]. Toxicology and Applied Pharmacology, 2006,215(3):285-294.Numerous epidemiological studies support the contention that ambient air pollution particles can adversely affect health. To explain the acute inflammatory process in airways exposed to particles, a number of in vitro studies have been performed on cells grown submerged on plastic and poorly differentiated, and on cell lines, the physiology of which is somewhat different from that of well-differentiated cells. In order to obtain results using a model system in which epithelial cells are similar to those of the airway in vivo, apical of well-differentiated nasal epithelial (HNE) cells cultured in an air-liquid interface (ALI) were exposed for 24 h to diesel exhaust particles (DEP) and Paris urban air particles (PM(2.5)). DEP and PM(2.5) (10-80 microg/cm(2)) stimulated both and amphiregulin (ligand of ) exclusively towards the basal compartment. In contrast, there was no and only weak non-reproducible of . and were consistently stimulated towards the apical compartment and only when cells were exposed to PM(2.5). protein expression on remained low after particle exposure, although it increased after treatment. Internalization of particles, which is believed to initiate oxidative stress and proinflammatory cytokine expression, was restricted to small nanoparticles (< or =40 nm). Production of reactive oxygen species (ROS) was detected, and DEP were more efficient than PM(2.5). Collectively, our results suggest that airway epithelial cells exposed to particles augment the local in the lung but cannot alone initiate a systemic .

DOI PMID

[4]
曾凡刚,王玮,杨忠芳,等.大气气溶胶酸度和酸化缓冲能力研究[J].中国环境监测,2001,17(4):13-16.为了掌握大气气溶胶与酸性降水的关系,分析和研究了中国北方和南 方不同观测点可吸入颗粒物(PM10)的酸度,并利用微量酸碱滴定的方法测定了其酸化缓冲能力.结果表明大气气溶胶具有一定的酸度,同时对酸化的缓冲能力 非常低,甚至可以促进降水的酸化,这种污染特征也是上述观测点发生酸性降水的重要原因之一.

DOI

[ Zeng F G, Wang W, Yang Z F, et al. Study and analysis of acidifying buffer capacity of aerosols[J]. Environmental Monitoring in China, 2001,17(4):13-16. ]

[5]
施成燕. 长江三角洲地区大气气溶胶光学厚度的遥感监测[D].南京:南京大学, 2011.

[ Shi C Y.Monitoring atmospheric aerosol optical depth in Yangtze River delta using remote sensor data[D]. Nanjing: Nanjing University, 2011. ]

[6]
Sehmel G A.Particle and gas dry deposition: a review[J]. Atmospheric Environment, 1980,14(9):983-1011Published numerical values of particle and gas dry deposition velocities are summarized, but results have not been generalized. The deposition velocities for particles range over three orders of magnitude and the deposition velocities for gases range over four orders of magnitude. For numerical prediction purposes, a model developed by Sehmel and Hodgson is recommended.

DOI

[7]
Cornejo J J, Munoz F G, Ma C Y, et al. Studies on the decontamination of air by plant[J]. Ecotoxicology, 1999,8:311-320.We conducted laboratory tests with six species of plants to determine their ability to remove benzene, trichloroethylene (TCE) and toluene from air. The objective of this proof-of-principal study was to evaluate the idea that phytoremediation techniques might be used to lower the concentrations of indoor air pollutants, such as volatile or semi-volatile organic compounds. Plants were exposed to the pollutants singly or in mixtures in an airtight chamber, and concentrations of the pollutants in the chamber were monitored through time to assess plant effects on the pollutants. In several experiments, we measured air temperature and CO 2 , as well. Lower surfaces of leaves of several of the species we tested were also examined by scanning electron microscopy to determine stomate abundance and size, and to provide information about leaf-surface elemental composition (by X-ray emission spectroscopy). Several of the species demonstrated an extensive ability to remove benzene from air. Gas chromatography methods allowed a reasonably direct, continuous monitoring of the kinetics and overall efficiency of the pollutant-removal process. We found that pollutant removal efficiency varied in response to plant species and the pollutant. Of the pollutants tested, benzene was most efficiently removed from air by Pelargonium domesticum, Ficus elastica and Chlorophytum comosum. Kalanchoe blossfeldiana, a common ornamental plant, appeared to take up benzene selectively over toluene, and TCE was removed efficiently from the air by C. comosum. Pentane, sometimes used as an internal standard in GC/MS , was removed from air by at least four of the species. For C. comosum, TCE appeared to lower the removal rates of benzene and pentane. Low-vacuum scanning electron microscopy provided information on stomate size and density and permitted rapid initial elemental analysis of the plant-leaf surface by X-ray emission spectroscopy. Our results indicate that simple tests for pollutant uptake, morphological and chemical features of plants, and plant detoxification enzyme activity might be used in multivariate fashion to identify plant species capable of removing volatile or semi-volatile pollutants from air.

DOI

[8]
Simonich S T, Hiets R A.Importance of vegetation in removing polycyclic aromatic-hydrocarbons from the atmosphere[J]. Nature, 1994,370:49-51.

[9]
Mcdonald A G, Bealey W J, Fowler D, et al. Quantifying the effect of urban tree planting on concentrations and depositions of PM10 in two urban conurbations[J]. Atmospheric Environment, 2007,41:8455-8467.Trees are efficient scavengers of particulate matter and are characterised by higher rates of dry deposition than other land types. To estimate the potential of urban tree planting for the mitigation of urban PM<sub>10</sub> concentrations, an atmospheric transport model was used to simulate the transport and deposition of PM<sub>10</sub> across two UK conurbations (the West Midlands and Glasgow). Tree planting was simulated by modifying the land cover database, using GIS techniques and field surveys to estimate reasonable planting potentials. The model predicts that increasing total tree cover in West Midlands from 3.7% to 16.5% reduces average primary PM<sub>10</sub> concentrations by 10% from 2.3 to 2.1&#xA0;μg&#xA0;m<sup>&minus;3</sup> removing 110&#xA0;ton per year of primary PM<sub>10</sub> from the atmosphere. Increasing tree cover of the West Midlands to a theoretical maximum of 54% by planting all available green space would reduce the average PM<sub>10</sub> concentration by 26%, removing 200&#xA0;ton of primary PM<sub>10</sub> per year. Similarly, for Glasgow, increasing tree cover from 3.6% to 8% reduces primary PM<sub>10</sub> concentrations by 2%, removing 4&#xA0;ton of primary PM<sub>10</sub> per year. Increasing tree cover to 21% would reduce primary PM<sub>10</sub> air concentrations by 7%, removing 13&#xA0;ton of primary PM<sub>10</sub> per year.

DOI

[10]
Seto K C, Shepherd M J.Global urban land-use trends and climate impacts[J]. Current Opinion in Environmental Sustainability, 2009,1:89-95.lt;p id="">In 2008, the global urban population exceeded the nonrural population for the first time in history, and it is estimated that by 2050, 70% of the world population will live in urban areas, with more than half of them concentrated in Asia. Although there are projections of future urban population growth, there is significantly less information about how these changes in demographics correspond with changes in urban extent. Urban land-use and land-cover changes have considerable impacts on climate. It has been well established that the urban heat island effect is more significant during the night than day and that it is affected by the shape, size, and geometry of buildings as well as the differences in urban and rural gradients. Recent research points to mounting evidence that urbanization also affects cycling of water, carbon, aerosols, and nitrogen in the climate system. This review highlights advances in the understanding of urban land-use trends and associated climate impacts, concentrating on peer-reviewed papers that have been published over the last two years.

DOI

[11]
彭威,江洪,肖钟湧,等.长三角地区土地覆盖对气溶胶光学厚度的影响[J].环境科学与技术,2014,37(6):177-182.文章利用MODISL1B数据和NASA的V5.2气溶胶光学厚度反演算法反演了长江三角洲地区的高空间分辨率的气溶胶光学厚度,反演结果与CE-318地基观测数据的进行对比验证,两者的相关系数在0.7以上,反演结果精度良好,表明MODIS反演高空间分辨率气溶胶光学厚度的可行性。利用反演的高空间分辨率气溶胶光学厚度,结合长江三角洲地区地表覆盖数据,建立两者的交Y-YU联表,分析了长江三角洲地区的气溶胶光学厚度和地表覆盖类型变化的关系:地表覆盖类型的变化驱动着气溶胶光学厚度的变化,森林、草原等植被覆盖度高的地区,气溶胶光学厚度值要低于城镇等人为活动较高地区。

[ Peng W, Jiang H, Xiao Z Y, et al. Influence of land cover on the aerosol optical thickness over Yangtze River delta[J]. Environmental Science & Technology, 2014,37(6):177-182. ]

[12]
孙娜. 珠三角地区可吸入颗粒物的遥感监测及其与下垫面的相关性分析[D].北京:中国地质大学(北京),2013.

[ Sun N. Using satellite remote sensing data for monitoring PM10 in the Pearl River Delta and study on the correlation between PM10 and underlying surface[D]. Beijing: China University of Geoscience (Beijing), 2013. ]

[13]
岳辉. 武汉市大气PM10浓度空间分布特征及其影响因素研究[D].武汉:华中农业大学,2012.

[ Yue H.Research on the spatial distribution characteristic and its influencing factors of atmospheric PM10 concentration in Wuhan City[D]. Wuhan: Huazhong Agricultural University, 2012. ]

[14]
Zhao X, Huang J, Ye H, et al. Spatiotemporal changes of the urban heat island of a coastal city in the context of urbanization[J]. International Journal of Sustainable Development & World Ecology, 2010,17(4):311-316.This study quantitatively analysed the spatiotemporal changes of the urban heat island (UHI) of Xiamen City in the context of urbanisation, using Landsat Thematic Mapper (TM) and Enhanced Thematic Mapper Plus (ETM+) thermal images acquired on similar dates in the winter of 1987, 1992, 1997, 2002 and 2007. UHI intensity and extent were used to quantify the changes, together with landscape metrics PLAND, PD, CA, NP, P-UHI, NP-UHI, PD-UHI, etc. The results show that the winter UHI of Xiamen has become more and more striking in the past 20 years in almost all the indices used. The UHI intensity increased to over 10掳C, and UHI extent and thermal patch number also increased remarkably. At the same time, UHI was more dominated and fragmented by high-grade thermal patches. In winter these UHI formed several hot spots and areas of significance, distributed along the coastline. This pattern was related to industrial zones and large infrastructure constructed in coastal areas during the rapid course of urbanisation, since both large impervious ground surfaces, large-sized and endothermic factory building roofs were the sources of these hot spots. A similar seasonal analysis was also carried out, which proved that autumn UHI was most intense in Xiamen and the change in season does not change the number of UHI areas of significance.

DOI

[15]
百度百科. 厦门[EB/OL]., 2015-12-07.

[Baidu Baike. Xiamen[EB/OL]. , 2015-12-07.]

[16]
厦门网.厦门遭遇史上最大雾霾,连续6天轻度污染 [EB/OL]., 2014-01-04/2015-12-07.

[Xiamen Site. Xiamen suffered the intensest haze in the past years and had been polluted for 6 days[EB/OL]. , 2014-01-04/2015-12-07. ]

[17]
庄马展. 厦门大气气溶胶的化学特征[J].中国科学院研究生院学报,2007,24(5):657-660.于2004年至2005年采集厦门市3个代表性季节大气气溶胶 PM10样品,利用X-射线荧光光谱、离子色谱、热光碳分析仪分析其主要化学成分.结果表明:气溶胶的化学成分浓度呈现春季最高、冬季次之,夏季最低的季 节变化特征.其中,二次离子SO42-、NO3-与NH4+约占总质量浓度的40%,总碳TC占21%,Al、Si、Ca和Fe等地壳元素仅占13%,海 盐离子占7%.二次离子污染是影响厦门环境空气质量的主要因子.

DOI

[ Zhuang M Z.Chemical characteristics of atmospheric aerosol in Xiamen[J]. Journal of the Graduate School of the Chinese Academy of Sciences, 2007,24(5):657-660. ]

[18]
Kaufman Y J, Tanre D, Remer L A, et al. Operational remote sensing of tropospheric aerosol over land from EOS moderate resolution imaging spectroradiometer[J]. Journal of Geophysical Research, 1997,102(14):17051-17067.Daily distribution of the aerosol optical thickness and columnar mass concentration will be derived over the continents, from the EOS moderate resolution imaging spectroradiometer (MODIS) using dark land targets. Dark land covers are mainly vegetated areas and dark soils observed in the red and blue channels; therefore the method will be limited to the moist parts of the continents (excluding water and ice cover). After the launch of MODIS the distribution of elevated aerosol concentrations, for example, biomass burning in the tropics or urban industrial aerosol in the midlatitudes, will be continuously monitored. The algorithm takes advantage of the MODIS wide spectral range and high spatial resolution and the strong spectral dependence of the aerosol opacity for most aerosol types that result in low optical thickness in the mid-IR (2.1 and 3.8 μm). The main steps of the algorithm are (1) identification of dark pixels in the mid-IR; (2) estimation of their reflectance at 0.47 and 0.66 μm; and (3) derivation of the optical thickness and mass concentration of the accumulation mode from the detected radiance. To differentiate between dust and aerosol dominated by accumulation mode particles, for example, smoke or sulfates, ratios of the aerosol path radiance at 0.47 and 0.66 μm are used. New dynamic aerosol models for biomass burning aerosol, dust and aerosol from industrial/urban origin, are used to determine the aerosol optical properties used in the algorithm. The error in the retrieved aerosol optical thicknesses, τis expected to be Δτ= 0.05±0.2τ. Daily values are stored on a resolution of 10×10 pixels (1 km nadir resolution). Weighted and gridded 8-day and monthly composites of the optical thickness, the aerosol mass concentration and spectral radiative forcing are generated for selected scattering angles to increase the accuracy. The daily aerosol information over land and oceans [Tanré et al., this issue], combined with continuous aerosol remote sensing from the ground, will be used to study aerosol climatology, to monitor the sources and sinks of specific aerosol types, and to study the interaction of aerosol with water vapor and clouds and their radiative forcing of climate. The aerosol information will also be used for atmospheric corrections of remotely sensed surface reflectance. In this paper, examples of applications and validations are provided.

DOI

[19]
韩花. 基于监督分类的土地利用动态变化监测及其信息自动提取[D].西安:长安大学,2012.

[ Han H.Dynamic monitoring and automatic extract of land use change information with supervised classification[D]. Xian: Changan University, 2012. ]

[20]
Li X, Zhou W, Ouyang Z, et al. Spatial pattern of greenspace affects land surface temperature: evidence from the heavily urbanized Beijing metropolitan area, China[J]. Landscape Ecology, 2012,27(6):887-898.The urban heat island describes the phenomenon that air/surface temperatures are higher in urban areas compared to their surrounding rural areas. Numerous studies have shown that increased percent cover of greenspace (PLAND) can significantly decrease land surface temperatures (LST). Fewer studies, however, have investigated the effects of configuration of greenspace on LST. This paper aims to fill this gap using Beijing, China as a case study. PLAND along with six configuration metrics were used to measure the composition and configuration of greenspace. The metrics were calculated based on a greenspace map derived from SPOT imagery, and LST data were retrieved from Landsat TM thermal band. Ordinary least squares regression and spatial autoregression were employed to investigate the relationship between LST and spatial pattern of greenspace using the census tract as the analytical unit. The results showed that PLAND was the most important predictor of LST. A 10 % increase in PLAND resulted in approximately a 0.86 A degrees C decrease in LST. Configuration of greenspace also significantly affected LST. Given a fixed amount of greenspace, LST increased significantly with increased patch density. In addition, the variance of LST was largely explained by both composition and configuration of greenspace. The unique variation explained by the composition was relatively small, and was close to that of the configuration. Results from this study can expand our understanding of the relationship between LST and vegetation, and provide insights for improving urban greenspace planning and management.

DOI

[21]
Li X, Zhou W, Ouyang Z.Relationship between land surface temperature and spatial pattern of greenspace: what are the effects of spatial resolution[J]. Landscape and Urban Planning, 2013,114:1-8.Urban heat island (UHI) is a worldwide phenomenon, which causes many ecological and social consequences. Urban greenspace can decrease environmental temperature and thus alleviate UHI effects. Spatial pattern of greenspace, both composition and configuration, significantly affects land surface temperature (LST). Results from previous studies, however, showed inconsistent, or even contradictory relationships between LST and spatial pattern of greenspace, suggesting these relationships may be scale dependent (sensitive to spatial resolution). But few studies have explicitly addressed this issue. This paper examines whether the spatial resolution of the imagery used to map urban greenspace affect the relationship between LST and spatial pattern of greenspace, using Beijing, China as a case study. Spatial pattern of greenspace was measured with seven landscape metrics at three spatial resolutions (2.44 m, 10 m, and 30 m) based on QuickBird, SPOT, and TM imagery. LST was derived from thermal band of Landsat TM imagery. The relationship between LST and spatial pattern of greenspace was examined by Pearson correlation and partial Pearson correlation analysis using census tract as analytical unit. Results showed that landscape metrics of greenspace varied by spatial resolution. Imagery with higher spatial resolution could more accurately quantify the spatial pattern of greenspace. The relationship between LST and abundance of greenspace was consistently negative, but the relationship between LST and spatial configuration of greenspace varied by spatial resolution. This study extended our scientific understanding of the effects of spatial pattern, especial spatial configuration of greenspace on LST. In addition, it can provide insights for urban greenspace planning and management. (C) 2013 Elsevier B.V. All rights reserved.

DOI

[22]
王中挺,厉青,陶金花,等.环境一号卫星CCD相机应用于陆地气溶胶的监测[J].中国环境科学,2009,29(9):902-907.环境一号卫星CCD相机应用在陆地气溶胶的监测中,因缺少短波红外通道,使地表反射的去除变得异常困难.应用改进的暗目标法,利用辐射传输方程(6S)构建查找表,对CCD相机数据进行图像重采样和辐射定标处理,进而对查找表进行插值,获得气溶胶光学厚度(AOD)分布.通过AERONET地基数据的验证及与MODIS气溶胶产品的对比表明,环境一号卫星CCD相机对陆地气溶胶的监测结果在AOD较大(>0.2)时,精度与MODIS相近;在AOD较小(<0.2)时,结果欠理想.

[ Wang Z T, Li Q, Tao J H, et al. Monitoring of aerosol optical depth over land surface using CCD camera on HJ-1 satellite[J]. China Environmental Science, 2009,29(9):902-907. ]

[23]
段文举. 基于环境一号卫星的气溶胶光学厚度反演研究[D].北京:中国地质大学(北京),2012.

[ Duan W. Study on the retrieval of aerosol optical depth based on HJ-1 satellite[D]. Beijing: China University of Geoscience (Beijing), 2012. ]

[24]
Beckett K P, Freer-Smith P H,Taylor G. Effective tree species for local air quality management[J]. Journal of Arboriculture, 2000,26:12-19.The beneficial effect that trees have on air quality is often stated in arboricultural literature but has rarely been researched. The present study - carried out at two sites in Sussex, UK - aimed to identify trees from 5 contrasting species (whitebeam, Sorbus aria, field maple, Acer campestre, poplar, Populus 'Beaupr茅', Corsican pine, Pinus nigra var. maritima and Leyland cypress, Cupressocypa...

[25]
赵晨曦,王玉杰,王云琦,等.细颗粒物( PM2.5)与植被关系的研究综述[J].生态学杂志,2013,32(8):2203-2210.<div style="line-height: 150%">细颗粒物即PM<sub>2.5</sub>,粒径小,沉降困难,危害严重,植被在一定程度上有助于减轻颗粒物污染。本文从阐述PM<sub>2.5</sub>的沉降机理出发,分析PM<sub>2.5</sub>与植被之间的相互作用。植被的阻滞吸收作用对大气颗粒物移除存在积极影响,而过多的空气颗粒物滞留对植物生长起到一定的负面作用,但以植被对大气颗粒物的移除为主导作用。以此为基础,从林分尺度环境特性、单木尺度树种特性和叶片尺度颗粒物种类和分布特性这3个角度出发,结合外界影响因素(气象学要素、空气动力学要素、大气颗粒浓度水平、植物物候变化)、气室实验以及滞留颗粒物特征等阐述植被林冠、枝干及叶片等对移除PM<sub>2.5</sub>的影响。最后,文章指出今后的研究应当向定量化方向发展,注重不同树种移除PM<sub>2.5</sub>能力的对比分析及系统研究,并针对研究区域确定防治大气PM<sub>2.5</sub>污染的优势树种。</div><div style="line-height: 150%">&nbsp;</div>

[ Zhao C X, Wang Y J, Wang Y Q, et al. Interactions between fine particulate matter (PM2.5) and vegetation: A review[J]. Chinese Journal of Ecology, 2013,32(8):2203-2210. ]

[26]
王晓磊,王成.城市森林调控空气颗粒物功能研究进展[J].生态学报,2014,34(8):1910-1921.受城市扩张、工业发展、汽车保有量增加的影响,空气颗粒物目前已成为诸多城市空气的首要污染物。而城市森林作为城市生态建设中最大的唯一具有自净功能的生态系统,不仅为城市高污染环境下的居民提供了相对洁净的休闲游憩空间,还对净化空气颗粒物起重要作用。从城市森林调控空气颗粒物的机理、分析方法、植物个体、群落及不同类型城市森林调控空气颗粒物的功能差异及其时空变化规律等方面进行阐述。结果表明:目前有关物理降尘的研究较多,涉及化学除尘的研究尚缺;应用重量法测定植物滞尘量的研究较多,质量浓度法测定城市森林净化空气颗粒物功能的研究较少。在未来一段时间,森林植被化学除尘的过程与机理,城市森林调控空气颗粒物的多方面、系统性研究及相关研究成果的转化与实际应用将会是重要的研究方向。

DOI

[ Wang X L, Wang C.Research status and prospects on functions of urban forests in regulating the air particulate matter[J]. Acta Ecologica Sinica, 2014,34(8):1910-1921. ]

Outlines

/