
Journal of Geo-information Science >
Study on the Influence of Urban Building Density on the Heat Island Effect in Beijing
Received date: 2015-12-28
Request revised date: 2016-04-08
Online published: 2016-12-20
Copyright
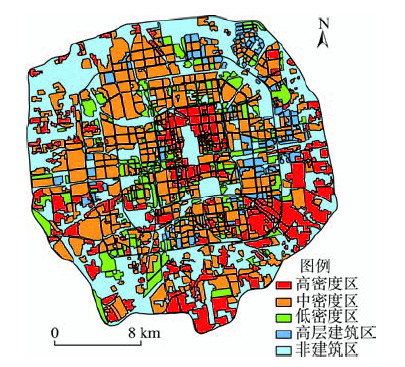
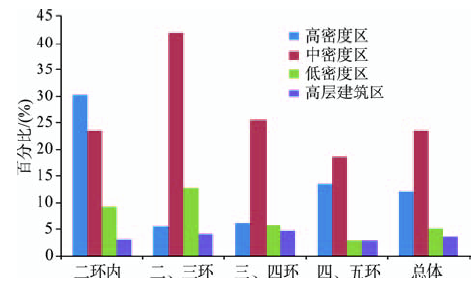
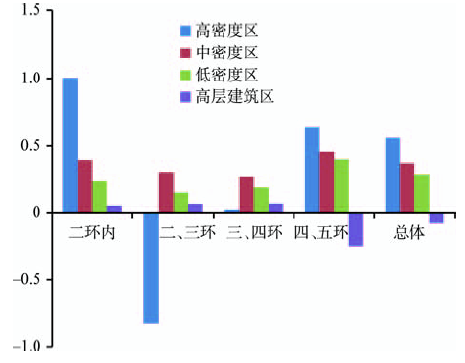
"Heat island effect" is one of the main features of modern urban climate. In this paper, we have obtained the information for regions with different building densities in Beijing by using the artificial visual interpretation based on the high resolution remote sensing images, and then analyzed the relationship between the urban building density distribution and the urban heat island effect and its change pattern based on the land surface temperature data obtained by remote sensing inversion. The results show that the medium density building regions are the primary type within the fifth ring road in Beijing, and the area proportion of which is 23.5%. The distribution of the high density building regions is slightly less than the medium density building regions, and the area proportion of which is 12.01%. There are evident differences among the distributions of regions with different building densities within different ring roads. The high density building regions are mainly distributed within the second ring road, while the medium density building regions are commonly distributed in the whole area. The medium density building regions and the low density building regions are mainly distributed within the second-third ring road area. The overall area of the high-rise building regions is very small, and the high-rise building regions are mainly distributed within the second-third ring road area as well as the third-fourth ring road area. The relationship between the land surface temperature and the building density for the urban building regions is significantly positive, in which the higher density of the urban buildings, the higher average land surface temperature it will reach. The average temperature of the high density building regions in Beijing reached 30.5 ℃. The contribution of the high-rise building regions to the heat island intensity is small, and the average temperature of the high-rise building area is 28.32 ℃, which is 2.18 ℃ lower than the high density building regions. The distribution pattern of the average temperature for regions with different building densities among different ring roads is approximately the same. The differences of the average temperature among regions with different building densities within the second ring road are the smallest, while the average temperature of the high density building regions is obviously higher than other building density regions within the second-third ring road area and the third-fourth ring road area, and the average temperature of the high-rise building regions within the fourth-fifth ringroad area is the lowest, which is 28.09 ℃. Taking the change of heat island intensity between 2010 and 2015 into consideration, only the heat island intensity in the high-rise building regions has a weakening tendency, in which the intensity of the heat island has reduced by 0.07 ℃. While the heat island intensity in the high, medium and low density building regions have an enhancing tendency, the heat island intensity in the high density regionshas the largest growth, which had an increase of 0.56 ℃. Heat island effect is one of the most representative ecological environment problems in the process of urbanization, and the intensity of urban construction has an important impact on the urban heat island effect. Base on many researches, an appropriate reduction of the urban building density can effectively ease the occurrence of urban heat island effect.
Key words: Beijing; building density; heat island effect; remote sensing inversion
GE Yaning , XU Xinliang , LI Jing , CAI Hongyan , ZHANG Xuexia . Study on the Influence of Urban Building Density on the Heat Island Effect in Beijing[J]. Journal of Geo-information Science, 2016 , 18(12) : 1698 -1706 . DOI: 10.3724/SP.J.1047.2016.01698
Fig. 1 Classification results of regions with different building densities in Beijing图1 北京市建筑密度区分类结果 |
Tab. 1 Classification standards of regionswith different building densities表1 不同建筑密度区划分标准 |
| 密度区 | 划分标准 |
|---|---|
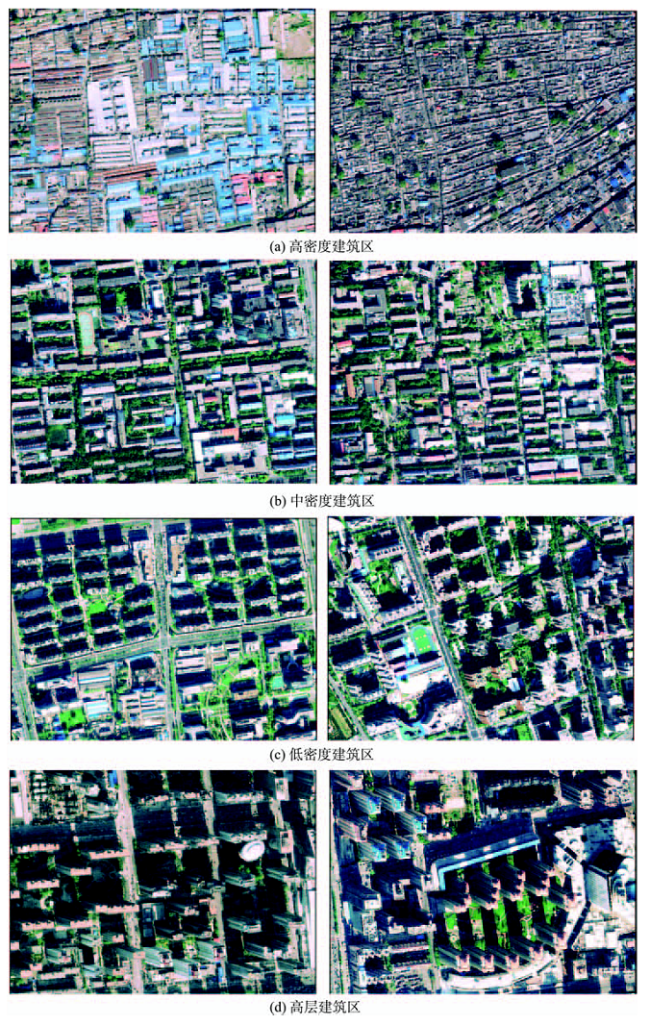
| 高密度区 | 房屋建筑密集,间距很小,绿化面积极少 |
| 中密度区 | 房屋建筑较密集,与高密度区相比,楼间距稍大,绿化面积较多 |
| 低密度区 | 房屋建筑比较稀疏,房屋建筑之间自然植被分布较多 |
| 高层建筑区 | 楼间距较大,在高分辨率遥感影像上能看到明显的立体房屋和楼房阴影 |
Fig. 2 The features of regions with different building densities on the Quick bird remote sensing images in Beijing图2 北京市不同建筑密度区快鸟高分辨率遥感影像特征 |
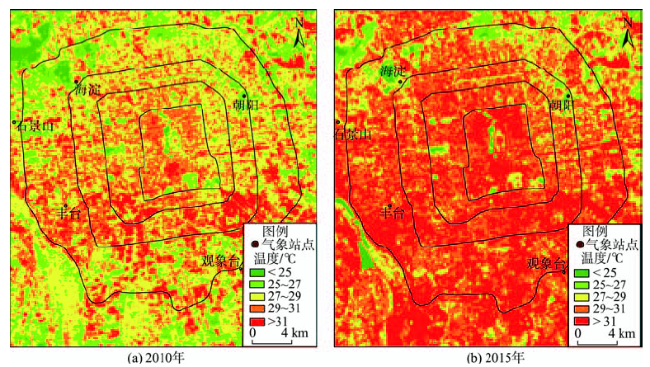
Fig. 3 Spatial distribution of land surface temperature in Beijing图3 北京市地表温度空间分布图 |
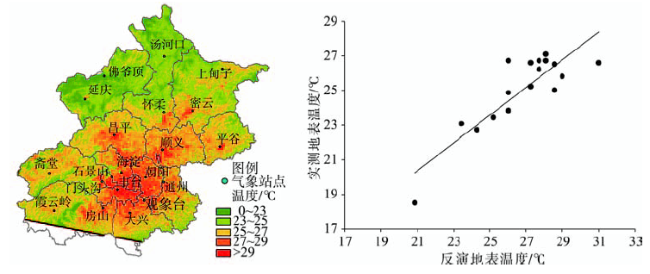
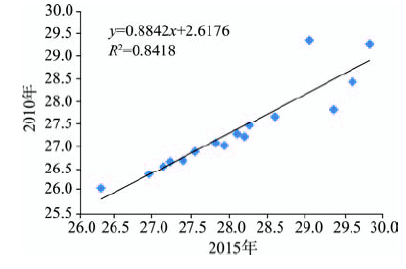
Fig. 4 The relationship between the measured temperature from meteorological stations and the LST图4 气象站点的实测温度与地表温度之间的关系 |
Fig. 5 Comparison of water LST of Beijingbetween 2010 and 2015图5 北京市2010年和2015年水体地表温度对比 |
Fig. 6 The area ratio of regions with different building densities for different ring roads in Beijing图6 北京市各环不同建筑密度区面积比例 |
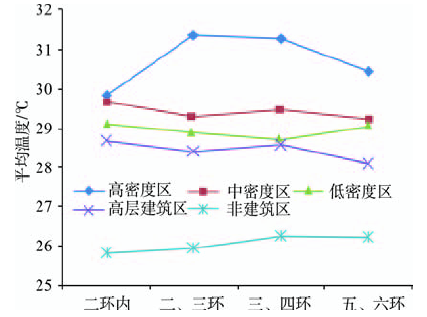
Tab. 2 The average temperature of different density regions in Beijing in 2010 (unit: ℃)表2 北京市各环线之间不同密度区2010年平均温度(℃) |
| 密度分区 | 二环内 | 二、三环 | 三、四环 | 四、五环 | 整体 |
|---|---|---|---|---|---|
| 高密度区 | 29.84 | 31.37 | 31.29 | 30.45 | 30.50 |
| 中密度区 | 29.69 | 29.29 | 29.48 | 29.23 | 29.35 |
| 低密度区 | 29.09 | 28.91 | 28.71 | 29.04 | 28.91 |
| 高层建筑区 | 28.69 | 28.40 | 28.58 | 28.09 | 28.32 |
| 非建筑区 | 25.81 | 25.93 | 26.24 | 26.21 | 26.05 |
Fig. 7 The average temperature of different densityregions in Beijing in 2010 (℃)图7 北京市各环线内2010年不同密度区平均温度(℃) |
Tab. 3 Distribution of heat island intensity of different density regions between different ring roads in 2010 and 2015表3 2010年和2015年北京市不同环线间各密度区热岛强度分布(℃) |
| 密度分区 | 二环内 | 二、三环 | 三、四环 | 四、五环 | 总体 | |||||
|---|---|---|---|---|---|---|---|---|---|---|
| 2010年 | 2015年 | 2010年 | 2015年 | 2010年 | 2015年 | 2010年 | 2015年 | 2010年 | 2015年 | |
| 高密度区 | 3.79 | 4.80 | 5.32 | 4.48 | 5.24 | 5.26 | 4.40 | 5.04 | 4.45 | 5.00 |
| 中密度区 | 3.64 | 4.03 | 3.24 | 3.55 | 3.43 | 3.70 | 3.18 | 3.64 | 3.30 | 3.66 |
| 低密度区 | 3.04 | 3.28 | 2.86 | 3.01 | 2.66 | 2.85 | 2.99 | 3.39 | 2.86 | 3.15 |
| 高层建筑区 | 2.64 | 2.69 | 2.35 | 2.41 | 2.53 | 2.60 | 2.04 | 1.79 | 2.27 | 2.19 |
Fig. 8 Variation of heat island intensity from 2010-2015 between different ring roads in Beijing图8 北京市各环线间2010-2015年热岛强度变化(℃) |
The authors have declared that no competing interests exist.
| [1] |
[
|
| [2] |
[
|
| [3] |
[
|
| [4] |
[
|
| [5] |
[
|
| [6] |
[
|
| [7] |
[
|
| [8] |
[
|
| [9] |
[
|
| [10] |
|
| [11] |
|
| [12] |
|
| [13] |
|
| [14] |
|
| [15] |
[
|
| [16] |
[
|
| [17] |
[
|
| [18] |
[
|
| [19] |
[
|
| [20] |
[
|
| [21] |
[
|
| [22] |
[
|
/
| 〈 |
|
〉 |