
Journal of Geo-information Science >
Analysis of NDVI Change Trend and Its Impact Factors in the Three-River HeadwaterRegion from 2000 to 2013
Received date: 2015-12-11
Request revised date: 2016-03-27
Online published: 2016-12-20
Copyright
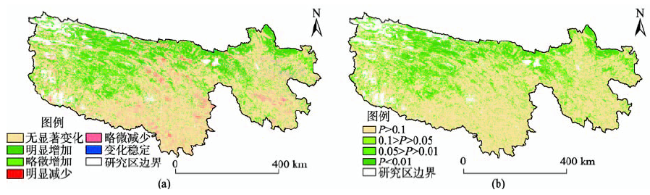
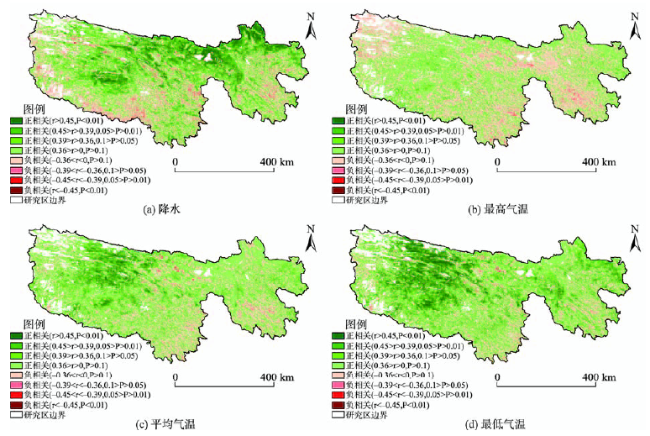
Based on the MODIS NDVI data for the Three-River Headwater Region from 2000 to 2013, this study first systematically analyzed the spatial-temporal change pattern of yearly accumulative NDVI during the growing season. Then, the impacts of human activities on the change of NDVI were explored based on the statistical data collected in the ecological protection and construction projects implemented within the study area. Finally, correlations between the NDVI data and climate factors were acquired, and the key limiting climate factors that could impact the vegetation change within different parts of the study area were discussed. Results show that, the accumulative NDVI during the growing season increased overall from 2000 to 2013. Specifically, areas with apparent increase of NDVI accounted for 17.84% of the study area and were mainly distributed in the western and northern parts, while areas with apparent decrease of NDVI covered only 0.78% of the Three-River Headwater Region and were sporadically located in the central part. NDVI in the eastern and southern parts primarily presented a stable change trend or had no significant change trend, and its area ratio was 59.64%. Although the ecological protection and construction projects implemented within the Three-River Headwater Region had promoted the vegetation restoration, NDVI change was mainly affected by the climate factors within the whole study area, since the impacts of human activities on the regional vegetation change were limited. Spatially, NDVI in the western part of the study area (Yangtze River source region) was strongly affected by temperature, while in the northeastern part (Yellow River source region) it was affected more by precipitation. In the southern part (Lancang River source region), however, vegetation growth was affected neither by precipitation nor by temperature.
SUN Qingling , LI Baolin , XU Lili , ZHANG Tao , GE Jinsong , LI Fei . Analysis of NDVI Change Trend and Its Impact Factors in the Three-River HeadwaterRegion from 2000 to 2013[J]. Journal of Geo-information Science, 2016 , 18(12) : 1707 -1716 . DOI: 10.3724/SP.J.1047.2016.01707
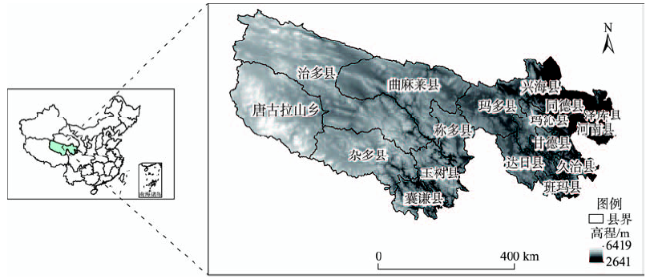
Fig. 1 Location and terrain of the study area图1 研究区位置和地形 |
Tab. 1 Classification standards for different vegetation change trends in the study area表1 研究区不同植被NDVI变化趋势区分标准 |
| 变化类型 | F检验显著性水平 | 变化率/(%) |
|---|---|---|
| 发生趋势性变化 | ||
| 明显增加 | P<0.1 | R≥15.0 |
| 略微增加 | P<0.1 | 5.0<R<15.0 |
| 明显减少 | P<0.1 | R≤-15.0 |
| 略微减少 | P<0.1 | -15.0<R<-5.0 |
| 未发生趋势性变化 | ||
| 变化稳定 | P<0.1 | -5.0≤R≤5.0 |
| 无显著变化 | P>0.1 |
Tab. 2 Statistics of different vegetation changetypes in the study area表2 研究区不同NDVI变化类型统计表 |
| 变化类型 | 面积/km2 | 占研究区比例/(%) | |
|---|---|---|---|
| 发生趋势性变化 | 明显增加 | 63 721 | 17.84 |
| 略微增加 | 43 365 | 12.14 | |
| 明显减少 | 2802 | 0.78 | |
| 略微减少 | 6654 | 1.86 | |
| 未发生趋势性变化 | 变化稳定 | 1448 | 0.41 |
| 无显著变化 | 211 605 | 59.23 | |
| 总计 | 329 595 | 92.26 | |
Fig. 2 Maps of the NDVI change trend and its significance level from 2000 to 2013图2 2000-2013年植被NDVI变化趋势及其显著性水平分布 |
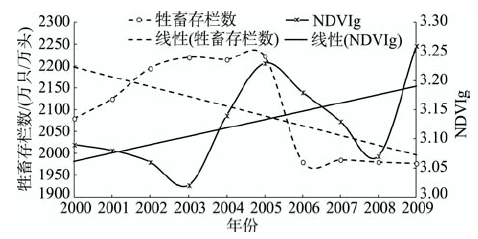
Tab. 3 Statistics of the ecological protection projects implemented in the Three-River Headwater Region from 2000 to 2013表3 2000-2013年间三江源实施的生态保护工程概况 |
| 项目类型 | 实施时段 | 计划实施面积/km2 | 实际实施面积/km2 |
|---|---|---|---|
| 退牧还草 | 2003-2012 | 6.44 | 5.65 |
| 退耕还林(草) | 2004-2012 | 0.01 | 0.01 |
| 水土保持 | 2005-2012 | 500.00 | 500.00 |
| 封山育林 | 2005-2012 | 0.30 | 0.24 |
| 沙漠化治理 | 2005-2012 | 0.04 | 0.04 |
| 湿地保护 | 2005-2012 | 0.11 | 0.01 |
| 黑土滩治理 | 2005-2012 | 0.37 | 0.23 |
| 鼠害防治 | 2005-2012 | 2.09 | 7.83 |
| 灌溉饲草基地 | 2009-2012 | 0.00 | 0.00 |
| 总计 | 509.36 | 514.01 |
Fig. 3 Change of NDVIg and livestock quantity from 2000 to 2009 in the Three-River Headwater Region图3 2000-2009年三江源NDVIg与牲畜存栏数变化 |
Fig. 4 Maps of the correlations and their significance levels between NDVIg and the annual total precipitation图4 三江源植被NDVIg与气候要素的相关性及其显著性水平分布 |
The authors have declared that no competing interests exist.
| [1] |
[
|
| [2] |
[
|
| [3] |
[
|
| [4] |
[
|
| [5] |
[
|
| [6] |
|
| [7] |
[
|
| [8] |
[
|
| [9] |
[
|
| [10] |
[
|
| [11] |
|
| [12] |
[
|
| [13] |
[
|
| [14] |
中国科学院中国植被图编辑委员会.中国植被图集(1:100万)[M].北京:科学出版社,2001:89-96.
[ The Editing Committee of China Vegetation Map, Chinese Academy of Sciences. Vegetation atlas of China (1:1 000 000)[M]. Beijing: Science Press, 2001:89-96. ]
|
| [15] |
[
|
| [16] |
[
|
| [17] |
|
| [18] |
[
|
| [19] |
|
| [20] |
[
|
| [21] |
|
| [22] |
[
|
| [23] |
|
| [24] |
|
| [25] |
[
|
| [26] |
[
|
| [27] |
[
|
| [28] |
|
| [29] |
[
|
| [30] |
|
| [31] |
[
|
| [32] |
[
|
| [33] |
|
| [34] |
|
| [35] |
|
| [36] |
[
|
| [37] |
[
|
| [38] |
[
|
| [39] |
[
|
| [40] |
[
|
| [41] |
[
|
| [42] |
[
|
| [43] |
[
|
| [44] |
[
|
| [45] |
[
|
/
| 〈 |
|
〉 |