
Journal of Geo-information Science >
Spatial Distribution Simulation and Underlying Surface Factors Analysis of NO2 Concentration Based on Land Use Regression
Received date: 2016-06-29
Request revised date: 2016-09-12
Online published: 2017-01-13
Copyright
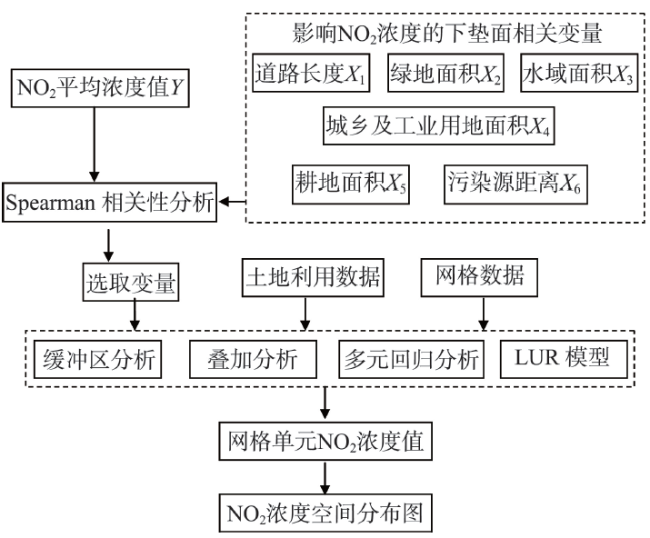
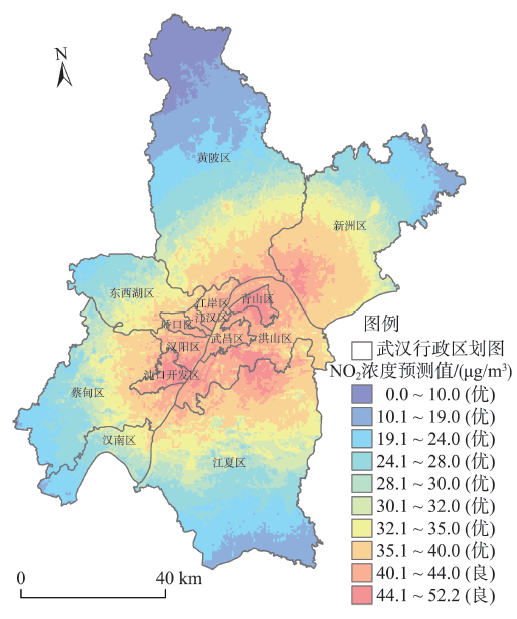
With the rapid development of economy, air pollution has become an important environmental problem, attracting wide attention. As one of the main air pollutants, NO2 (nitrogen dioxide) becomes focus of the related research. It was found that the concentration of NO2 varied with different regions by comparing monitoring data in different monitoring sites. Thus, simulation of its spatial distribution and analysis of the influential factors of the underlying surface have important value. The Land-use Regression (LUR) model is a method that combines, analyzes and display a multivariate regression model with spatial land-use data, monitoring data and other relevant geographic data on a map. In this study, the land use regression model is built by using a buffer analysis, overlay analysis, Spear-man correlation analysis and multiple regression analysis and it was used to identify the underlying surface factors related to the NO2 concentration and simulate the spatial distribution ofNO2 concentration. The results show that the spatial distribution of NO2 mass concentration can be modeled accurately by LUR model. Based on the influential factors of the underlying surface, the following conclusions can be drawn: The increase of urban residence area, rural residence area, industrial land area and the length of the road and the reduction of the distance from the pollution source will increase the NO2 concentration. The increase of arable land area, green area and water area will decrease the NO2 concentration. The map of simulation results shows that the highest NO2 concentration is located in industrial districts and the NO2 concentration is lower where it is far from the city center. Changing the industrial structure of industrial land and increasing the green land can help reduce the NO2 concentration.
Key words: underlying surface; road traffic; land use; NO2; land use regression model
SHI Yuanyuan , LI Rendong , QIU Juan , HUANG Duan , WANG Haifang . Spatial Distribution Simulation and Underlying Surface Factors Analysis of NO2 Concentration Based on Land Use Regression[J]. Journal of Geo-information Science, 2017 , 19(1) : 11 -19 . DOI: 10.3724/SP.J.1047.2017.00010
Fig. 1 Technology Roadmap for Spatial Difference Research and Simulation of NO2 Concentration图1 NO2浓度影响因素研究与模拟技术路线图 |
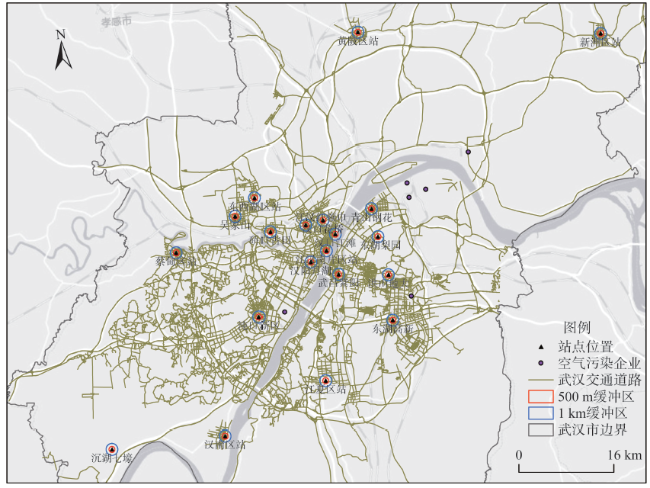
Fig. 2 Distribution Map of Air Pollutant Monitoring Sites and the Road Lines图2 武汉市监测点位及交通道路分布图 |
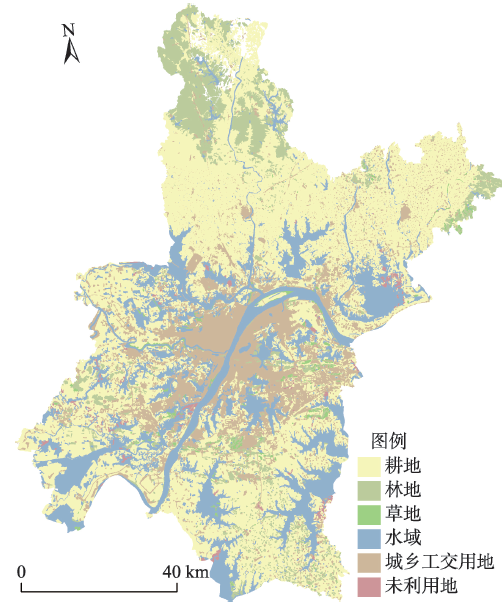
Fig. 3 Map of land use in Wuhan图3 武汉市土地利用类型分布图 |
Tab. 1 Spear-man correlation analysis result表1 Spearman相关分析结果表 |
| 影响因子 | R2 | sig |
|---|---|---|
| 500 m缓冲区内道路长度X1/km | 0.328 | 0.158 |
| 1 km缓冲区内道路长度X2/km | 0.371 | 0.107 |
| 500 m缓冲区内绿地面积X3/km2 | -0.339 | 0.144 |
| 1 km缓冲区内绿地面积X4/km2 | -0.274 | 0.242 |
| 500 m缓冲区内水域面积X5/km2 | -0.075 | 0.754 |
| 1 km缓冲区内水域面积X6/km2 | -0.172 | 0.468 |
| 500 m缓冲区内城乡及工业用地面积X7/km2 | 0.505 | 0.023 |
| 1 km缓冲区内城乡及工业用地面积X8/km2 | 0.672 | 0.001 |
| 500 m缓冲区内耕地面积X9/km2 | -0.737 | 0.000 |
| 1 km缓冲区内耕地面积X10/km2 | -0.854 | 0.000 |
| 到最近污染源距离X11/km | -0.469 | 0.037 |
Tab. 2 Results of multiple linear regression model表2 回归系数表 |
| 影响因子 | 系数 |
|---|---|
| 常量 | 44.304 |
| 500 m缓冲区内道路长度X1/km | 1.042 |
| 500 m缓冲区内绿地面积X3/km2 | -23.641 |
| 1 km缓冲区内水域面积X6/km2 | 4.791 |
| 500 m缓冲区内城乡及工业用地面积X7/km2 | 9.757 |
| 1 km缓冲区内耕地面积X10/km2 | -5.997 |
| 到最近污染源距离X11/km | -0.507 |
Tab. 3 Correlation values of underlying surface factors of chemical engineering monitoring site表3 化工新区站点下垫面因子相关值 |
| 属性 | 值 |
|---|---|
| 500 m缓冲区内道路长度X1/km | 0.925 |
| 500 m缓冲区内绿地面积X3/km2 | 0.017 |
| 1 km缓冲区内水域面积X6/km2 | 0.000 |
| 500 m缓冲区内城乡及工业用地面积X7/km2 | 0.060 |
| 1 km缓冲区内耕地面积X10/km2 | 3.064 |
| 到最近污染源距离X11/km | 0.038 |
Fig. 4 The map of spatial distribution of NO2 concentration by LUR图4 NO2质量浓度预测分布图 |
The authors have declared that no competing interests exist.
| [1] |
[
|
| [2] |
[
|
| [3] |
[
|
| [4] |
[
|
| [5] |
[
|
| [6] |
[
|
| [7] |
[
|
| [8] |
[
|
| [9] |
[
|
| [10] |
[
|
| [11] |
[
|
| [12] |
[
|
| [13] |
中华人民共和国环境保护部.环境空气质量标准(GB3095—2012)[S].北京:中国环境科学出版社 Beijing: China Environmental Science Press, 2012. ]
[ Ministry of Environmental Protection of the People's Republic of China. Ambient air quality standards(GB3095-2012)[S]. Beijing: China Environmental Science Press, 2012. ]
|
| [14] |
|
| [15] |
|
| [16] |
|
| [17] |
|
| [18] |
|
| [19] |
[
|
| [20] |
[
|
| [21] |
[ Yang K, Yang Y L, Zhu Y H, et al. Social and economic drivers of PM2.5 and their spatial relationship in China[J]. Geographical Research, 2016, 35(6):1051-1060. ]
|
| [22] |
[
|
| [23] |
[
|
| [24] |
[
|
| [25] |
[
|
| [26] |
[
|
| [27] |
[
|
| [28] |
[ Liu S, Zhang Q J, Cong L L. The application of GIS superim position analysis in landscape planning[J]. Sci-Tech Information Development & Economy, 2008,18(24):151-152. ]
|
| [29] |
[ Lv H F, Han B. Research on spatial overlay analysis of real estate development project site[J]. New technologies and products, 2009,18:226-227. ]
|
| [30] |
[
|
| [31] |
[ Johnson, R.A, Wichern D.W. Applied Multivariate Statistical Analysis[M]. Beijing: Tsinghua University Press, 2008. ]
|
| [32] |
[
|
| [33] |
[
|
| [34] |
[
|
| [35] |
[
|
| [36] |
[
|
| [37] |
|
| [38] |
|
| [39] |
[
|
| [40] |
[
|
| [41] |
[
|
| [42] |
[ Wang J, Yang B, Cheng X, et al. Space-time distribution regularity of nitrogen monoxide and nitrogen dioxide in atmosphere of Shenyang urban district[J]. Environmental Protection Science, 2002,28(3):9-10. ]
|
| [43] |
[
|
| [44] |
[
|
| [45] |
中华人民共和国环境保护部.环境空气指数(AQI)技术规定(HJ633-2012)[S].北京:中国环境科学出版社,2012.
[ Ministry of Environmental Protection of the People's Republic of China. Technical regulation on ambient air quality index(HJ633-2012)[S]. Beijing: China Environmental Science Press, 2012. ]
|
| [46] |
中华人民共和国环境保护部,中华人民共和国国家统计局,中华人民共和国农业部.第一次全国污染源普查公报[N].人民日报,2010-02-10(016).
[ People's Republic of China Ministry of Environmental Protection, National Bureau of Statistics People's Republic of China, People's Republic of China Ministry of Agriculture. The first national pollution census bulletin[N]. People's Daily, 2010-02-10(016). ]
|
| [47] |
|
| [48] |
[
|
| [49] |
[
|
| [50] |
[
|
| [51] |
[
|
| [52] |
[
|
| [53] |
[
|
| [54] |
[
|
| [55] |
[
|
/
| 〈 |
|
〉 |