
Journal of Geo-information Science >
Study on the Security Pattern of the Heat Environment and the Influence of Land Use Change in the Yangtze River Delta Urban Agglomeration
Received date: 2016-06-30
Request revised date: 2016-08-20
Online published: 2017-01-13
Copyright
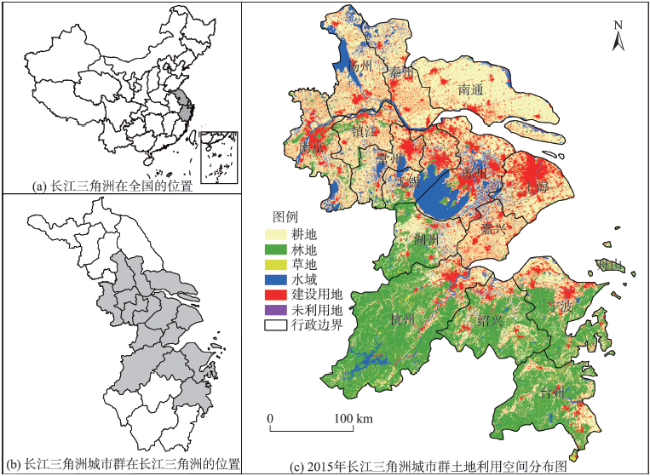
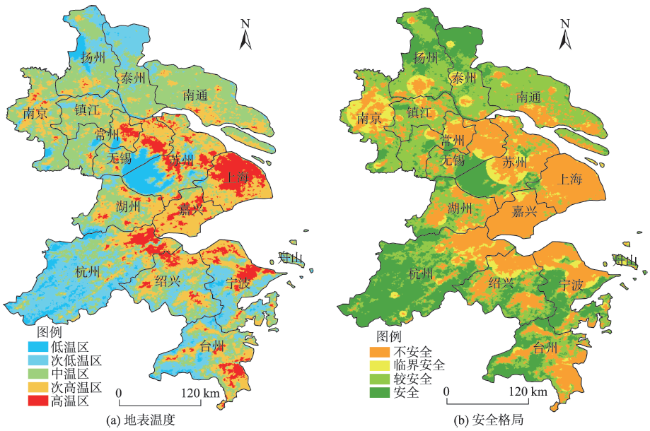
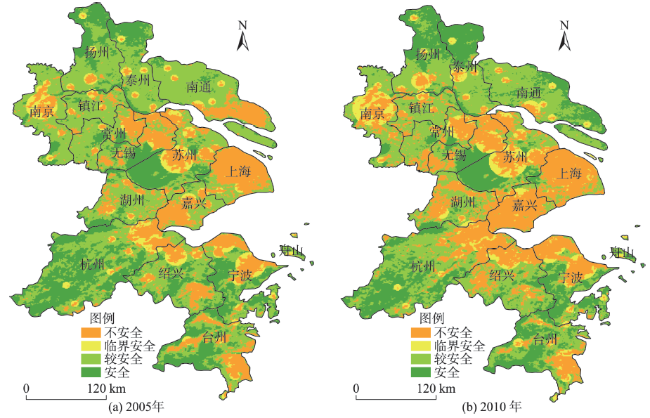
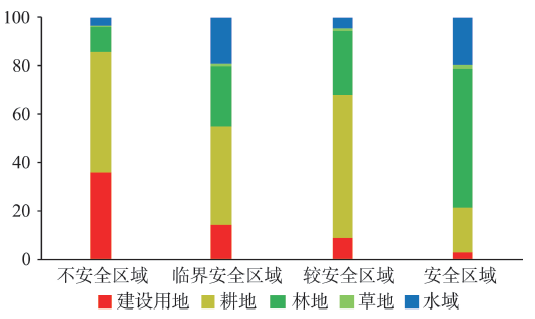
The acceleration of urbanization plays an important role in regional heat environment, whose changes may lead to a series of ecological problems. A scientific evaluation on the heat environment of urban agglomeration is essential to urban planning and construction. Based on the construction of a standard of heat environment security levels, we analyzed the spatio-temporal variation of the heat environment security pattern and its causes from land use changes in the Yangtze River Delta urban agglomeration using the MODIS land surface temperature products. The conclusions are as follows: (1) in 2015, the dangerous zones of the heat environment in the Yangtze River Delta urban agglomeration were mostly located in or closed to the urban built-up regions. For example, the “Z” region of Nanjing, Shanghai, Hangzhou, Ningbo and other cities were most obvious. The critical security zones were mostly located in suburbs while the relative security zones were mainly distributed in the northern plains of the Yangtze River. The security zones were mainly located in Hangzhou and its southern mountain and hilly region, most of the region of Tai Lake and the north of the Yangtze River Delta urban agglomerations; (2) the dangerous zone, the critical security zone, the relative security zone and the security zone showed an upward trend, a slight upward trend, a downward trend and a first downward then upward trend, respectively; (3) the primary reason of the decline in security levels of the heat environment was the high ratio of the build-up areas and the low ratio of woodlands. Additionally, the large quantity of croplands occupied by build-up areas was also the reason of the expansion of dangerous zones.
Key words: urbanization; urban agglomeration; the heat environment; security pattern
HAN Dongrui , XU Xinliang , LI Jing , SUN Xihua , QIAO Zhi . Study on the Security Pattern of the Heat Environment and the Influence of Land Use Change in the Yangtze River Delta Urban Agglomeration[J]. Journal of Geo-information Science, 2017 , 19(1) : 39 -49 . DOI: 10.3724/SP.J.1047.2017.00039
Fig. 1 The location of the Yangtze River Delta and its administrative map图1 长江三角洲城市群地理位置与行政区划图 |
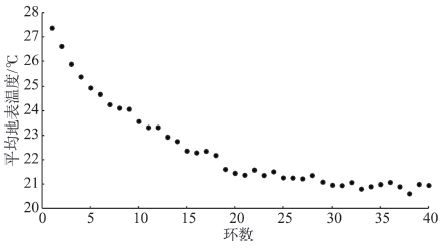
Fig. 2 Average land surface temperature of eachring of Suzhou in 2005图2 2005年苏州市各环地表温度平均值散点图 |
Tab. 1 Division standard for LST thermodynamic levels表1 地表温度热力等级划分标准 |
| 地表温度等级 | 温度范围 |
|---|---|
| 低温 | <–1.5 |
| 次低温 | –1.5≤<–0.5 |
| 中温 | –0.5≤<+0.5 |
| 次高温 | +0.5≤<+1.5 |
| 高温 | ≥+1.5 |
注:表示归一化后所有像元的平均值;表示归一化后所有像元的标准差 |
Tab. 2 Division standard for heat environmentsecurity levels表2 热环境安全等级划分标准 |
| 安全等级 | 划分标准 |
|---|---|
| 不安全 临界安全 | 区域内的高温区与次高温区 热岛足迹内部的中温区、次低温区与低温区 |
| 较安全 安全 | 热岛足迹外部的中温区 热岛足迹外部的次低温区与低温区 |
Fig. 3 Spatial distribution of LST and security pattern of the Yangtze River Delta in 2015图3 2015年长江三角洲城市群地表温度与安全格局空间分布图 |
Tab. 3 Area and its proportion of different LST thermodynamic levels in the Yangtze River Delta in 2015表3 2015年长江三角洲城市群不同地表温度热力等级面积及比例 |
| 地表温度等级 | 面积/km2 | 比例/% |
|---|---|---|
| 低温 | 5925.59 | 5.96 |
| 次低温 | 21 422.25 | 21.54 |
| 中温 | 36 791.99 | 36.99 |
| 次高温 | 26 348.76 | 26.49 |
| 高温 | 8969.99 | 9.02 |
Tab. 4 Area and its proportion of different security level regions in the Yangtze River Delta from 2005 to 2015表4 2005-2015年长江三角洲城市群不同安全等级区域面积(km2)及比例(%) |
| 区域 | 2005年 | 2010年 | 2015年 | |||||
|---|---|---|---|---|---|---|---|---|
| 面积 | 比例 | 面积 | 比例 | 面积 | 比例 | |||
| 不安全 | 23 278.62 | 23.41 | 29 361.92 | 29.52 | 35 222.33 | 35.41 | ||
| 临界安全 | 5059.76 | 5.09 | 6578.00 | 6.61 | 7196.30 | 7.24 | ||
| 较安全 | 46 319.21 | 46.57 | 39 262.04 | 39.48 | 31 583.56 | 31.76 | ||
| 安全 | 24 801.00 | 24.93 | 24 256.63 | 24.39 | 25 456.40 | 25.59 | ||
Fig. 4 Spatial distribution of heat environment security pattern in the Yangtze River Delta from 2005 to 2010图4 2005-2010年长江三角洲城市群热环境安全格局空间分布图 |
Tab. 5 Change area and its proportion of different security level regions in the Yangtze River Delta from 2005 to 2015表5 2005-2015年长江三角洲城市群不同安全等级区域变化面积(km2)及比例(%) |
| 城市 | 2005-2010年变化面积 | 2010-2015年变化面积 | 2005-2015年变化比例 | |||||||||||
|---|---|---|---|---|---|---|---|---|---|---|---|---|---|---|
| 不安全 | 临界安全 | 较安全 | 安全 | 不安全 | 临界安全 | 较安全 | 安全 | 不安全 | 临界安全 | 较安全 | 安全 | |||
| 上海 | 350.84 | 19.66 | -521.60 | 151.10 | 878.17 | 22.55 | -658.45 | -242.27 | 21.13 | 0.73 | -20.29 | -1.57 | ||
| 南京 | 752.39 | 429.49 | -1043.21 | -138.68 | -32.66 | 263.77 | -312.07 | 80.96 | 11.78 | 11.35 | -22.18 | -0.94 | ||
| 无锡 | 356.02 | 204.92 | -413.97 | -146.96 | 154.53 | 27.46 | -99.35 | -82.65 | 11.60 | 5.28 | -11.66 | -5.22 | ||
| 常州 | 421.22 | 158.34 | -467.79 | -111.77 | 0.74 | 50.34 | -118.45 | 67.38 | 10.23 | 5.06 | -14.22 | -1.08 | ||
| 苏州 | 458.47 | 292.88 | -495.73 | -255.63 | 1013.61 | -38.84 | -681.22 | -293.55 | 19.30 | 3.33 | -15.43 | -7.20 | ||
| 南通 | -1574.12 | 200.78 | -509.18 | 1882.53 | 1382.36 | -247.83 | 846.66 | -1981.19 | -2.39 | -0.59 | 4.21 | -1.23 | ||
| 扬州 | 274.26 | 183.18 | -861.06 | 403.62 | 107.58 | 47.85 | 359.69 | -515.12 | 5.90 | 3.57 | -7.74 | -1.72 | ||
| 镇江 | 302.20 | -1.03 | -231.82 | -69.34 | 93.35 | 100.78 | -317.04 | 122.91 | 11.49 | 2.90 | -15.94 | 1.56 | ||
| 泰州 | 112.81 | 107.63 | -1018.37 | 797.93 | 48.53 | 154.13 | 32.47 | -235.14 | 2.94 | 4.77 | -17.98 | 10.26 | ||
| 杭州 | 1613.45 | -232.86 | 712.03 | -2092.62 | -470.62 | 184.19 | -3348.07 | 3634.49 | 7.45 | -0.32 | -17.19 | 10.06 | ||
| 宁波 | 446.05 | -39.33 | -303.23 | -103.49 | 561.44 | -25.86 | -523.05 | -12.52 | 13.44 | -0.87 | -11.02 | -1.55 | ||
| 绍兴 | 875.55 | -70.38 | -12.42 | -792.75 | 318.29 | 203.33 | -1402.99 | 881.37 | 15.60 | 1.74 | -18.49 | 1.16 | ||
| 湖州 | 978.01 | 91.07 | -719.27 | -349.81 | 48.30 | 50.87 | -390.17 | 290.99 | 19.40 | 2.68 | -20.97 | -1.11 | ||
| 嘉兴 | 1216.04 | -8.28 | -1172.57 | -35.19 | 287.35 | 0.03 | -247.39 | -40.00 | 42.14 | -0.23 | -39.80 | -2.11 | ||
| 台州 | -498.83 | 185.25 | 49.68 | 263.91 | 1425.83 | -183.67 | -821.85 | -420.32 | 11.31 | 0.02 | -9.42 | -1.91 | ||
| 舟山 | -1.03 | -3.10 | -48.64 | 52.78 | 43.61 | 9.19 | 2.78 | -55.58 | 10.11 | 1.44 | -10.89 | -0.66 | ||
Fig. 5 Proportion of land use in different security level regions in the Yangtze River Delta in 2015图5 2015年长江三角洲城市群不同区域内土地利用构成比例 |
Tab. 6 Change area of dominated land change types in the different security grading regions in theYangtze River Delta from 2005 to 2015 (102 km2)表6 2005-2015年长江三角洲城市群不同安全等级区域土地利用转移矩阵(102 km2) |
| 区域 | 耕地-林地 | 耕地-草地 | 耕地-水域 | 耕地-建设 | 林地-耕地 | 林地-建设 | 草地-建设 | 水域-建设 | 建设-耕地 |
|---|---|---|---|---|---|---|---|---|---|
| 不安全 | 3.57 | 0.24 | 2.95 | 49.67 | 3.33 | 2.07 | 0.12 | 2.07 | 9.41 |
| 临界安全 | 0.78 | 0.06 | 1.18 | 4.48 | 0.67 | 0.39 | 0.04 | 0.33 | 1.32 |
| 较安全 | 5.15 | 0.22 | 3.31 | 11.94 | 4.92 | 0.87 | 0.11 | 0.55 | 5.68 |
| 安全 | 3.35 | 0.12 | 2.81 | 2.09 | 3.13 | 0.70 | 0.07 | 0.18 | 1.20 |
| 合计 | 12.85 | 0.64 | 10.25 | 68.18 | 12.05 | 4.03 | 0.34 | 3.13 | 17.61 |
The authors have declared that no competing interests exist.
| [1] |
|
| [2] |
|
| [3] |
|
| [4] |
|
| [5] |
[
|
| [6] |
[
|
| [7] |
|
| [8] |
|
| [9] |
[
|
| [10] |
[
|
| [11] |
[
|
| [12] |
|
| [13] |
[ Zheng Z F, Zheng Y, Li Q C. Effect of urbanization on the temperature of Beijing metropolis in recent 30 years[J]. Chinese Journal of Eco-Agriculture, 2007,15(4):26-29. ]
|
| [14] |
[
|
| [15] |
[
|
| [16] |
[
|
| [17] |
[
|
| [18] |
[
|
| [19] |
[
|
| [20] |
[
|
| [21] |
[
|
| [22] |
|
| [23] |
|
| [24] |
|
| [25] |
|
| [26] |
|
| [27] |
|
| [28] |
|
| [29] |
|
| [30] |
[
|
| [31] |
[
|
| [32] |
[
|
| [33] |
[
|
| [34] |
[ Kang W X, Wu Y X, He J N, et al. Research progress of urban heat island effect[J]. Journal of Central South University of Forestry&Technology, 2011,31(1):70-76. ]
|
| [35] |
[
|
| [36] |
[
|
| [37] |
[
|
/
| 〈 |
|
〉 |