
Journal of Geo-information Science >
Analysis on Spatio-temporal Variation of Land Use and its Policy-Driven Factors inWuhan Metropolitan Area
Received date: 2016-06-30
Request revised date: 2016-10-10
Online published: 2017-01-13
Copyright
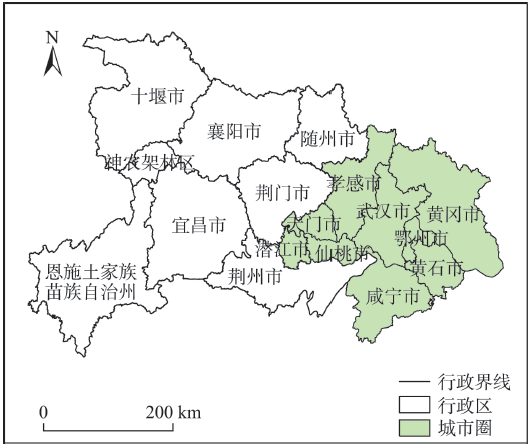
Wuhan Metropolitan Area is one of the earliest comprehensive reform pilot area of resource-saving and environment-friendly society construction. It is also key areas of the Central China Development Strategy and the Yangtze River Economic Belt. Scientifically understanding temporal characteristics of land use change of Wuhan Metropolitan Area is of great significance for formulation and implementation of regional land use policy. Based on the land use data in 2000, 2005, 2010 and 2015 of Wuhan Metropolitan Area combined with GIS spatial analysis, mathematical statistics, single land use dynamic degree, transfer matrix and integrated land use dynamic degree methods of land use, we studied the general characteristics of land use change, the direction of change and regional differences in characteristics of Wuhan Metropolitan Area during 2000 to 2015, and analyzed the policy-driven factors of land use change. The results showed that: (1) for the general characteristics, during 2000 to 2015, cultivated land, woodland, grassland and unused land was diminishing while residential land and water area was increasing. (2) For the changes in direction, during 2000 to 2015, cultivated land and forest land transformed to residential land and water was the main feature. During 2000 to 2005, farmland and residential land transformed to water was the main feature. During 2005 to 2010, cultivated land transformed to residential land, water and forest land transformed to residential land were the main feature. During 2010 to 2015, cultivated land, woodland, grassland and water transformed to residential land was the main feature. (3) For spatial and temporal differences at regional scale, the largest dynamic degree of integrated land use concentrated in the central area of Wuhan Metropolitan Area. From the aspect of dynamics degree of single land use, cultivated land was concentrated in surrounding areas of Wuhan Metropolitan Area. Residential land was mainly located in central region of Wuhan Metropolitan Area. Water was concentrated in Xiantao City of Wuhan Metropolitan Area. Woodland was mainly located in Qianjiang city, Yunmeng County. The grass was mainly located in Yingshan County. (4) For the analysis of policy-driven factors, reforestation, urbanization, the rise of the Central Plains, two-oriented society, the development strategy of Yangtze River economic belt and other policies have important implications on land use change.
HUANG Duan , LI Rendong , QIU Juan , SHI Yuanyuan , LIU Jianhong . Analysis on Spatio-temporal Variation of Land Use and its Policy-Driven Factors inWuhan Metropolitan Area[J]. Journal of Geo-information Science, 2017 , 19(1) : 80 -90 . DOI: 10.3724/SP.J.1047.2017.00080
Fig. 2 Land use classification data in Wuhan Metropolitan Area during 2000-2015图2 2000-2015年武汉城市圈4个时相的土地利用分类数据 |
Tab. 1 Area and proportion of different land use types in Wuhan Metropolitan Area during 2000-2015表1 2000-2015年武汉城市圈不同地类面积及百分比 |
| 土地利用类型 | 2000年 | 2005年 | 2010年 | 2015年 | |||||||
|---|---|---|---|---|---|---|---|---|---|---|---|
| 面积/hm2 | 比重/% | 面积/hm2 | 比重/% | 面积/hm2 | 比重/% | 面积/hm2 | 比重/% | ||||
| 耕地 | 2 929 455.65 | 50.54 | 2 888 776.94 | 49.84 | 2 839 111.76 | 48.97 | 2 774 679.54 | 47.86 | |||
| 林地 | 1 767 264.10 | 30.49 | 1 766 439.64 | 30.47 | 1 757 934.49 | 30.32 | 1 748 405.84 | 30.16 | |||
| 草地 | 142 275.32 | 2.45 | 141 313.14 | 2.44 | 140 689.46 | 2.43 | 139 919.27 | 2.41 | |||
| 水域 | 609 022.69 | 10.51 | 634 059.17 | 10.94 | 634 665.76 | 10.95 | 635 722.57 | 10.97 | |||
| 建设用地 | 327 741.18 | 5.65 | 347 824.73 | 6.00 | 407 120.67 | 7.02 | 481 198.87 | 8.30 | |||
| 未利用地 | 20 092.52 | 0.35 | 18 124.12 | 0.31 | 17 676.32 | 0.30 | 17 272.36 | 0.30 | |||
| 合计 | 5 795 851.46 | 100 | 5 796 537.75 | 100 | 5 797 198.45 | 100 | 5 797 198.45 | 100 | |||
Tab. 2 Dynamic index of different land use yypes in Wuhan Metropolitan Area during 2000-2015(hm2)表2 2000-2015年武汉城市圈不同地类面积变化与动态度(hm2) |
| 土地利用类型 | 2000-2005年 | 2005-2010年 | 2010-2015年 | 2000-2015年 | |||||||
|---|---|---|---|---|---|---|---|---|---|---|---|
| 变化面积 | 动态度 | 变化面积 | 动态度 | 变化面积 | 动态度 | 变化面积 | 动态度 | ||||
| 耕地 | -40 678.71 | -0.28 | -49 665.18 | -0.34 | -64 432.22 | -0.45 | -154 776.11 | -0.35 | |||
| 林地 | -824.45 | -0.01 | -8505.15 | -0.10 | -9528.65 | -0.11 | -18 858.26 | -0.07 | |||
| 草地 | -962.18 | -0.14 | -623.68 | -0.09 | -770.19 | -0.11 | -2356.05 | -0.11 | |||
| 水域 | 25 036.48 | 0.82 | 606.59 | 0.02 | 1056.81 | 0.03 | 26 699.88 | 0.29 | |||
| 建设用地 | 20 083.55 | 1.23 | 59 295.93 | 3.41 | 74 078.20 | 3.64 | 153 457.68 | 3.12 | |||
| 未利用地 | -1968.40 | -1.96 | -447.81 | -0.49 | -403.96 | -0.46 | -2820.16 | -0.94 | |||
Tab. 3 Transfer matrix of land use in Wuhan Metropolitan Area during 2000-2015(hm2)表3 2000-2015年武汉城市圈土地利用转移矩阵(hm2) |
| 土地利用类型 | 2015年 | |||||||
|---|---|---|---|---|---|---|---|---|
| 耕地 | 建设用地 | 草地 | 林地 | 水域 | 未利用地 | 转出合计 | ||
| 2000年 | 耕地 | – | 116 639.8 | 284.5 | 3157.8 | 40343.1 | 100.0 | 160 525.2 |
| 建设用地 | 0.0 | – | 0.0 | 0.0 | 14.3 | 0.0 | 14.3 | |
| 草地 | 108.5 | 1930.3 | – | 793.8 | 924.0 | 0.0 | 3756.6 | |
| 林地 | 158.0 | 21 599.4 | 349.9 | – | 892.9 | 26.3 | 23 026.5 | |
| 水域 | 5186.1 | 12 131.9 | 563.3 | 110.4 | – | 1982.6 | 19 974.3 | |
| 未利用地 | 40.5 | 701.0 | 156.6 | 51.4 | 4008.0 | – | 4957.5 | |
| 转入合计 | 5493.1 | 153 002.4 | 1354.3 | 4113.4 | 46 182.3 | 2108.9 | – | |
Tab. 4 Transfer matrix of land use of different stages in Wuhan Metropolitan Area (hm2)表4 武汉城市圈不同阶段土地利用转移矩阵(hm2) |
| 土地利用类型 | 2005年 | |||||||
|---|---|---|---|---|---|---|---|---|
| 耕地 | 建设用地 | 草地 | 林地 | 水域 | 未利用地 | 转出合计 | ||
| 2000年 | 耕地 | – | 15 070.1 | 88.8 | 885.8 | 28 205.8 | 50.0 | 44 300.5 |
| 建设用地 | 0 | – | 0 | 0 | 12.9 | 0 | 12.9 | |
| 草地 | 8.8 | 337.0 | – | 326.3 | 1057.0 | 0 | 1729.1 | |
| 林地 | 7.9 | 1837.9 | 22.3 | – | 750.9 | 14.8 | 2633.8 | |
| 水域 | 2060.9 | 2893.3 | 341.3 | 6.8 | – | 2423.1 | 7725.4 | |
| 未利用地 | 28.6 | 191.8 | 165.1 | 27.2 | 3553.1 | – | 3965.8 | |
| 转入合计 | 2106.2 | 20 330.1 | 617.5 | 1246.1 | 33 579.7 | 2487.9 | – | |
| 土地利用类型 | 2010年 | |||||||
| 耕地 | 建设用地 | 草地 | 林地 | 水域 | 未利用地 | 转出合计 | ||
| 2005年 | 耕地 | – | 44357.9 | 213.8 | 1443.3 | 8257.5 | 40.1 | 54 312.6 |
| 建设用地 | 0 | – | 0 | 0 | 1.4 | 0 | 1.4 | |
| 草地 | 73.5 | 791.8 | – | 402.9 | 21.2 | 18.7 | 1308.1 | |
| 林地 | 99.2 | 9866.8 | 325.8 | – | 180.7 | 0 | 10 472.5 | |
| 水域 | 4230.7 | 3886.4 | 132.6 | 62 | – | 182.5 | 8494.2 | |
| 未利用地 | 1.7 | 195.6 | 0 | 16.7 | 481.5 | – | 695.5 | |
| 转入合计 | 4405.1 | 59 098.5 | 672.2 | 1924.9 | 8942.3 | 241.3 | – | |
| 土地利用类型 | 2015年 | |||||||
| 耕地 | 建设用地 | 草地 | 林地 | 水域 | 未利用地 | 转出合计 | ||
| 2010年 | 耕地 | – | 58 233.2 | 0 | 413.3 | 6159.4 | 28.5 | 64 834.4 |
| 建设用地 | 0 | – | 0 | 0 | 0 | 0 | 0 | |
| 草地 | 0 | 793.6 | – | 52.2 | 8.9 | 0 | 854.7 | |
| 林地 | 14.7 | 9988.1 | 21.1 | – | 7 | 11.5 | 10 042.4 | |
| 水域 | 387.5 | 4794.4 | 58.6 | 40.8 | – | 0 | 5281.3 | |
| 未利用地 | 0 | 268.8 | 4.8 | 7.4 | 162.9 | – | 443.9 | |
| 转入合计 | 402.2 | 74 078.1 | 84.5 | 513.7 | 6338.2 | 40 | – | |
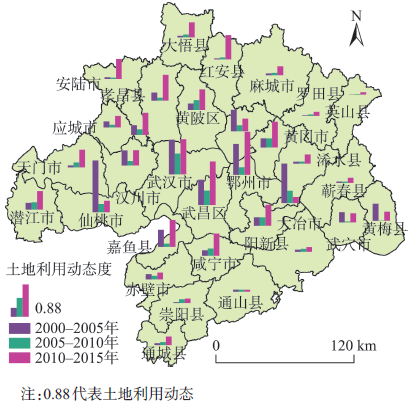
Fig. 3 Regional differences of land use change characteristics of different stages in Wuhan Metropolitan Area图3 武汉城市圈不同阶段土地利用变化的区域差异 |
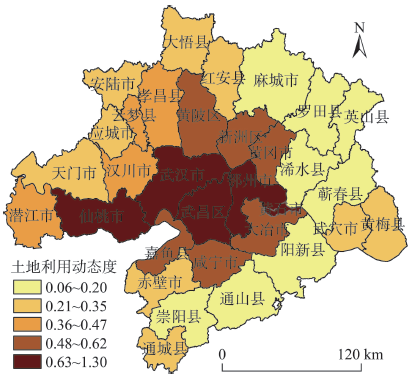
Fig. 4 Integrated dynamic index of land use in each county of Wuhan Metropolitan Area during 2000-2015图4 武汉城市圈2000-2015年各县域综合土地利用动态度 |
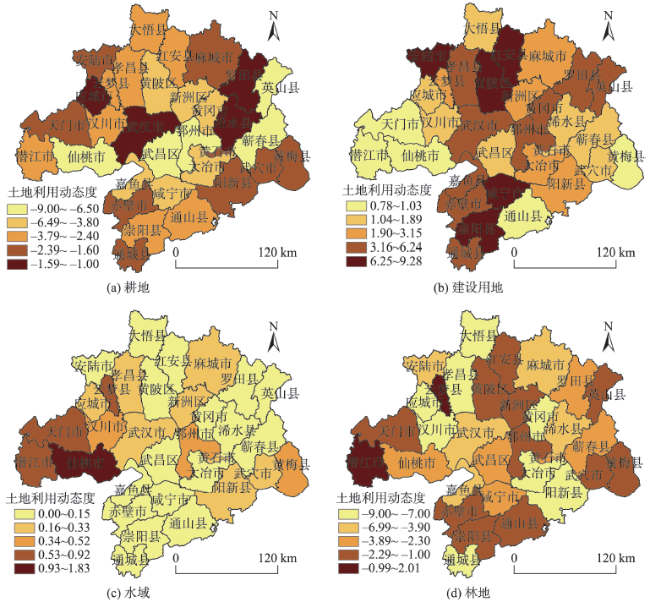
Fig. 5 Single dynamic index of land use in each district of Wuhan Metropolitan Area during 2000-2015图5 武汉城市圈2000-2015年各县域单一土地利用动态度 |
The authors have declared that no competing interests exist.
| [1] |
|
| [2] |
|
| [3] |
[
|
| [4] |
[
|
| [5] |
[
|
| [6] |
[
|
| [7] |
[ Zhang X R, Liu L P, Fang S, et al. Research Advances on the Relationship between Land Use/Cover Change and Environmental Change[J]. Ecology and Environment Sciences, 2014,12:2013-2021. ]
|
| [8] |
|
| [9] |
|
| [10] |
|
| [11] |
|
| [12] |
|
| [13] |
[
|
| [14] |
[
|
| [15] |
[
|
| [16] |
[
|
| [17] |
[
|
| [18] |
[
|
| [19] |
[
|
| [20] |
[
|
| [21] |
[
|
| [22] |
[
|
| [23] |
[ Jiang D C, Xiao W H, Fan C Y, et al. Research on Water Resources and Water Environment Carrying Capacities of Wuhan City Circle[J]. Resources and Environment In The Yangtze Basin,2016,5:761-768. ]
|
| [24] |
[
|
| [25] |
[
|
| [26] |
[
|
| [27] |
[ Li C Z, Yu F L, Liu J. Dynamic change of landscape and its driving forces in midstream of Heihe mainstream basin after water redistribution[J]. Acta Ecol Sinica, 2009,29(11):5832-5842. ]
|
| [28] |
[ Xu X L, Pang Z G, Yu X F. Spatial-Temporal Pattern Analysis of Land Use/Cover Change: Methods & Applications[M]. Beijing: Scientific and Technical Documentation Press,2014 ]
|
| [29] |
[
|
| [30] |
[
|
| [31] |
[
|
| [32] |
[
|
| [33] |
|
/
| 〈 |
|
〉 |
