Orginal Article

Characteristics of the Spatial Variation of Soil Nutrients in Farmland of Fuzhou City

  • CHEN Guixiang , 1, 2 ,
  • GAO Dengzhou 1, 2 ,
  • ZENG Congsheng , 1, 2, 3, * ,
  • WANG Weiqi 2, 3
Expand
  • 1. School of Geographical Sciences, Fujian Normal Universities, Fuzhou 350007, China
  • 2, Key Laboratory of Humid Sub-tropical Eco-geographical Process of Ministry of Education, Fuzhou 350007, China
  • 3, Research Centre of Wetlands inSubtropical Region, Fuzhou 350007, China
*Corresponding author: ZENG Congsheng, E-mail:

Received date: 2016-03-15

  Request revised date: 2016-06-23

  Online published: 2017-02-17

Copyright

《地球信息科学学报》编辑部 所有

Abstract

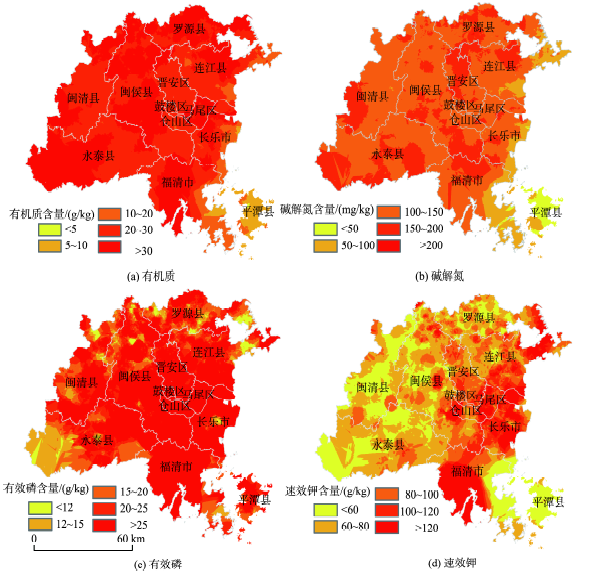
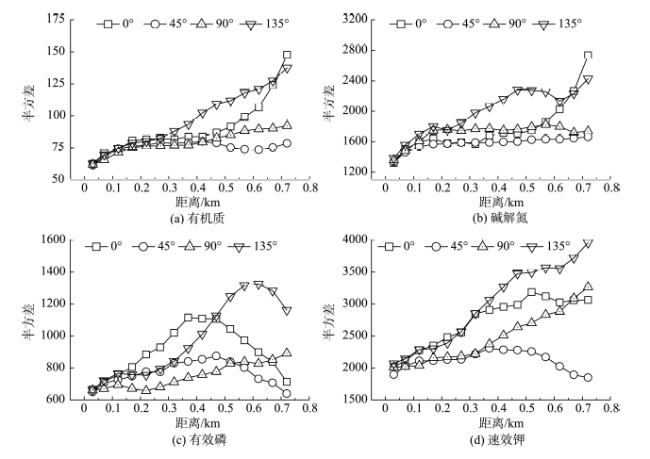
It is very important to study the characteristics of spatial pattern and variation of soil nutrients and analyze the effect of topographical factors on the spatial distribution of soil nutrients for the effective use and management of soil nutrients. In this paper, the combination of GIS and Geostatistics methods were applied to analyze the spatial distribution characteristics and variation pattern of soil nutrients (organic matter, available nitrogen, available phosphors and available potassium) in the agricultural land of southeast hilly area of Fuzhou. We further studied the correlation between soil nutrients content and topographical factors (topography degrees, elevation, topographic wetness index, deposition and transport index and gradient). The results showed that: the range of organic matter, available nitrogen, available phosphors and available potassium contents were between 1.10~89.5 g/kg, 1.00~461 mg/kg, 0.300~298 mg/kg, 4.00~399 mg/kg and the range of variation coefficients were 35.3~99.0%, which belonged to moderate variability. There was obviously different in the spatial abundance of soil nutrients in the cultivated land. In most of the area, the organic matter and available phosphors content were abundant, available nitrogen content was a little above average level and available potassium content was relatively scarce. The nugget coefficient of organic matter, available nitrogen, available phosphors and available potassium were 32.0%, 37.3%,50.0% and 50.0%, respectively. They were medium spatial autocorrelation, indicating that they were controlled by structure and randomness. Spatial autocorrelation scale of organic matter and available nitrogen were large. They change smoothly in each direction (0°, 45°, 90° and 135°) when the step length was less than 0.3 km.and are isotropic. The variation of effective phosphorus and available potassium was small. Their direction of change was complex and they are anisotropy. These results suggested that the government needed to strengthen guidance of fertilization. Nitrogen fertilizer amount should be maintained and the potash should be increased reasonably. The organic fertilizer and phosphate fertilization should be decreased.. In addition, in the subsequent investigation, the setup of sample points should consider density and direction and appropriately increase the sampling of effective phosphorus and available potassium while nitrogen and organic matter and alkali solution sampling can be reduced based on the study.

Cite this article

CHEN Guixiang , GAO Dengzhou , ZENG Congsheng , WANG Weiqi . Characteristics of the Spatial Variation of Soil Nutrients in Farmland of Fuzhou City[J]. Journal of Geo-information Science, 2017 , 19(2) : 216 -224 . DOI: 10.3724/SP.J.1047.2017.00216

1 引言

农田土壤养分是土地生产力的基础,是农作物生长的必要条件,也是衡量土壤质量好坏的重要指标之一[1]。随着农业的发展,如种植制度、耕作制度和施肥水平等因素的变化,农业用地土壤养分也会随之发生变化[2-3]。因此,开展区域土地质量评价,探讨农田土壤养分的空间变异特征,对提高农业土肥利用效率、改善田间管理,以及合理进行土地利用提供理论依据,实现土地可持续利用具有重要意义。
地统计学已被认为是分析土壤特性空间变异特征最为有效的方法之一[4]。国外较早开始关注土壤养分含量及其空间变异的定量化研究,自Campbell[5]将地统计学引入土壤研究以来,学者对土壤特性空间变异性的认识也逐步深化,如Webster等[6]基于 1 hm2农田土壤微量营养元素空间变异性研究发现,铁和锰具有较强的空间自相关性,Mallarino A P[7]研究发现小区域玉米和大豆土壤养分也具较高的空间自相关,而后White等[8]、López-Granados[9]、Iqbal10]和Fu等[4]分别对美国农业用地、西班牙农业用地、苏格兰棉花用地和爱尔兰牧草地等土壤养分空间变异性进行研究,其结果也不尽一致。中国在土壤养分空间变异特征研究起步相对较晚,近年来GIS技术结合地统计学在土壤养分空间变异特征研究也得到越来越广泛的应用[11],并取得了较好的研究成果,这些研究涵盖了农田[12-13]、草地[14]和林地[15]等用地土壤养分空间变异规律。前人的研究表明,土壤养分的空间变异主要受成土母质、地形和人类活动干扰等的影响。在中小尺度上,影响土壤养分变异的主要因素是土壤养分管理,如施肥量、种植制度和耕作方式等,而在大尺度上,气候条件、地形地貌、土壤类型等被认为是影响土壤养分变异性的主要因素[16]。目前,居于中国有关农业用地质量评价和土壤养分空间变异特征的研究主要集中于西北高原及绿洲盆地[17]、华北平原[12,18-19]、长江中下游平原[13]和西南丘陵一带[20-21],针对中国东南丘陵地区农业用地土壤养分研究相对比较零散[2],且多基于单一的农业用地类型[2,22],因此东南丘陵农业用地土壤养分空间变异特征有待于进一步研究。福州市是福建重要的农业和蔬菜生产基地,承担着省会及附近地区的农副产品供应。近年来有资料表明,福州市城郊区、近郊区土壤面临着质量下降和污染的风险[23]。基于此,本文以福州市为研究区(包括原平潭县),综合考虑不同农业用地类型,分析土壤养分含量和等级指标,揭示其空间分异特征,旨在为福州市农业用地土壤的可持续利用和农业的可持续发展提供参考依据。

2 研究区概况与研究方法

2.1 研究区概况

福州市位于福建省东部沿海,与台湾隔海相望,行政上辖5区(鼓楼、台江、仓山、马尾、晋安)7县市(闽侯县、长乐市、福清市、连江县、罗源县、闽清县、永泰县)以及原隶属福州市的平潭县,现为平潭综合实验区(图1)。在市域范围内,各种地貌类型大致呈半环状分布,西半部以山地为主,中间以河谷盆地和山间盆地;东半部以丘陵为主,平原与台地错杂其间。福州市属典型的亚热带季风气候,年平均日照数为1700~1980 h;年平均降水量为900~2100 mm;年平均气温为20~25 ℃,年相对湿度约77%。粮食以水稻为主,一年两到三熟,主要经济作物有蔬菜、水果、甘蔗、茶叶等[24]
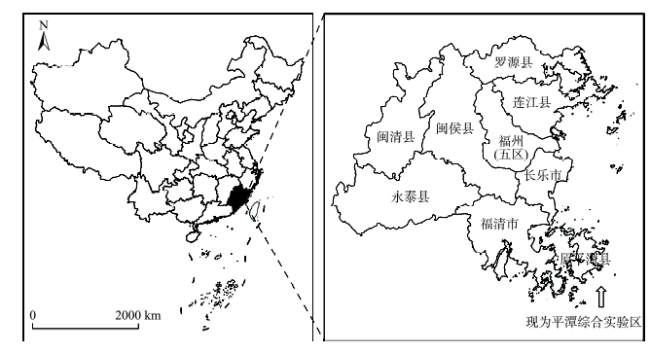
Fig. 1 Location map of Fuzhou (including the original Pingtan county)

图1 福州市(含原平潭县)区位图

2.2 研究方法

2.2.1 数据来源
研究区土壤养分(有机质、碱解氮、速效磷、速效钾)来源于福建省农业厅农业服务系统,选取分布于福州市5区7县及原平潭县有代表性的3585个样点。地形因子(地形起伏度、高程、地形湿度指 数[20]、沉积运输指数和坡度)则利用ArcGIS 10.1平台在ASTER GDEM提取。沉积物运输指数(STI)提取公式[21]如式(1)所示。
STI = As 22.13 0.6 × sinβ 0.0896 13 (1)
式中:As为单位长度等高线上地表水所流经的上游区域面积;β为地形坡度。
2.2.2 数据处理与分析方法
反映土壤养分的集中趋势的描述统计特征值包括最大值、最小值、平均值、标准差和变异系数(CV)。依据Nielsen分级标准[25],当CV<10%时,为弱变异;当10%≤CV≤100%时,为中等变异;当CV>100%时,为强变异。同时,根据福建省土壤肥力丰缺指标[2],将土壤养分分为偏高(I)、丰富(II)、中等(III)、缺乏(IV)和偏低(V)5种等级水平。
土壤养分描述性统计分析方法只能说明养分含量变化的全貌,不能反映土壤养分的结构性、随机性、相关性和独立性,而地统计学分析可以很好地反映土壤养分含量的空间变异结构[8]。地统计学是在传统统计学基础上发展起来的空间分析方法,以区域化变量理论为基础,以半方差函数为主要的工具,揭示属性变量在空间上的分布、变异和相关特征[26],及区分结构因素与随机因素对养分空间变异的影响。当区域化变量在任意方向上,满足二阶平稳性假设和本征假设时,其计算公式如式(2)所示。
γ ( h ) = 1 2 N ( h ) i = 1 N ( h ) [ Z ( X i ) - Z ( X i + h ) ] 2 (2)
式中:γ(h)为经验半方差函数;h为分隔2样点的矢量,称为步长;N(h)为被向量h间隔的实验数据点对的数目。Z(xi)和Z(xi+h)分别为区域变量Z(x)在位置xi的数值和在距离xi+h处的数值。半变异函数包括几个重要参数,如块金值(C0)、基台值(C0+C)、变程(a),可一定程度上揭示变量空间变异和相关性[27]。其中,块金值和基台值的比值(C0/(C0+C))表示块金效应,反映系统变量的空间相关程度。当C0/(C0+C)<25%时,表明变量有强烈的空间相关性,其变异性主要受结构因素(地形、气候、土壤母质等)影响;当25%≤C0/(C0 +C)≤75%时,表明变量具有中等程度的空间相关性,受结构和随机因素(施肥、种植方式或耕作措施等)共同作用;当C0/(C0 +C)>75%时,表明变量的空间相关性较弱[28],主要受随机因素影响。
采用SPSS 19.0对土壤养分含量进行描述性统计,采用GiS+10.0进行空间自相关分析和半变异函数分析。基于ArcGIS 10.1,利用空间插值中的克里金插值法完成土壤有机质及速效养分空间分布特征图,用Origin 8.0作图。

3 结果分析

3.1 土壤养分统计特征

土壤养分描述统计特征如表1所示。有机质、碱解氮、有效磷和速效钾含量分别介于1.10~89.5 g/kg,1.00~461 mg/kg,0.3~298 mg/kg,4.0~399 mg/kg,平均含量分别为29.9 g/kg,135 mg/kg,33.9 mg/kg与80.8 mg/kg。从标准差和CV看,各养分离散程度较大,CV在35.3%~99.0%之间,均属于中等变异水平,其中有机质、碱解氮的CV较小,分别为35.9%和35.3%,而有效磷和速效钾的CV较大,分别高达99.0%和69.6%。
Tab. 1 Descriptive statistics of soil nutrients

表1 土壤养分描述统计特征

指标 最大值 最小值 均值 标准差 CV/%
有机质/(g/kg) 89.5 1.1 29.9 10.7 35.9
碱解氮/(mg/kg) 461 1.0 135 47.7 35.3
有效磷/(mg/kg) 298 0.3 33.9 33.5 99.0
速效钾/(mg/kg) 399 4.0 80.8 56.2 69.6

3.2 土壤养分含量等级指标及空间分布特征

通过对照福建省土壤肥力丰缺指标标准(表2)和福州市农业用地土壤养分含量等级比例可知,区域内土壤有机质和有效磷含量较为丰富,其I级和II级水平分别高达83.6%和52.6%,而土壤碱解氮含量处于中等水平,Ⅱ和III级水平共占72.4%。另外,速效钾含量则相对匮乏,IV和V级水平高达67.4%。总体表现为,有机质和有效磷含量盈余,碱解氮含量中等偏高,速效钾含量水平较低。
Tab. 2 Soil nutrient level index and distribution

表2 土壤养分等级指标及分布

指标 项目 偏低V 缺乏IV 中等III 丰富II 偏高I
有机质/(g/kg) 标准 <5 5~10 10~20 20~30 >30
比例/% 1.84 3.74 10.8 33.0 50.6
碱解氮/(mg/kg) 标准 <50 50~100 100~150 150~200 >200
比例/% 5.08 15.00 45.50 26.90 7.53
有效磷/(mg/kg) 标准 <12 12-15 15-20 20-25 >25
比例/% 26.9 9.17 11.30 7.45 45.20
速效钾/(mg/kg) 标准 <60 60~80 80~100 100~120 >120
比例/% 52.30 15.10 9.84 6.19 16.50
从有机质、碱解氮、有效磷和速效钾养分空间分布格局来看(图2),福州市农业用地土壤养分空间分布不均。其中,有机质含量总体较高,尤其是在北部、中部、西南和南部地区,而东南沿海地区相对较低,主要在平潭和福清湾沿海区域;碱解氮与有机质空间格局上有着一定的相似性,但是相对于有机质,碱解氮在空间分布上较为均一。在北部、西部和中部只有小面积的斑块状高值区,平潭和福清湾沿海区域也相对较低;土壤有效磷和速效钾的空间分布相对复杂。有效磷含量总体上显示出东南高西北低趋势,高值区相对集中在东南部,低值区主要集中分布在西南和北部,以斑块状分布,整体上有效磷含量较高,能够满足作物的生长需求;速效钾在整个区域内分布不均匀,高值区相对分散,主要以斑块状分布在东部沿海(除平潭和福清湾沿海区域外),总体上速效钾含量处于较低水平。
Fig. 2 Spatial distribution of soil nutrient of agricultural land in Fuzhou

图2 福州市农业用地土壤养分空间分布特征

3.3 土壤养分空间变异特征

表3为土壤养分各向同性下半变异方差函数理论模型及参数,4种土壤养分最优拟合的理论模型均为指数模型。当有机质和速效钾土壤养分的决定系数r2均接近于1,变异曲线变化比较平稳,均与相应的理论模型符合较好。有机质、碱解氮、有效磷和速效钾的块金效应分别为32.0%、37.3%、50.0%和50.0%,这表明福州市农田土壤养分在区域内均存在中等空间相关性,说明各养分含量受结构因素和随机因素共同引起。从变程即自相关范围看,本研究区各养分之间变程差异较大(0.45~ 1.85 km)(表3),说明其影响因素在不同尺度上起作用。有机质的变程最大,为1.85 km;其次是速效钾、碱解氮,变程分别为0.82 km和0.71 km,这说明控制这3种养分的生态过程在较大尺度上起作用。有效磷的变程最小,为0.45 km,表明控制这种土壤养分的生态过程在较小尺度上起作用。
Tab. 3 Semivariogram theoretical models and parameters for soil nutrients

表3 土壤养分半方差函数理论模型及相关参数

指标 模型 C0 C0+C C0/(C0+C) a/km r2
有机质 指数模型 61.6 193 0.32 1.85 0.92
碱解氮 指数模型 677 1841 0.37 0.71 0.60
有效磷 指数模型 462 924 0.50 0.45 0.70
速效钾 指数模型 1893 3787 0.50 0.82 0.97
图3所示,土壤各养分不同方向(0、45、90和135°)的变异函数差异较大,总体上表现出明显的方向性特征。有机质和碱解氮在步长小于0.3 km时,半方差变化较平稳,增加比较缓慢,各个方向的变异函数基本重合,一定程度上表现为各向同性,而当步长大于0.3 km时,各个方向的变异函数变化较大表现为各向异性;有效磷和速效钾在步长小于0.1 km范围内,各个方向函数基本重合,一定程度表现为各向同性,而当步长大于0.1 km时,各方向变异函数波动性较为剧烈,差异较大,表现为各项异性。
Fig. 3 Anisotropic semivariogram of soil nutrients

图3 土壤养分各向异性半方差函数图

3.4 土壤养分与地形因子相关关系

土壤养分与地形因子相关分析显示(表4),有机质、碱解氮与地形起伏度、高程、沉积物运输指数和坡度均呈极显著正相关(p<0.01),而与地形湿度指数呈极显著负相关(p<0.01),其中与高程相关系数较大。有效磷、速效钾与地形起伏度、高程和坡度呈极显著负相关(p<0.01),而与地形湿度指数呈极显著正相关(p<0.01),与沉积物运输指数相关性则不显著。
Tab. 4 The relationship between soilnutrients and terrain factors

表4 土壤养分与地形因子相关关系

地形
起伏度
高程 地形湿度
指数
沉积物
运输指数
坡度
有机质 0.177** 0.301** -0.146** 0.059** 0.150**
碱解氮 0.172** 0.212** -0.131** 0.057** 0.150**
有效磷 -0.071** -0.102** 0.076** -0.024 -0.066**
速效钾 -0.070** -0.111** 0.064** -0.029 -0.062**

注:**表示P<0.01,*表示P<0.05

4 讨论

4.1 土壤养分总体特征

有机质作为土壤肥力的重要指标,同时也是制约土壤理化性质的关键因素[17]。本文研究结果显示福州市农田有机质含量总体属于较丰富水平,能够较大程度满足作物生长需求。有机质的积累主要受气候(水热状况)、植被条件及人为活动的共同影响。本文研究区受亚热带季风气候的影响,气温较高,雨量充沛,良好的温湿组合有利于生物的繁衍和生长,增加生物自肥(积累)作用,利于有机质的贮量[29],加上耕作过程中有机物料投入量大,如作物秸秆还田,生物归还量大有利于有机质的积累,从而使土壤有机质养分含量较高[2]。有研究指出作物秸秆还田不仅可以提高土壤有机质含量,同时也可补充土壤碱解氮含量,土壤有机质的积累和分解会直接影响氮素的储存和转化[30],而且有机质的矿化可以释放出碱解氮[31],所以研究区内碱解氮含量分布的空间格局与有机质有一定的相似性。碱解氮作为植物生活所必需且易被吸收利用的营养元素[32],其含量可能与作物营养特性和作物生长时间有关,通过调查得知,福州市主要种植水稻、甘薯、铃薯、花椰菜等喜氮作物,土壤中碱解氮较多被作物吸收利用,这也一定程度导致碱解氮总体水平较低。另外,从整个区域来看,有效磷的含量处于较丰富水平,但是整体上有效磷的分布在东部沿海较高,而西南和北部部分区域较低,造成其空间分布格局差异的原因可能与种植方式和种植过程中施用磷肥量有很大关系。据调查得知,福州市西南部主要以种植水稻为主,其他区域除了水稻外,更多的是蔬菜类作物(如花生、甘薯等),而在水稻的耙田和分蘖等生长期施加的磷肥较少,约为蔬菜作物的40.00%~57.11%[22],这使得该区域除西南部外,其余地区土壤磷含量较高。而速效钾在研究区域内分布不均,含量较低,处于较低水平,这主要归因于福州市农业生产过程中钾肥施加强度较低,同时还受到钾素本身易流失特性的影响[22]。本文研究结果还发现在平潭和福清湾沿海区域有机质、碱解氮、速效钾出现低值,而有效磷则相对较高,可能是该区域所处的大环境风力较强,降雨集中,容易造成土壤养分淋失,因而土壤养分均较为缺乏[33],而有效磷则因为其本身移动性较差的性质,且容易被土壤固定,使含量相对丰富。因此,在平潭岛和福清湾沿岸的农业生产过程中保证磷肥的同时,有目的的多施加有机肥、氮肥和钾肥,少施加磷肥。

4.2 土壤养分空间变异性及其影响因素

土壤养分含量的空间变异是由土壤类型、地形、母质以及种植制度、耕作措施等各种因素在不同方向、不同尺度下共同作用的结果[17]。本文研究土壤养分半变异方差函数结果表明,研究区内土壤均具有良好的空间结构,在空间自相关范围内,有机质、碱解氮、有效磷和速效钾表现为中等强度的自相关性(块金效应分别为32.0%、37.3%,50.0%和50.0%),表明土壤养分空间变异是由结构因素(气候、母质、地形、土壤类型)和随机因素(施肥、耕作等人为活动)共同影响的结果,这与孔庆波等[2]对福建闽侯和晋江县域耕地土壤养分(闽侯速效钾除外)以及邓欧平等[21]对川中紫色丘陵区土壤养分空间变异研究结果相一致。这主要是由于在福州市尺度区域内,气候、母质、土壤类型等条件总体较一致,但经过长期的农业栽培管理,土壤养分也发生一定变化,因而造成随机因素的影响逐渐加强。其中,有机质和碱解氮块金效应分别为32.0%和37.3%,均表现为中等强度的空间相关性,但在变程即自相关范围上有所差异,有机质变程为1.85 km,碱解氮为0.71 km,说明碱解氮受随机因素影响较大而造成自相关范围较小。出现这种结果可能是因为氮素作为植物生长的营养元素,植物对氮素的吸收利用较高,而区域内不同种植作物及氮肥的施用量也会减弱碱解氮的空间自相关,使其空间相关尺度减小[33]。土壤养分与地形因子相关分析表明(表4),有机质、碱解氮与地形起伏度、高程、沉积物运输指数、坡度和地形湿度指数极显著相关,其中与高程相关系数较大。这表明福州市有机质和碱解氮的空间变异在结构因素中受地形因子影响较大,尤其是高程。秦松等[34]认为海拔越高的区域,气温越低,蒸发量越小,湿度相对较大,有机质的分解速率小而比较容易富集。而德科加等[35]也指出,当海拔增加时,温度下降,有利于碱解氮的积累。本研究还发现有效磷的CV和块金效应分别为90.0%和50.0%,属中等变异和中等空间自相关,这可能是因为磷在土壤中的迁移转化过程包括如扩散、吸附、解吸、沉积、埋藏积累和有机磷矿化等[36],这决定了速效磷的含量受多种因素共同影响。有效磷在土壤中易被固定,移动性差,而各作物下施肥量不尽一致,从而使磷素分布不均,削弱了其空间相关性,使变异系数增大[18]。速效钾的块金效应为50.0%,也受随机因素和结构因素的共同作用。有效磷和速效钾与地形起伏度、高程、坡度和地形湿度指数呈显著相关,研究区的土壤类型主要以水稻土、红壤、赤红壤为主,在地形变化较大的区域,如坡度、地形起伏度变化较大的地方,极易发生钾磷等土壤速效养分的流失[22];同时,随着海拔的增加,湿度变大,气温较低,磷钾的转化率也降低[37]
此外,本研究对土壤养分各向异性研究发现,总体上有效磷和速效钾变异函数在各方向上变化较复杂,表现为各向异性,而有机质和碱解氮在步长小于0.3 km时,各方向上变异函数基本重合,为各向同性。区域内土壤特性各向异性半方差分析的研究,不仅可以进一步了解土壤空间变异特征,对后续调查研究中指导土壤采样具有重要意义[13]。因此,本研究结果显示,在后续调查采样时,样点布设要考虑密度和方向性,适当加密有效磷和速效钾的采样,而有机质和碱解氮采样可以在此基础上适当减少样点。

5 结论

(1)福州市土壤养分属于中等程度变异,区域内土壤养分存在明显的空间丰缺差异,大部分地区有机质(除平潭岛和福清湾区域)和有效磷含量较为丰富,碱解氮含量处于中等偏高水平,速效钾含量相对较低。为充分发挥区域内土壤肥力,需有针对性地进行施肥指导和管理,合理增加氮肥和钾肥施用强度,适当降低磷肥施用。
(2)有机质、碱解氮、有效磷和速效钾均为中等的空间自相关,受结构因素(气候、地形、母质或土壤类型等)和随机因素(施肥、种植方式或耕作措施等)共同作用。另外,有机质和碱解氮在步长小于 0.3 km,有效磷和速效钾在步长小于0.1 km时,各养分在各方向上变异函数基本重合,为各向同性。
(3)有机质和碱解氮与地形因子均呈极显著相关;有效磷和速效钾与地形起伏度、高程、坡度均呈极显著相关,与沉积物运输指数相关性不显著,说明结构因素中地形因子对土壤养分含量的影响较大。
(4)在后续调查采样时,样点布设要考虑密度和方向性,适当加密有效磷和速效钾的采样,而有机质和碱解氮采样可以在此基础上适当减少样点。

The authors have declared that no competing interests exist.

[1]
连纲,郭旭东,傅伯杰,等.黄土高原县域土壤养分空间变异特征及预测——以陕西省横山县为例[J].土壤学报,2008,45(4):577-584.研究土壤属性空间变异及其分布特征与环境因子的关系,对于了解生态系统的过程具有重要意义。以横山县为例,采集了254个耕层(0~20 cm)土样,利用数字地形与遥感影像分析技术,提取相关地形与遥感指数,分析不同土地利用、地形条件下土壤养分空间变异及分布特征,并结合回归分析与地统计学进行空间分布预测。结果表明,不同土地利用类型其养分含量差异显著,水田和川地的有机质和全氮含量明显高于其他土地利用类型,而全磷含量以梯田最高。不同坡度分析表明,"0~3°"坡度等级有机质和全氮含量显著高于其他坡度等级;不同坡向土壤养分含量差异均不显著,但存在一个明显的趋势,即阴坡有机质和全氮含量整体上要较阳坡高。土壤有机质...

[ Lian G, Guo X D, Fu B J, et al.Spatial variability and prediction of soil nutrients on acounty scale on the loess plateau: A case study of Hengshan County, Shanxi Province[J]. Acta Pedologica Sinica, 2008,45(4):577-584. ]

[2]
孔庆波,章明清,姚宝全,等.福建县级区域耕地土壤养分时空变异研究[J].热带作物学报,2010,31(10):1686-1691.运用地理信息系统和地统计学相结合的方法,研究福建沿海县级区域耕地土壤主要养分指标――有机质、碱解氮、速效磷、速效钾的空间变异规律,并按照肥力指标法对耕层土壤进行养分分级。结果表明,空间上,从县级区域耕层土壤分析,不同地块土壤养分含量变化差异大;空间变异结构也存在较大差异,晋江速效养分表现为结构性因素影响,而闽侯表现为结构性因素和随机性因素共同作用;建立了土壤养分空间分布图,分析其空间分布规律;按照肥力等级划分,该区域耕地氮素表现为部分区域缺乏,钾素大部分区域严重亏缺,磷素大部分区域盈余;时间上,以土壤速效磷为例,与20世纪80年代第2次土壤普查资料对照,其含量有所增长,从农田养分平衡角度也证实了该区域大部分耕地土壤累积磷素。

[ Kong Q B, Zhang M Q, Yao B Q, et al.Temporal and spatial variability of soil nutrients in the county scale of Fujian[J]. Chinese Journal of Tropical Crops, 2010,31(10):1686-1691. ]

[3]
lam K R, Weil R R. Land use effects on soil quality in a tropical forest ecosystem of Ban gladesh[J]. Agriculture Ecosystems & Environment, 2000,79:9-16.

[4]
Fu W, Tunney H, Zhang C.Spatial variation of soil nutrients in a dairy farm and its implications for site-specific fertilizer application[J]. Soil & Tillage Research, 2010,106(2):185-193.

[5]
Campbell J B.Spatial variation of sand content and pH within single contiguous delineations of two soil mapping units[J]. Soil Science Society of America Journal, 1978,42(3):460-464.ABSTRACT Quantitative estimates were made of the rates of spatial variation of soil properties within each of two sampled areas displaying contrasting patterns of variation. Samples were collected at 10-m intervals on two sampling grids, each 8 by 20, positioned on contiguous delineations of the Ladysmith and Pawnee series in eastern Kansas. The Pawnee is developed from glacial till, the Ladysmith from fine-textured sediments. Spatial variation of sand and pH measurements within both of the sampled areas was studied using the semivariance, a statistical function tailored for the analysis of continuous geographic variables.

DOI

[6]
Webster R, Nortcliff S.Improved estimation of micro nutrients in hectare plots of the Sonning Series[J]. Journal of Soil Science, 1984,35(4):667-672.

[7]
Mallarino A P.Spatial variability patterns of phosphorus and potassium in no-tilled soils for two sampling scales[J]. Soil Science Society of America Journal, 1996,60(5):1473-1481.The increasing use of grid soil sampling methods and variable-rate fertilization requires better understanding of patterns and causes of lateral variability of nutrients. This study assessed patterns of spatial variability of P and K for two scales of sampling on eight no-tilled corn (Zea mays L.) and soybean [Glycine max (L.) Merr.] fields. The fields had received no P or K fertilization since the last harvest but had varied histories of fertilization. Fifty 10-core (0- to 15.2-cm depth) composite samples were collected from 2.2-m

DOI

[8]
White J G, Welch R M, Norvell W A.Soil zinc map of the USA using geostatistics and geographic information systems[J]. Soil Science Society of America Journal, 1997,61(1):185-194.Abstract The geographic distribution of soil Zn is important to agriculture, nutrition, and health. A map illustrating the total Zn content of soils of the conterminous USA was developed using geostatistics and geographic information systems. Data were combined from a U.S. Geological Survey study targeting nonagricultural soils in 47 states, and a U.S. Deportment of Agriculture-U.S. Environmental Protection Agency-U.S. Food and Drug Administration study targeting agricultural soils in 33 states. Semivariograms indicated spatial correlation at distances up to 470 km. A significant quadratic trend was modeled, but detrending had little effect on the semivariogram or on interpolation via kriging. The data exhibited some anisotropy, but it had little effect on kriging. An exponential semivariogram model was fit using least squares and used to krige a grid covering the conterminous USA. The resultant map depicted soils north of about 37 N latitude or west of about 109 W longitude as generally having more Zn than the average of 55 mg kg-1. Soils southeast of this boundary tended to contain less Zn than average, with exceptions of soils developed on Mississippi alluvium and in Piedmont valleys and ridges. High estimate standard deviations occurred where data were sparse. The map will be useful in future research to determine the geographic distribution of plant-available soil Zn, regional patterns of plant, animal, and human Zn deficiencies, the relationship of Zn to soil parent material, genesis, and surficial geology, and in considering the consequences of land disposal of Zn-laden wastes.

DOI

[9]
López-Granados F, Jurado-Expósito M, Atenciano S, et al.Spatial variability of agricultural soil parameters in southern Spain[J]. Plant and Soil, 2002,246(1):97-105.<a name="Abs1"></a>Spatial patterns for seven soil chemical properties and textures were examined in two fields in southern Spain (Monclova and Caracol, province of Seville, Andalusia) in order to identify their spatial distribution for the implementation of a site-specific fertilization practice. Two sampling grids of 35&times;20 and 35&times;35 m were established in Caracol and Monclova, respectively. Fourteen and eight georeferenced soil samples per hectare were collected at two depths (0&#x2013;0.1 and 0.25&#x2013;0.35 m) in early November 1998 before fertilizing and planting the winter crop. Data were analyzed both statistically and geostatistically on the basis of the semivariogram. The spatial distribution model and spatial dependence level varied both between and within locations. Some of the soil properties showed lack of spatial dependence at both depths and at the chosen interval (lag h). Such was the case for clay, organic matter and NH<sub>4</sub> at Monclova; and clay and NH<sub>4</sub> at Caracol. Bray P and exchangeable K showed a strong patchy distribution at any field and depth. It is important to know the spatial dependence of soil parameters, as management parameters with strong spatial dependence (patchy distribution) will be more readily managed and an accurate site-specific fertilization scheme for precision farming more easily developed.

DOI

[10]
Iqbal J, Thomasson J A, Jenkins J N, et al.Spatial variability analysis of soil physical properties of alluvial soils[J]. Soil Science Society of America Journal, 2005,69(4):1338-1350.Analysis and interpretation of spatial variability of soils is a key-stone in site-specific farming. Soil survey maps may have up to 0.41-ha inclusions of dissimilar soils within a mapping unit. The objectives of this study were to determine the degree of spatial variability of soil physical properties and variance structure, and to model the sampling interval of alluvial floodplain soils. Soil profiles (n = 209) from 18 parallel transects were sampled with a mean separation distance of 79.4 m. Each profile was classified into surface, subsurface, and deep horizons. Structural analysis of soil bulk density (

DOI

[11]
Kumhálová J, Kumhála F, Kroulík M, et al.The impact of topography on soil properties and yield and the effects of weather conditions[J]. Precision Agriculture, 2011,12(6): 813-830.Quantitative knowledge of the factors and interactions affecting yield is essential for site-specific crop management. One of the factors that frequently affects yield is topography. The aims of this study were to compare elevation data obtained from a combine harvester yield monitor and a hand RTK-GPS, and to evaluate the relationships between the spatial variation of cereal yield, selected crop nutrient concentration and topographic attributes derived from the two sources of elevation data. Simple models of elevation, slope and flow accumulation were created from the data of an experimental field in the Czech Republic, and the relations between yield and soil nitrogen and organic carbon contents and topography were determined over a four-year period. The models of elevation, slope and flow accumulation were compared with the yield, and soil nitrogen and organic carbon contents during the growing seasons of 2004, 2005, 2006 and 2007 in relation to total precipitation and temperature. The relationship between yield and topographic attributes was evaluated with the help of geostatistical methods. The results of correlation analysis among the variables were evaluated statistically by forward stepwise linear regression. No significant differences between elevation data from the combine harvester yield monitor and RTK-GPS were found. There was a significant relation between yield and crop nutrient concentration with topography. The correlation coefficients between flow accumulation and yield were weak for the wetter years and strong for the drier years.

DOI

[12]
王淑英,路苹,王建立,等.不同研究尺度下土壤有机质和全氮的空间变异特征——以北京市平谷区为例[J].生态学报,2008,28(10):4957-4964.在北京郊区面积为1075km2的中尺度(平谷区)以400m×400m网格采样,共采集1076个样点,同时在平谷区内面积为28.8km2的小尺度(马昌营镇)以100m×100m网格采样,共采集171个样点,测定其耕层土壤有机质和全氮的含量。应用传统统计学和地统计学方法,对两个研究尺度下的数据进行了分析,结果表明:有机质和全氮的变异系数范围为0.31~0.40,均属中等变异强度,随着研究尺度的缩小,土壤全氮的变异系数减少。半方差函数分析结果表明,两个研究尺度下,有机质和全氮均在一定范围内存在空间相关关系,区级尺度有机质和全氮的空间相关距离较大,分别为88.2 km和4.9 km,镇级尺度有机质和全氮的变程较小,均为0.7 km,它们的空间异质性均主要由结构性因素引起。采用Kriging最优内插法对未测点进行了估值,绘制了等值线图,两个研究尺度下的有机质和全氮含量受地形、土壤类型、土地利用方式、施肥等因素的影响,均表现出明显不同的分布规律。

[ Wang S Y, Lu P, Wang J L, et al.Spatial variability and distribution of soil organic matter and total nitrogen at different scales: A case study in Pinggu County, Beijing[J]. Acta Ecologica Sinica, 2008,28(10):4957-4964. ]

[13]
赵明松,张甘霖,李德成,等.苏中平原南部土壤有机质空间变异特征研究[J].地理科学,2013,33(1):83-89.<p>在江苏省中部平原南部选取一个30 km&times;45 km方形区域为研究区,按照套合采样方法,采集178 个耕作层土样,分析土壤有机质含量和机械组成,运用地统计学和GIS 技术研究苏中平原区表层土壤有机质含量空间变异特征,利用相关分析和方差分析探讨区域内土壤有机质含量空间变异的影响因素.统计结果表明,研究区土壤有机质含量为28.51&plusmn;7.80 g/kg,变异系数为27.31%,属中等变异强度;地统计分析表明,研究区土壤有机质含量存在强烈的空间自相关性,结构变异占主导作用,各向异性显著,在39&deg;和219&deg;方向上变异程度最剧烈,土壤有机质含量自东北向西南呈递减趋势.研究区土壤有机质含量空间变异主要受土壤质地、成土母质、地形等因素影响,其中土壤质地是空间变异的主要影响因素.</p>

[ Zhao M S, Zhang G L, Li D C, et al.Spatial variability of soil organic matter and factor analysis in the south of middle Jiangsu plain[J]. Scientia Geographica Sinica, 2013,33(1):83-89. ]

[14]
Steffens M, Kölbl A, Totsche K U, et al.Grazing effects on soil chemical and physical properties in a semiarid steppe of Inner Mongolia (P. R. China)[J]. Geoderma, 2008,143(1-2):63-72.ABSTRACT It is not clear from the literature whether heavy grazing leads to a deterioration of physical and chemical parameters of topsoils in steppe ecosystems. We sampled five sites in northern China with different grazing intensities, ranging from ungrazed since 1979 to heavily grazed, at 540 sampling points to a depth of 0 4 cm. Each sample was analysed for bulk density, organic carbon (OC), total nitrogen (N), total sulphur (S) and pH. The dataset was analysed using general statistics and explorative analysis (ANOVA, Kruskal 揥allis). As a result of the large number of samples, we were able to detect a change in the mean value of all parameters of less than 10%, with a statistical power of 90% and a level of significance of 0.01. Bulk density increased significantly with increasing grazing intensity. Organic carbon, total N and total S concentrations decreased significantly with increasing grazing intensity. No effect on the pH or C/N ratio was detected. Significant differences in C/S and N/S ratios between differently grazed plots were found. These differences point towards a relative accumulation of sulphur in grazed compared to ungrazed areas following an increased organic matter decline or lower inputs of diluting litter. Elemental stocks of the upper 4 cm were calculated for OC, total N and total S using the measured bulk densities. The data revealed significantly lower amounts for all three elements on the heavily grazed site, but no significant differences for the other areas. In addition, elemental stocks were calculated using an equivalent mass instead of bulk density to take into account changes in bulk density following grazing. This revealed a highly significant decrease for OC, total N and total S with increasing grazing intensity. OC, total N and total S concentrations respond similarly to different grazing intensities, showing highly significant positive correlations. OC concentrations and bulk densities were significantly negatively correlated. We found effects of grazing cessation only in the long-term, as no ameliorating effects of reduced or excluded grazing could be detected five years after grazing cessation. After 25 years of exclusion, significantly different values were found for all parameters. Thus, physical and chemical parameters of steppe topsoils deteriorated significantly following heavy grazing, remained stable if grazing was reduced or excluded for five years, and recovered significantly after 25 years of grazing exclusion.

DOI

[15]
吴昊. 秦岭山地松栎混交林土壤养分空间变异及其与地形因子的关系[J].自然资源学报,2015,30(5):858-869.?在陕西省境内秦岭山脉中段油松-锐齿槲栎混交林集中分布的区域设置20块调查样地,采取土壤样品测定了该区森林土壤0~20、20~40和40~60cm3个土层的全氮、全磷、全钾、速效氮、速效磷、速效钾、有机质7项养分指标。通过计算不同土壤养分指标的变异系数并应用典范对应分析(CCA)技术,对秦岭山地松栎混交林土壤养分空间变异与海拔、坡位、坡向和坡度4项地形因子的关系进行分析。结果表明:①单因素方差分析显示,随着土层深度增加,全氮、有机质、速效氮、速效磷和速效钾含量均呈极显著下降趋势,而全磷、全钾在不同土层中的含量无显著性差异;②变异系数计算结果表明,各土层的7项养分指标均表现为中等程度变异性,变异系数最大者是0~20cm土层速效氮,最小者为0~20cm土层全钾;③从CCA排序结果看,地形因子对不同土层养分变异的影响程度及因子种类明显不同。0~20cm表层土壤养分变异受地形因子制约作用较小,20~40cm土层养分的主要影响因子为坡向和海拔,40~60cm土层养分的主要影响因子为海拔和坡位,而坡度和海拔则是控制0~60cm整体土壤层养分变异的主要因素。综上所述,地形高异质性的微生境造成了秦岭山地松栎混交林土壤养分空间分布格局的差异。

DOI

[ Wu H.The relationship between terrain factors and spatial variability of soil nutrients for Pine-Oak mixed forest in Qinling Mountains[J]. Journal of Natural Resources, 2015,30(5):858-869. ]

[16]
范夫静,宋同清,黄国勤,等.西南峡谷型喀斯特坡地土壤养分的空间变异特征[J].应用生态学报,2014,25(1):92-98.<div style="line-height: 150%">基于网格(20 m&times;20 m)取样,采用经典统计学和地统计学方法,研究了西南峡谷型喀斯特坡地土壤养分的空间异质性和分布格局.结果表明: 峡谷型喀斯特坡地土壤养分含量为中等和强变异,变异性大小顺序为:速效磷&gt;全钾&gt;有机质&gt;碱解氮&gt;全氮&gt;全磷&gt;速效钾, pH值表现为弱变异,有机质表现为中等程度的变异;不同土壤养分具有良好的空间自相关性,其自相关函数均表现出由正相关向负相关方向发展,拐点为80~100 m,其中全钾和速效磷的Moran <em>I</em>较小,其他指标较大;不同土壤养分的空间变异特征不同,全钾和速效磷最佳拟合模型为指数模型,块金值与基台值的比值[<em>C</em><sub>0</sub>/(<em>C</em><sub>0</sub>+<em>C</em>)]和变程(<em>A</em>)很小,分形维数(<em>D</em>)较高,空间相关性强烈;其他土壤养分指标的最佳拟合模型均为球状模型,<em>C</em><sub>0</sub>/(<em>C</em><sub>0</sub>+<em>C</em>)、<em>A</em>和<em>D</em>均呈中等程度的空间相关;Kriging分析表明,pH值、有机质、全氮、全磷和碱解氮呈凹型分布,速效磷和速效钾呈斑块状分布.植被、地形、人为干扰和高异质性的微生境是造成峡谷型喀斯特坡地土壤养分格局差异的主要因素.</div><div style="line-height: 150%"></br> &nbsp;</div>

[ Fan F J, Song T Q, Huang G Q, et al.Characteristics of spatial variation of soil nutrients in sloping field in a gorge karst region southwest China[J]. Chinese Journal of Applied Ecology, 2014,25(1):92-98. ]

[17]
王雪梅,柴仲平,武红旗.典型干旱荒莫绿洲区耕层土壤养分空间变异[J].水土保持通报,2016,36(1):51-56.[目的]对干旱荒漠绿洲区耕层土壤养分空间特征进行研究,为绿洲土地资源的合理开发利用,以及土壤施肥方案的科学制定提供理论依据。[方法]基于GIS与地统计学方法对新疆维吾尔自治区精河县耕层土壤养分空间变异特征及影响因素进行分析。[结果](1)研究区内有效磷的空间变异性较强(变异系数Cv为67.45%),速效钾的空间变异性最弱(Cv为40.76%)。(2)有机质、碱解氮和有效磷存在较强的空间自相关性,其空间变异主要由地形、土壤质地和土壤类型等结构性因素所引起;速效钾为中等程度的空间自相关性,其空间变异不仅受结构性因素的影响,还与随机因素(即施肥和种植结构)有关。(3)各土壤养分元素在绿洲内部具有较高含量的片状和斑块状分布,而在绿洲外缘,其含量相对较低,且呈大面积的片状分布。[结论]精河县耕层土壤养分总体呈现出有机肥含量缺乏,磷钾肥相对丰富的特点。

DOI

[ Wang X M, Chai Z P, Wu H Q.Spatial variation of arable layer soil nutrients in typical desert oasis area[J]. Bulletion of Soil and Water Conservation, 2016,36(1):51-56. ]

[18]
赵倩倩,赵庚星,姜怀龙,等.县域土壤养分空间变异特征及合理采样数研究[J].自然资源学报,2012,27(8):1382-1391.以地统计学和GIS相结合,以山东费县为例探讨了土壤有机质、全氮、碱解氮、有效磷和速效钾5种养分空间变异特征及县域尺度土壤养分的合理采样数。研究表明,有效磷的变异系数最大,由大到小依次为有效磷>速效钾>有机质>碱解氮>全氮。有机质、全氮、速效钾3种养分呈现中等强度的空间相关性且变程较大,基于土壤养分的空间相关性和克里格插值的独立验证得出费县有机质、全氮和速效钾3种养分合理采样数分别为1 035、842和1 033个,合理采样间距约为1 352、1 500和1 354 m。碱解氮不存在空间相关性,后续采样需要加大采样密度进一步研究其空间结构性。而有效磷呈现很强的空间相关性,但是变程很小,小范围内受人类活动等随机性因素较大,后续采样不能低于目前采样密度。

DOI

[ Zhao Q Q, Zhao G X, Jiang H L, et al.Study on spatial variability of soil nutrients and reasonable sampling number at county scale[J]. Journal of Natural Resources, 2012,27(8):1382-1391. ]

[19]
贾振宇,张俊华,丁圣彦,等.基于GIS和地统计学的黄泛区土壤磷空间变异——以周口为例[J].应用生态学报,2016(4):1211-1220.土壤中的磷是衡量土壤肥力的重要指标,其含量的高低对土壤理化性质、植物生长以及微生物的活动等都有重要影响.本文以周口黄泛区土壤为例,通过土样采集和室内试验分析,运用地统计分析及GIS空间模拟等方法,分析土壤全磷和速效磷的空间分布特征.结果表明:研究区土壤全磷和速效磷含量比较高,且表层(0~20 cm)含量均高于第二层含量(20~40 cm).两层土壤全磷和速效磷均属于中等程度变异,并且速效磷的变异程度高于全磷;两层土壤全磷为中等程度的各向异性,最适模型为高斯模型,表层具有较强的空间相关性,第二层则具有中等的空间相关性.两层土壤速效磷的各向异性均较弱,最适模型为线性模型,两层均呈现较弱的空间相关性.两层全磷含量从西南到东北方向呈现缓慢上升的变异趋势,而从西北到东南方向呈逐渐下降的变异趋势.表层速效磷含量在西南到东北方向先升后降,在东南到西北方向呈先降后升的变异趋势;第二层速效磷含量在西南到东北方向上呈现先降后升的趋势,而在西北到东南方向则呈上升趋势.表层土壤全磷含量较高,第二层含量属于中等水平;表层速效磷含量较高,而第二层含量较低.土地利用方式、耕作制度和施肥等人为因素是影响该区土壤磷分布趋势和空间变异的主要因素.

DOI

[ Jia Z Y, Zhang J H, Ding S Y, et al.Spatial variation of soil phosphorus in flooded area of the Yellow River based on GIS and geo-statistical methods: A case study in Zhoukou City, Henan, China[J]. Chinese Journal of Applied Ecology, 2016,4:1211-1220. ]

[20]
张国平,郭澎涛,王正银,等.紫色土丘陵地区农田土壤养分空间分布预测[J].农业工程学报,2013,29(6):113-120.为深入研究紫色土丘陵区农田土壤养分空间分布规律,在GIS技术的支持下,利用研究区450个土壤实测数据,结合地形因子和土地利用类型,运用多重线性回归构建了土壤养分预测模型,对养分的空间分布进行预测。结果表明,土壤有机质和碱解氮含量与地形因子之间的相关性较强,有效磷和速效钾含量与地形因子之间的相关性较弱。土壤水田和旱地中有机质、碱解氮和有效磷含量均值间的差异显著(P<0.01),速效钾之间不显著(P=0.34)。基于地形因子的土壤养分预测模型与基于地形因子和土地利用方式组合的土壤养分预测模型预测结果精度对比表明,在预测变量中增加土地利用类型对提高预测模型的拟合度和预测精度作用非常微小,且仅用地形因子预测土壤养分的空间分布更方便,因此选用该模型对验证集数据进行预测。以验证集数据进行预测结果与实测值进行比较,结果显示预测值与实测值之间的差异甚小,有机质、碱解氮、有效磷和速效钾的相对偏差分别为0.09、0.19、0.08和0.12,均方根误差分别为1.38、3.42、1.03和1.57,说明基于地形因子的土壤养分预测模型的精度较高,可以很好地预测土壤养分分布规律。该研究结果可为丘陵地区农田合理施肥提供理论依据。

[ Zhang G P, Guo P T, Wang Z Y, et al.Prediction of spatial distribution of hilly farmland with purple soil nutrient[J]. Transactions of the Chinese Society of Agricultural Engineering, 2013,29(6):113-120. ]

[21]
邓欧平,周稀,黄萍萍,等.川中紫色丘区土壤养分空间分异与地形因子相关性研究[J].资源科学,2013,35(12):2434-2443.研究地形因子与土壤养分空间分异的相关关系对于养分管理和精准农业都具有一定指导意义。应用GIS技术结合地统计方法,研究川中紫色丘陵区土壤养分空间分异性,探讨坡位、坡度、坡向和坡形4个地形因子及其不同组合与土壤养分空间分布的相关性。结果表明:①研究区土壤养分均呈现中等变异;②土壤养分因子与高程、坡度、坡形呈负相关;与坡向、平面曲率和剖面曲率呈正相关;③4个地形因子中,坡位、坡度及坡向对土壤养分分布具有强烈影响。坡位-坡度组合下,土壤养分分异与在坡位和坡度单个因子作用下趋于一致,但差异不显著。坡位-坡向组合下,土壤养分分异主要与坡向相关。坡度-坡向组合下,土壤碱解氮和有机质随坡向变异明显,而速效磷和速效钾则随坡度变异明显;④Kriging插值显示,有机质在中部丘顶部位含量最低,随坡位下降含量呈环状升高;碱解氮主要分布于区域西北部;速效磷在空间分布上沿西北-东南方向呈现一条高含量带;而速效钾则主要分布于区域西南部,以中部三处丘顶含量最低,呈环状逐步向外增高。

[ Deng O P, Zhou X, Huang P P, et al.Correlations between spatial variability of soil nutrients and topographic factors in the purple hilly region of Sichuan[J]. Resources Science, 2013,35(12):2434-2443. ]

[22]
黄东风,邱孝煊,李卫华,等.福州市郊蔬菜施肥现状及菜地土壤养分累积特征分析[J].福建农林大学学报:自然科学版,2009,38(6):633-638.采用农户问卷调查、田间取样及实验室化验分析方法,分析了福州市郊11片蔬菜基地的蔬菜施肥现状及菜地土壤养分累积特征,结果表明:(1)蔬菜生产上以施用化肥为主,有机肥为辅,化肥以俄罗斯进口复合肥最为普遍;每茬不同类型蔬菜的平均施肥水平(N、P2O5和K2O总养分)在493.6-1212.2 kg.hm-2之间,氮磷钾比例(平均1∶0.77∶0.75)不协调,磷肥施用量明显偏高;各轮作类型蔬菜平均施肥量(N、P2O5和K2O总养分)在2002.3-3455.2 kg.hm-2.a-1之间.(2)与林坡地自然土壤相比,菜地土壤的全磷(2.04 g.kg-1)、速效磷(182.9 mg.kg-1)、CaCl2-P(1.02 mg.kg-1)平均含量呈现明显累积,分别提高3.16、6.87和12.3倍;有机质(37.4 g.kg-1)和全氮(2.18 g.kg-1)平均含量分别提高33.43%和17.16%;全钾含量变化不明显;而碱解氮(200 mg.kg-1)、速效钾(243.8 mg.kg-1)、CEC(14.7 cmol.kg-1)和pH值(5.97)分别降低了15.01%、38.2%、3.14%和9.7%.

[ Huang D F, Qiu X X, Li W H, et al.Fertilization status quo and nutrient accumulation of vegetable field soil in the suburb of Fuzhou City[J]. Journal of Fujian Agriculture and Forestry University (Natural Science Edition), 2009,38(6):633-638. ]

[23]
魏为兴. 福州市主要蔬菜基地土壤重金属的影响评价[J].福建地质,2007,26(2):100-107.采集了福州市不同区、县(市)主要蔬菜基地的土壤样品与蔬菜样品,分析其中Pb、Cr、Cd、As、Hg等重金属含量特征,应用数理统计方法研究和比较了各种蔬菜的重金属富集能力。研究结果表明,福州城郊区蔬菜基地的土壤与蔬菜中重金属含量高于其他区域。叶菜类蔬菜中的重金属含量相对高于其他种类的蔬菜,蔬菜对重金属的富集能力为叶菜类花菜类根菜类瓜果类茎菜类;不同重金属元素富集顺序为CdHgCrAsPb。

DOI

[ Wei W X.On the influence of heavy metals in the soil of major vegetable bases in Fuzhou City[J]. Geology of Fujian, 2007,26(2):100-107. ]

[24]
陈文惠. 福州土地利用变化及其驱动力多元综合分析[J].地球信息科学学报,2012,7(3):45-50.

[ Chen W H.A study on the change of land use based Geo-inofrmation technology in Fuzhou City[J]. Geo-information Science, 2012,7(3):45-50. ]

[25]
Nielsen D R, Bouma J.Soil Spatial Variability[M]. Pudoc Wageningen, 1985:2-30.

[26]
张金池,李海东,林杰,等.基于小流域尺度的土壤可蚀性K值空间变异[J].生态学报,2008,28(5):2199-2206.采用传统统计学和地统计学相结合的方法,以邓下小流域为研究区,利用EPIC模型中土壤可蚀性K值算法,研究了小流域尺度下土壤可蚀性K值空间变异特征及不同植被类型对其影响。结果表明:(1)研究区K值的变化范围为0.1498&nbsp;~04981,均值为0.3316,变异系数为22.11%,小流域土壤可蚀性存在中等程度的空间变异性。(2)&nbsp;研究区土壤可蚀性K值总体分布趋势是从西北向东南增大,条带状分布明显,K值较高处以“岛状”嵌于小流域中南部。北部森林覆盖区土壤抗侵蚀能力较强,中南部耕作种植及居住生活区土壤抵抗侵蚀能力较弱。(3)研究区8种不同植被类型除旱耕地外,K值垂直变异特征均是K0~20cm<K20~40cm<K40~60cm,土壤可蚀性随土壤垂直剖面深度增大而增大,土壤表层(0~20cm)抗侵蚀性能力最强。8种不同植被类型土壤表层K值(K0~20cm)的大小顺序为:休闲地&nbsp;&gt;茶园&nbsp;&gt;旱耕地&nbsp;&gt;草地&nbsp;&gt;阔叶林&nbsp;&gt;灌木林&nbsp;&gt;针叶林&nbsp;&gt;毛竹林。

[ Zhang J C, Li H D, Lin J, et al.Spatial variability of soil erodibility (K-Factor) at a catchment scale in China[J]. Acta Ecologica Sinica, 2008,28(5):2199-2206. ]

[27]
王政权. 地统计学及在生态学中的应用[M].北京:科学出版社,1999.

[ Wang Z Q.Statistics and its application in ecology[M]. Beijing: Science Press, 1999. ]

[28]
Wang Y D, Feng N N, Li T X, et al.Spatial variability of soil cation exchange capacity in hilly tea plantation soils under different sampling scales[J]. Agricultural Sciences in China, 2008,7(1):96-103.Studies on the spatial variability of the soil cation exchange capacity (CEC) were made to provide a theoretical basis for an ecological tea plantation and management of soil fertilizer in the tea plantation. Geostatistics were used to analyze the spatial variability of soil CEC in the tea plantation site on Mengding Mountain in Sichuan Province of China on two sampling scales. It was found that, (1) on the small scale, the soil CEC was intensively spatially correlative, the rate of nugget to sill was 18.84% and the spatially dependent range was 1 818 m, and structural factors were the main factors that affected the spatial variability of the soil CEC; (2) on the microscale, the soil CEC was also consumingly spatially dependent,and the rate of nugget to sill was 16.52%, the spatially dependent range was 311 m, and the main factors affecting the spatial variability were just the same as mentioned earlier. On the small scale, soil CEC had a stronger anisotropic structure on the slope aspect, and a weaker one on the lateral side. According to the ordinary Kriging method, the equivalence of soil CEC distributed along the lateral aspect of the slope from northeast to outhwest, and the soil CEC reduced as the elevation went down. On the microscale, the anisotropic structure was different from that measured on the small scale. It had a stronger anisotropic structure on the aspect that was near the aspect of the slope, and a weaker one near the lateral aspect of the slope. The soil CEC distributed along the lateral aspect of the slope and some distributed in the form of plots.From the top to the bottom of the slope, the soil CEC increased initially, and then reduced, and finally increased.

DOI

[29]
韩美荣,宋同清,彭晚霞,等.喀斯特峰丛洼地土壤矿物质的组成特征与作用[J].应用生态学报,2012,23(3):685-693.基于喀斯特峰丛洼地农作区、人工林、次生林、原生林4类典型生态系统动态监测样地(200 m&times;40 m)土壤矿质养分因子(7个)、植被(9个)、地形(4个)、土壤理化性状(10个)共计30个指标的全面调查取样分析,采用经典统计分析、主成分分析和典范相关分析探讨了土壤矿物质的组成特征、作用以及与植被、地形、其他土壤性状的耦合关系.结果表明: 喀斯特峰丛洼地土壤矿物质组成以SiO2、Al2O3、K2O、Fe2O3为主,明显低于全球土壤平均背景值和同区域地带性红壤,CaO、MgO含量居中,MnO含量很低;不同生态系统土壤矿物质组成和变异不同,土壤的发育程度也不同,植被和土壤的原生性呈同比正相关,均有潜在的石漠化风险;4类生态系统景观异质性高,主成分分析的降维效果不好,土壤矿物质均为各生态系统的主要影响因子,且与植被、地形、其他土壤性状的关系非常密切,特别是SiO2、CaO和MnO,其中对植被的影响主要是物种多样性,对土壤则为有机质、全氮、全钾等主要养分.土壤矿物质是影响喀斯特峰丛洼地土壤肥力和植物生长发育的限制因子之一,有效利用矿物质资源、合理施用矿质养分对喀斯特退化生态系统的恢复与重建作用重大.

[ Han M R, Song T Q, Peng W X, et al.Compositional characteristics and roles of soil mineral substances in depressions between hills in karst region[J]. Chinese Journal of Applied Ecology, 2012,23(3):685-693. ]

[30]
施春健,庄秋丽,李琪,等.东北地区不同纬度农田土壤碱解氮的剖面分布[J].生态学杂志,2007(4):501-504.为研究农田土壤碱解氮的含量及其分布,以东北玉米带不同纬度农田 土壤为对象,研究了100 cm深度范围内碱解氮含量垂直分布及纬向分异特征.结果表明: 土壤碱解氮主要分布在0~60 cm土层中,各样点碱解氮含量随土壤深度的增加而减少;除公主岭点外,其它各点0~60 cm的3个土层间碱解氮含量差异显著(P<0.05);碱解氮含量与有机碳、全氮含量极显著正相关(P<0.01),说明土壤碱解氮含量及其分布主要受土 壤有机质和氮素水平的影响.0~20 cm土层碱解氮含量具有随纬度增加而增加的趋势,气候条件和土壤类型的差异是导致其纬向分布差异的主要原因.

[ Shi C J, Zhuang Q L, L Q, et al. Profile distribution of alkali-hydrolyzed nitrogen in farm land soils of Northeast China along a latitudinal gradient[J]. Chinese Journal of Ecology, 2007,4:501-504. ]

[31]
Sumfleth K, Duttmann R.Prediction of soil propertydistribution in paddy soil landscapes using terrain data and satellite information as indicators[J]. Ecological Indicators, 2008,8(5):485-501.<h2 class="secHeading" id="section_abstract">Abstract</h2><p id="">Sustainable land management and land use planning require reliable information about the spatial distribution of the physical and chemical soil properties affecting both landscape processes and services. Although many studies have been conducted to identify the spatial patterns of soil property distribution on various scales and in various landscapes, only little is known about the relationships underlying the spatial distribution of soil properties in intensively used, finely structured paddy soil landscapes in the southeastern part of China. In order to provide adequate soil information for the modelling of landscape processes, such as soil water movement, nutrient leaching, soil erosion and plant growth, this study investigates to what extent cheap and readily available ancillary information derived from digital elevation models and remote sensing data can be used to support soil mapping and to indicate soil characteristics on the landscape scale. This article focuses on the spatial prediction of the total carbon and nitrogen content and of physical soil properties such as topsoil silt, sand and clay content, topsoil depth and plough pan thickness. Correlation analyses indicate that, on the one side, the distribution of C, N and silt contents is quite closely related to the NDVI of vegetated surfaces and that, on the other side, it corresponds significantly to terrain attributes such as relative elevation, elevation above nearest drainage channel and topographical wetness index. Geostatistical analyses furthermore reflect a moderately structured spatial correlation of these soil variables. The combined use of the above mentioned terrain variables and the NDVI in a multiple linear regression accounted for 29% (silt) to 41% (total C) of the variance of these soil properties. In order to select the best prediction method to accurately map soil property distribution, we compared the performance of different regionalization techniques, such as multi-linear regression, simple kriging, inverse distance to a power, ordinary kriging and regression kriging. Except for the prediction of topsoil clay content, in all cases regression kriging model &ldquo;C&rdquo; performed best. Compared to simple kriging, the spatial prediction was improved by up to 14% (total C), 13% (total N) and 10% (silt). Since the autocorrelation lengths of these spatially well correlated soil variables range between three and five times the soil sampling density, we consider regression kriging model &ldquo;C&rdquo; to be a suitable method for reducing the soil sampling density. It should help to save time and costs when doing soil mapping on the landscape scale, even in intensively used paddy soil landscapes.</p>

DOI

[32]
崔晓阳. 红松、白桦的氮营养行为及其种间分异[J].应用生态学报,1998(2):123-127.对红松、白桦的吸收空间和吸收 N素的时间 (季节 )、数量、形态的研究表明 ,在混交情况下 ,白桦表现出较典型的浅根性特征 ,吸收根主要集中在土壤表层 ;红松则具有深根性趋势 ,其吸收根在下层土壤空间的分布明显增加 .白桦吸收N素养分的季节比较集中 ,具有明显的峰期 ;而受白桦庇荫的红松则在整个生长季中一直比较平缓地吸收N素 ,峰期不甚明显 .白桦对N的消耗量较大 ;而红松对N的消耗量则相对较小 ,N利用效率比白桦高 34% .在对N素养分化学形态的偏向选择性方面 ,白桦较喜NO-3 N ,而红松则较偏好NH+4 N .

[ Cui X Y.Behaviors of nitrogen nutrition of Pinus koraiensis and Betula platyphylla and their interspecific differentiation[J]. Chinese Journal of Applied Ecology, 1998,2:123-127. ]

[33]
甘海华,彭凌云.江门市新会区耕地土壤养分空间变异特征[J].应用生态学报,2005,8(8):1437-1442.运用地统计学方法,结合GIS技术研究了江门市新会区土壤pH 值、有机质、阳离子交换量、全氮、有效磷和缓效钾6种养分要素的空间分布特征.结果表明,各变量符合正态分布或经对数转换后符合正态分布.半方差函数分析 结果显示,除全氮具有强空间相关外,其余均具有中等空间相关性.Kriging插值结果表明,研究区域耕地土壤pH值和阳离子交换量在东北部最高,有机质 含量在中部和东北部较高;全氮含量在1.5~2.0g·kg-1的面积占研究区域耕地面积的74.7%,主要分布于研究区域西部和东部地区;有效磷含 量>40mg·kg-1的面积占研究区域耕地面积的48.7%,主要分布于研究区域东北部和西部;缓效钾含量在160~350mg·kg-1的面积占研究 区域耕地面积的48.1%,主要分布于研究区域东部、东北部和中部.

[ Gan H H, Peng L Y.Spatial variability of nutrients in cultivated soils of Xinhui District, Jiangmen City[J]. Chinese Journal of Applied Ecology, 2005,8(8):1437-1442. ]

[34]
秦松,樊燕,刘洪斌,等.地形因子与土壤养分空间分布的相关性研究[J].水土保持研究,2008(1):46-49,52.运用地统计学和GIS技术,研究丘陵地区土壤养分的空间变异性,探讨地形因子对土壤养分含量空间分布的影响。结果表明:N,K的空间变异主要来自随机因素,而Mg及其他养分的空间变异性在一定程度上受地形等结构性因素的影响。OM,N,P,K几种大量元素与海拔呈显著正相关,Ca,Mg,S与海拔呈负相关;N与坡度呈显著正相关,Ca与坡度呈显著负相关;OM,N,P与坡向呈负相关,Ca,Mg与坡向呈显著正相关关系;而K,S与地形因子的相关性不显著。研究地形地貌与土壤养分之间的空间关系,为进一步合理进行土地利用规划提供理论依据,并且对土壤养分综合管理以及进行土壤改良和耕作都具有一定的指导作用。

[ Qin S, Fan Y, Liu H B, et al.Study on the relations between topographical factors and the spatial distributions of soil nutrients[J]. Research of Soil and Water Conservation, 2008,1:46-49,52. ]

[35]
德科加,张德罡,王伟,等.不同海拔下高寒草甸土壤养分分异趋势及其与地上植物量间的相关性研究[J].草地学报,2013(1):5-29.以青海省称多地区高寒草甸6个海拔梯度(4056,4221,4263,4293,4332,4427 m)样地为对象,通过测定土壤养分质量分数,研究了土壤养分随海拔梯度的变化规律及其与地上植物量的相关关系.结果表明:土壤有机质、全氮(N)、速效N、速效磷(P)、速效钾(K)的质量分数随海拔均呈“U”型分异趋势;土壤全P质量分数随海拔梯度的变化相对稳定;土壤全K、全N、速效N、速效K、速效P、土壤有机质的质量分数与地上植物量呈相似的变化趋势,其中,土壤全N、速效K与地上植物量成显著正相关(P<0.05).土壤全N、土壤有机质、速效N、速效P和速效K是影响地上植物量的第1主成分,土壤全P和全K是第2主成分,累计贡献率为78.77%.

DOI

[ De K J, Zhang D G, Wang W, et al.Differentiation of soil nutrients along altitude gradient and its relationship with aboveground biomass in alpine meadow[J]. Acta Agrestia Sinica, 2013,1:25-29. ]

[36]
邵方丽,余新晓,杨志坚,等.北京山区典型森林土壤的养分空间变异与环境因子的关系[J].应用基础与工程科学学报,2012(4):581-591.根据北京山区典型森林植被的分布设置采样点,应用典范对应分析 (CCA)法,对土壤养分空间变异与环境因子的关系进行分析.结果显示:研究区土壤有机质、氮、钾含量相对丰富,严重缺磷,养分整体表现为中等变异.从 CCA排序结果看,环境对养分变异的影响程度及因子数量均随土层深度的增加而减小.0-10cm、10-20cm土层养分的影响因子相似,主要为坡位、海 拔、0-20cm土层含水量及容重;20-40cm土层养分的主要影响因子为坡位、海拔、0-40cm土层含水量及容重;40-60cm土层养分的主要影 响因子为该土层的pH值.对不同养分指标而言,有机质、全氮和碱解氮的主要影响因子为坡位、土壤含水量、海拔及林分类型;速效钾主要受土壤厚度影响;其它 指标受环境因子的影响小.环境因子的定量分离结果显示,其在总体上解释了83.33%的养分变异,其中土壤相关因子解释了50.37%,地形因子解释了 7.96%,二者的耦合作用解释了25%.

DOI

[ Shao F L, Yu X X, Yang Z J, et al.The relationship between environmental factors and spatial variability of soil nutrients for typical forest types in Beijing mountainous area[J]. Journal of Basic Science and Engineering, 2012,4:581-591. ]

[37]
郑文娟, 鲍士旦.应用生物法研究土壤含钾矿物与土壤供钾能力间关系[J].土壤学报,1994,31(3):267-276.本文主要通过矿物鉴定,生物试验方法,辅以电超滤(EUF)法及常规化学分析研究了黄潮土,黄棕壤,灰潮土和红壤的含钾矿物类型,含钾量及其不同粒级中分布与土壤供钾能力间关系。研究表明,四种壤的含钾矿物,全钾量主要分布于土壤0-50μm部,并以0-2μm部分的最丰富。随着土壤粒径增大,土壤含钾矿物组成逐渐简单化,含量逐渐降低。通过生物试验证明,土壤中三个粒级的供钾能力亦是0-2μm>2-10μm>10-5

[ Zheng W J, Bao S D.Relationship between the composition and Contents of potassium-supplying power of soils studied using the biological test technique[J]. Acta Pedologica Sinica, 1994,31(3):267-276.]

Outlines

/