
Journal of Geo-information Science >
Research on Geographical Preference of Scientific Collaboration : A Case Study of Haze Research Network in China
Received date: 2016-06-01
Request revised date: 2016-10-10
Online published: 2017-02-17
Copyright
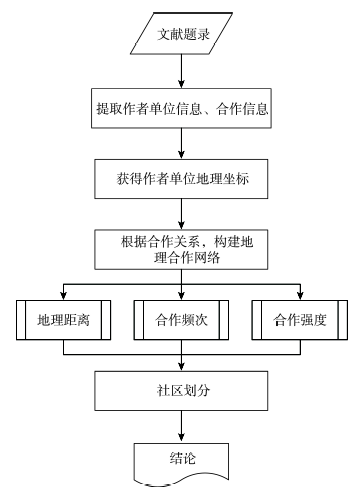
Scientific collaboration is an important way of knowledge dissemination and sharing. Researches have showed that geographic factor is one of the main factors that influencing scientific collaboration. However, most of related researches have just quantitatively described the functional relationship between collaboration strength and geographic distance from the perspective of Scientometrics. As a result, it can hardly detect the spatial characteristics and relationship of scientific collaboration. In this paper, for the purpose of mining spatial patterns in scientific collaboration network, geographical preference of scientific collaboration was studied from the view of geography. Taking the haze research network in China for example, the location information was extracted from bibliographic data and then the virtual scientific collaboration network can be mapped into geo-collaboration network by using geocoding service. Based on this, a distance-based method for community detection of scientific collaboration network was proposed to explore the spatial cluster pattern in scientific collaboration. Using modified Louvain community detection algorithm, two different variables were used as weight factor to detect communities. The results showed that, the community detection algorithm considering collaboration frequency and geographic distance can make the average geographic distance minimum and the Salton index maximum inside community, which both reflect the geographical preference and collaboration strength of scientific collaboration. This method can effectively explore the spatial pattern and relationship in scientific collaboration network, and represent geographical preference of scientific collaboration in a quantitative and qualitative way. In addition, it is a novel method of introducing geographic location and geographic distance into complex network analysis. We hope that it will not only be helpful for scientific collaboration network, but also can be applied to other complex network for geographic community detection.
WANG Shuang , CHEN Yufen , YUAN Yecheng , LI Wei , WANG Chengshun . Research on Geographical Preference of Scientific Collaboration : A Case Study of Haze Research Network in China[J]. Journal of Geo-information Science, 2017 , 19(2) : 248 -255 . DOI: 10.3724/SP.J.1047.2017.00248
Fig. 1 Research method图1 研究方法 |
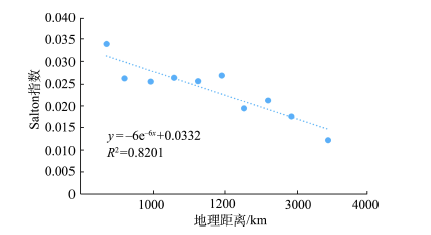
Fig. 2 Relationship of Salton index and geographic distance图2 Salton指数与地理距离的关系 |
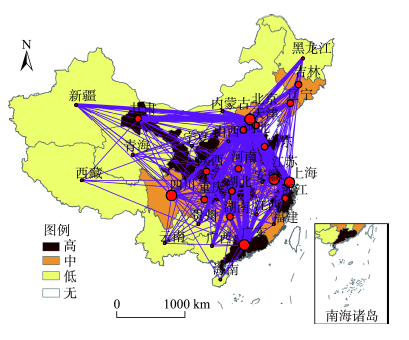
Fig. 3 Geo-collaboration network图3 地理合作网络 |
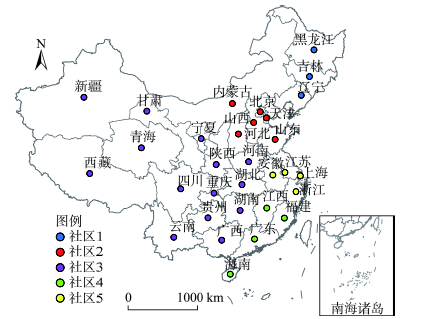
Tab.1 Community dipartition based on distance表1 基于地理距离的社区划分结果 |
| 社区名称 | 地区 |
|---|---|
| 社区1 | 黑龙江、吉林、辽宁 |
| 社区2 | 北京、内蒙古、天津、河北、山东、山西 |
| 社区3 | 甘肃、新疆、西藏、青海、宁夏、河南、陕西、湖北、湖南、广西、云南、贵州、重庆、四川 |
| 社区4 | 广东、福建、江西、海南 |
| 社区5 | 江苏、上海、浙江、安徽 |
Fig. 4 Community dipartition based on distance图4 基于地理距离的社区划分结果 |
Tab.2 Average distance matrix of each community (km)表2 社区之间的平均地理距离矩阵(km) |
| 社区 | |||||
|---|---|---|---|---|---|
| 社区1 | 社区2 | 社区3 | 社区4 | 社区5 | |
| 社区1 | 463 | 883 | 2334 | 2359 | 1520 |
| 社区2 | 883 | 379 | 1415 | 1803 | 1063 |
| 社区3 | 2334 | 1415 | 1124 | 1380 | 1476 |
| 社区4 | 2359 | 1803 | 1380 | 538 | 1037 |
| 社区5 | 1520 | 1063 | 1476 | 1037 | 378 |
Tab.3 Average Salton index matrix of each community表3 社区之间的平均Salton指数矩阵 |
| 社区 | |||||
|---|---|---|---|---|---|
| 社区1 | 社区2 | 社区3 | 社区4 | 社区5 | |
| 社区1 | 0.0199 | 0.0289 | 0.0230 | 0.0178 | 0.0154 |
| 社区2 | 0.0289 | 0.0448 | 0.0292 | 0.0343 | 0.0244 |
| 社区3 | 0.0230 | 0.0292 | 0.0223 | 0.0347 | 0.0166 |
| 社区4 | 0.0178 | 0.0343 | 0.0347 | 0.0691 | 0.0199 |
| 社区5 | 0.0154 | 0.0244 | 0.0166 | 0.0199 | 0.0327 |
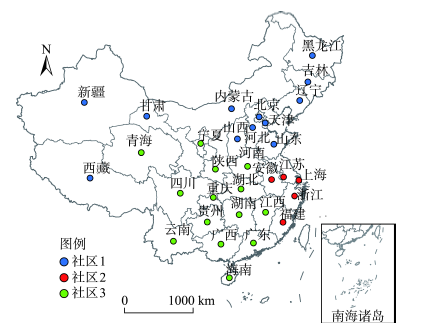
Fig.5 Community dipartition based on collaboration frequency and distance图5 基于合作频次与地理距离的社区划分结果 |
Tab.4 Community dipartition based on collaboration frequency and distance表4 基于合作频次和地理距离的社区划分结果 |
| 社区名称 | 地区 |
|---|---|
| 社区1 | 黑龙江、吉林、辽宁、北京、内蒙古、天津、河北、山东、山西、甘肃、新疆、西藏 |
| 社区2 | 江苏、安徽、上海、浙江、福建 |
| 社区3 | 广东、广西、海南、云南、贵州、江西、湖南、湖北、重庆、四川、河南、陕西、青海、宁夏 |
Tab. 5 Average distance matrix of each community (km)表5 社区之间的平均地理距离矩阵(km) |
| 社区 | |||
|---|---|---|---|
| 社区1 | 社区2 | 社区3 | |
| 社区1 | 1071 | 1458 | 1690 |
| 社区2 | 1458 | 301 | 1188 |
| 社区3 | 1690 | 1188 | 897 |
Tab. 6 Average Salton index matrix of each community表6 社区之间的平均Salton指数矩阵 |
| 社区 | |||
|---|---|---|---|
| 社区1 | 社区2 | 社区3 | |
| 社区1 | 0.0326 | 0.0207 | 0.0266 |
| 社区2 | 0.0207 | 0.0331 | 0.0182 |
| 社区3 | 0.0266 | 0.0182 | 0.0310 |
The authors have declared that no competing interests exist.
| [1] |
[
|
| [2] |
|
| [3] |
[
|
| [4] |
|
| [5] |
|
| [6] |
[
|
| [7] |
|
| [8] |
|
| [9] |
[
|
| [10] |
[
|
| [11] |
[
|
| [12] |
|
| [13] |
|
| [14] |
[
|
| [15] |
|
| [16] |
[
|
| [17] |
[
|
| [18] |
[
|
| [19] |
|
| [20] |
|
| [21] |
|
| [22] |
|
| [23] |
Newman M E J. Fast algorithm for detecting community structure in networks[J]. Physical Review E Statistical Nonlinear & Soft Matter Physics, 2004,69(6):066133(1-5).
|
| [24] |
[
|
| [25] |
[
|
| [26] |
|
/
| 〈 |
|
〉 |