
Journal of Geo-information Science >
Study on the Difference of Mangrove in Beibu Bay Between China and Vietnam
Received date: 2016-04-20
Request revised date: 2016-06-03
Online published: 2017-02-17
Copyright
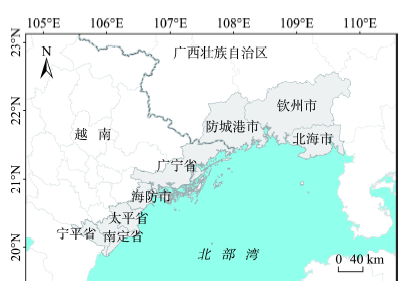
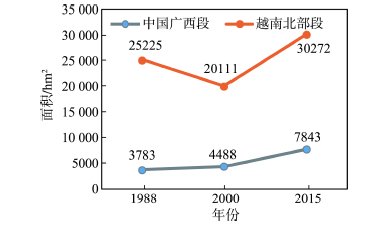
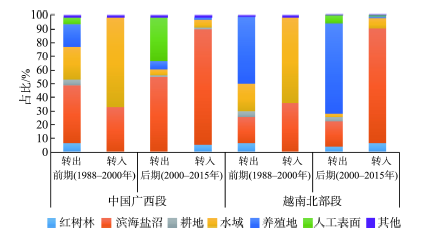
Mangrove is a special species which can adapt to the ocean and the land at the same time. Mangrove distributes in the coastal estuarine intertidal zone about 30°N~30°S on Earth where the climate is tropical or subtropical. The distribution of mangrove is restricted by the natural conditions and the climate. Also, it is disturbed by anthropogenic activities at a certain degree. Two adjacent regions, the coast of the Guangxi Zhuang Autonomous Region in China and the coast of Northern Vietnam, where the geomorphology and the climate are similar and the level of economic development is different, were chosen as the study area. Based on Landsat TM remote sensing images, we used the supervised classification and manual interpretation methods to acquire the distribution data of mangrove in the study areas in 1988, 2000 and 2015. We comparatively analyzed the differences in spatial-temporal transformation, the change of landscape pattern and the driving forces of the two coastal mangroves. This study indicated that: (1) During 1988-2015, the area of Guangxi Mangrove is increasing. It increased 18% in 2000 than that in 1988 and it increased 75% in 2015 than that in 2000. Northern Vietnam decreased first and then increased. In 2000, mangrove area decreased by 20% compared to that in 1988 and it increased by 50% in 2015 compared to that in 2000. (2) In the landscape pattern of mangrove, the average patch area of Guangxi Mangrove is relatively smaller, and it has higher degree of fragmentation, and the patch shape is more regular, closer to the square, more severely disturbed by human activities. North Vietnam mangrove has a larger patch area, lower degree of fragmentation, and the plaques have a shape of strips and were disturbed less severely by human activities. (3) The major human driving factors are as follows: the main human driving factors are changing in Guangxi Mangrove in China. From 1988 to 2000, cultivation ponds constructed by reclamation dominated. During 2000-2015, urbanization and factory-mining construction dominated. In North Vietnam, cultivation ponds constructed by reclamation always dominated during 1988-2015.
Key words: mangrove; remote sensing; Beibu Bay; landscape pattern; driving force
WANG Wuxia , SU Fenzhen , FENG Xue , CHEN Fei . Study on the Difference of Mangrove in Beibu Bay Between China and Vietnam[J]. Journal of Geo-information Science, 2017 , 19(2) : 264 -272 . DOI: 10.3724/SP.J.1047.2017.00264
Fig. 1 The location of study area图1 研究区段中国广西段和越南北部段位置图 |
Tab. 1 Parameters of satellite remote sensing images表1 遥感影像卫星参数表 |
| 行列号 | 时间 | 卫星 | 传感器 | 分辨率/m |
|---|---|---|---|---|
| 124045 | 1988-10-21 | landsat5 | TM | 30 |
| 2000-11-23 | landsat5 | TM | 30 | |
| 2015-09-30 | landsat8 | ETM | 15 | |
| 125045 | 1990-09-16 | landsat5 | TM | 30 |
| 1987-09-08 | landsat5 | TM | 30 | |
| 2000-12-24 | landsat7 | TM | 30 | |
| 2015-04-14 | landsat8 | ETM | 15 | |
| 126045 | 1988-11-04 | landsat5 | TM | 30 |
| 1999-12-21 | landsat5 | TM | 30 | |
| 2015-05-10 | landsat8 | ETM | 15 | |
| 126046 | 1988-11-04 | landsat5 | TM | 30 |
| 2000-09-18 | landsat5 | TM | 30 | |
| 2015-05-13 | landsat8 | ETM | 15 |
Tab. 2 Classification of landscape typesbased on Mangrove表2 基于红树林的景观类型分类 |
| 序号 | 类别 | 描述 |
|---|---|---|
| 1 | 红树林 | 红树林植被生长区 |
| 2 | 滨海盐沼 | 滨海湿地、潮滩、草本植被生长区 |
| 3 | 耕地 | 水田、旱地等人工耕作地区 |
| 4 | 水域 | 河流、湖泊、海面等 |
| 5 | 养殖用地 | 人工建造的用于养殖的水体表面,包括围填海用来养殖的水面 |
| 6 | 人工表面 | 包括所有类型的城市用地,如交通、居民地、城市建设用地和港口码头等工业设施。 |
| 7 | 其他 | 其他未分类景观类型,包括裸地和其他植被。 |
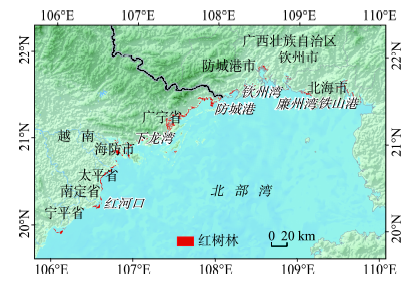
Fig. 2 Mangrove distribution in the Northeasternof Beibu Bay (2015)图2 北部湾西北部红树林分布(2015年) |
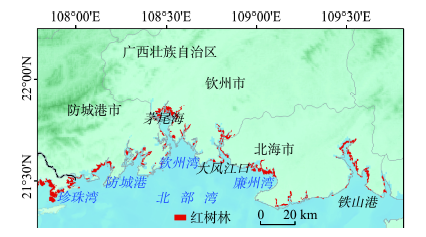
Fig. 3 Mangrove distribution in GuangxiProvince, China (2015)图3 中国广西段红树林分布图(2015年) |
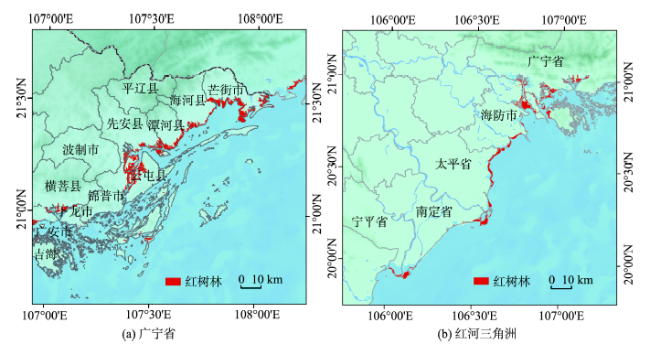
Fig. 4 Maps of mangrove distribution in the Northern Vietnam (2015)图4 越南北部段红树林分布图(2015年) |
Fig. 5 The area of mangroves in the two regions图5 研究区中国广西段和越南北部段红树林面积 |
Tab. 3 Comparison of annual changing rate ofmangrove area表3 红树林面积年变化率对比 |
| 研究区域 | 面积年变化率/% | |
|---|---|---|
| 1988-2000年 | 2000-2015年 | |
| 中国广西段 | 2.42 | 3.81 |
| 越南北部段 | -1.76 | 3.37 |
Tab. 4 Mangrove landscape indices in Guangxi province of China (I) and Northern Vietnam (II)表4 研究区中国广西段(Ⅰ)和越南北部段(Ⅱ)红树林景观指数计算结果 |
| 类型 | 景观指数 | 研究段 | 1988年 | 2000年 | 2015年 |
|---|---|---|---|---|---|
| 基本 指数 | 总斑块数目 /NP | Ⅰ | 476 | 441 | 510 |
| Ⅱ | 634 | 785 | 386 | ||
| 总面积 A/hm2 | Ⅰ | 3783.36 | 4883.95 | 7672.68 | |
| Ⅱ | 25 485.71 | 20 111.06 | 30 272.16 | ||
| 总周长 L/m | Ⅰ | 573 352 | 640 243 | 850 677 | |
| Ⅱ | 1 916 946 | 1 969 754 | 1 672 239 | ||
| 破碎化指数 | 平均斑块 大小/MPS | Ⅰ | 7.95 | 11.07 | 15.04 |
| Ⅱ | 40.20 | 25.62 | 78.43 | ||
| 最大斑块 指数/LPI | Ⅰ | 197.04 | 196.65 | 215.44 | |
| Ⅱ | 1149.29 | 841.75 | 1763.41 | ||
| 景观形状指数 | 平均斑块周长面积比/PA | Ⅰ | 151.55 | 131.09 | 110.87 |
| Ⅱ | 75.22 | 97.94 | 55.24 | ||
| 形状指数 /LSI | Ⅰ | 301.13 | 362.95 | 417.00 | |
| Ⅱ | 3001.94 | 3472.44 | 2402.79 |
Fig. 6 The proportions of various stages ofmangrove transformation图6 红树林转化类型各时期占比 |
Tab. 5 Comparison of the transfer into and from mangrove with its surrounding landscape types (hm2)表5 红树林与周边景观类型的转入和转出对比(hm2) |
| 研究区段 | 景观类型 | 前期(1988-2000年) | 后期(2000-2015年) | |||
|---|---|---|---|---|---|---|
| 转出 | 转入 | 转出 | 转入 | |||
| 中国 广西段 | 红树林 | 108.61 | 9.47 | 0 | 176.68 | |
| 滨海盐沼 | 707.99 | 3066.48 | 358.16 | 3074.40 | ||
| 耕地 | 67.99 | 20.74 | 5.24 | 32.45 | ||
| 水域 | 397.44 | 6230.21 | 28.23 | 218.93 | ||
| 养殖用地 | 281.53 | 0.00 | 41.30 | 58.20 | ||
| 人工表面 | 80.53 | 0.00 | 208.70 | 0.00 | ||
| 其他 | 35.08 | 182.20 | 11.78 | 73.26 | ||
| 总计 | 1679 | 9509 | 653 | 3634 | ||
| 变化 | 7830 | 2981 | ||||
| 越南 北部段 | 红树林 | 878.21 | 9.42 | 187.93 | 915.83 | |
| 滨海盐沼 | 2520.00 | 2911.90 | 910.49 | 12193.10 | ||
| 耕地 | 599.07 | 12.32 | 163.19 | 0.00 | ||
| 水域 | 2717.58 | 5110.56 | 135.73 | 1078.13 | ||
| 养殖用地 | 6610.58 | 0.00 | 3293.31 | 177.03 | ||
| 人工表面 | 20.87 | 0.00 | 322.86 | 203.31 | ||
| 其他 | 213.00 | 182.20 | 4.22 | 27.22 | ||
| 总计 | 13 559 | 8226 | 5018 | 14 595 | ||
| 变化 | -5333 | 9577 | ||||
The authors have declared that no competing interests exist.
| [1] |
[
|
| [2] |
|
| [3] |
FAO. The World′s Mangroves 1980-2005: A Thematic Study in the Framework of the Global Forest Resources Assessment 2005. Rome, Italy, 2007.
|
| [4] |
|
| [5] |
|
| [6] |
|
| [7] |
|
| [8] |
[
|
| [9] |
[
|
| [10] |
[
|
| [11] |
[
|
| [12] |
[
|
| [13] |
[
|
| [14] |
[
|
| [15] |
|
| [16] |
|
| [17] |
|
| [18] |
|
| [19] |
[
|
| [20] |
刘纪远等. 中国资源环境遥感宏观调查与动态研究[M].北京:中国科学技术出版社,1996.
[
|
| [21] |
|
| [22] |
[
|
| [23] |
|
| [24] |
[
|
| [25] |
|
| [26] |
[
|
| [27] |
[
|
| [28] |
[
|
| [29] |
[
|
/
| 〈 |
|
〉 |