
Journal of Geo-information Science >
Analysis of the Temporal and Spatial Variation Characteristics of Precipitation in the Lancang River Basin over the Past 55 Years
Received date: 2016-03-28
Request revised date: 2016-05-05
Online published: 2017-03-20
Copyright
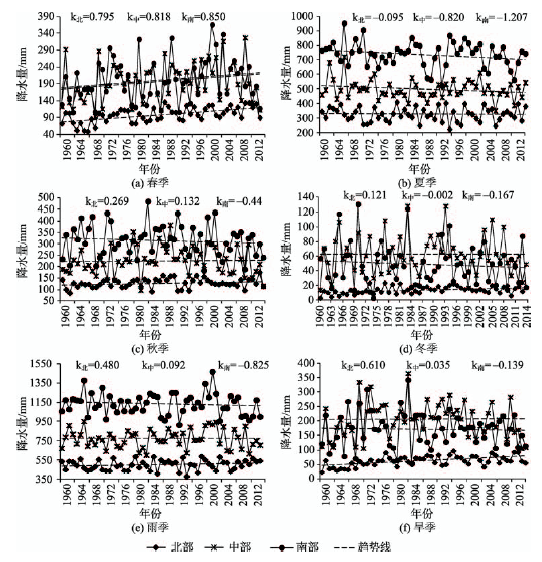
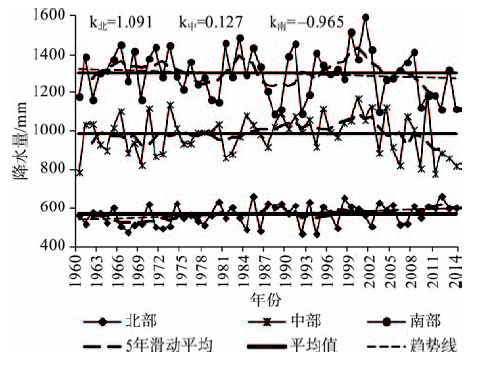
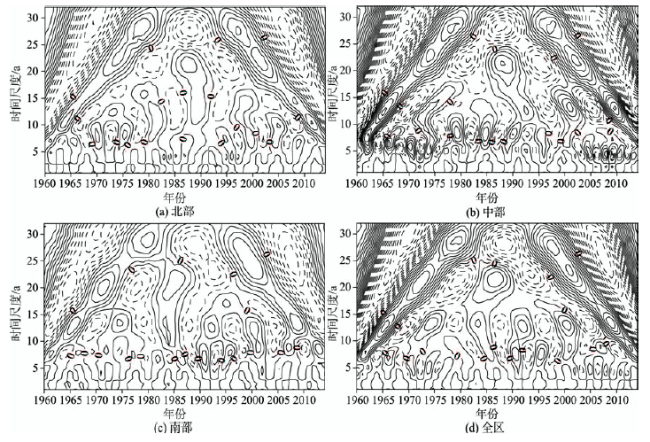
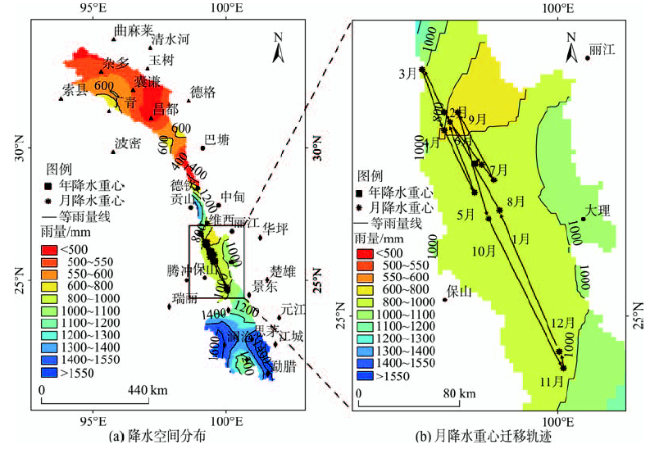
Based on the monthly precipitation data from 30 meteorological stations in and surrounding the Lancang River basin, we analyzed the temporal and spatial characteristics of precipitation from 1960 to 2014 using the climate tendency rate, Mann Kendall trend test, Morlet wavelet analysis, interpolation co-Kriging, and gravity center model methods. The results showed that: (1) in the analysis period, the overall precipitation and regional precipitation in the northern and central regions showed a rising trend, but a decreasing trend on precipitation for the southern region occurred. The overall, northern, central and southern precipitations showed an increasing trend in spring, while in summer they showed a decreasing trend. In autumn, there was a decreasing trend of precipitation in the whole region and in the south. The northern and central parts of the region were having an increasing trend. The precipitation in the whole region, the middle and the southern parts showed a downward trend in winter with the exception of the northern part. (2) There were cycles in precipitation of 29 years, 22 years and 5 to 10 years within the region, including the northern, central and southern parts in the past 55 years. The performance of the three cycles in the analyzed period was very stable, indicating a domain-wide characteristic. There was also a significant cycle of around 13 years in precipitation for the whole, northern and southern regions. Before mid 1975 and after 1995, there was also a cycle of about 13 years in precipitation for the central area. In the northern area before 1975 and after 1995, there was a cycle of 7-10 years in precipitation. The first grade main cycle in precipitation was 29 years, and the second grade main cycle was 22 years. (3) The average annual precipitation decreased in the Lancang River Basin from the south to the north. The precipitation in the southern basin was the heaviest, with an average precipitation of more than 1200 mm. The average annual precipitation in the middle area was 800-1100 mm, while the average annual precipitation in the northern part was usually less than 800 mm, mostly in the range of 400-800 mm; the annual and monthly precipitation gravity centers of the Lancang River Basin were located in the central region. The precipitation gravity center of November had the largest migration distance, which migrated southeast by a distance of 131.82 km. From the seasonal point of view, the precipitation gravity centers in spring, summer and autumn had migrated toward the southeast, while in winter, it migrated toward the northwest. The precipitation gravity centers in the rainy seasons were relatively aggregated, while in the dry seasons they were relatively dispersed.
Key words: Lancang River; precipitation; M-K test; Morlet wavelet; gravity center model
CHEN Sujing , LI Lijuan , LI Jiuyi , LIU Jiaxu . Analysis of the Temporal and Spatial Variation Characteristics of Precipitation in the Lancang River Basin over the Past 55 Years[J]. Journal of Geo-information Science, 2017 , 19(3) : 365 -373 . DOI: 10.3724/SP.J.1047.2017.00365
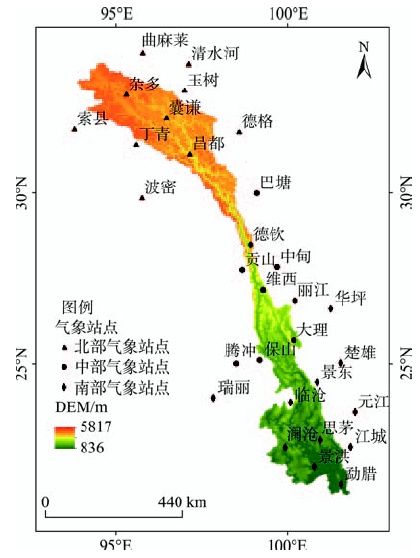
Fig. 1 Range and location of Lancang River图1 澜沧江流域范围 |
Fig. 2 The seasonal variations of precipitation in each region of Lancang River图2 澜沧江各区域降水的季节变化 |
Tab. 1 The M-K test’s Z values of each regional precipitation表1 各个区域降水量M-K检验的z值 |
| 区域 | 春季 | 夏季 | 秋季 | 冬季 | 雨季 | 旱季 |
|---|---|---|---|---|---|---|
| 北部 | 4.254*** | -0.189 | 1.481* | 3.064*** | 0.973 | 3.920*** |
| 中部 | 1.728* | -0.697 | 0.363 | -0.240 | 0.145 | 0.051 |
| 南部 | 1.612* | -1.292* | -0.581 | -0.494 | -0.755 | -0.131 |
| 全区 | 2.468*** | -1.510* | -0.261 | -0.174 | -0.450 | 0.261 |
注:*表示通过了信度90%的M-K显著性检验;***表示通过了信度99%的M-K显著性检验 |
Fig. 3 The changes of precipitation in the Lancang River basin from 1960 to 2014图3 1960-2014澜沧江流域年降水量变化 |
Fig. 4 The real part of the wavelet coefficients for precipitation图4 降水量小波系数实部图 |
Fig. 5 The spatial distribution of precipitation and its gravity center trajectory changes in the Lancang River basin图5 澜沧江流域降水量的空间分布及重心迁移轨迹 |
Tab. 2 The migration trajectory of monthlyprecipitation in the Lancang River basin表2 澜沧江流域月降水重心迁移轨迹 |
| 时间 | 降水重心 | 迁移 方向 | 迁移 距离/km | |
|---|---|---|---|---|
| 经度 | 纬度 | |||
| 1月 | 99.58° | 25.76° | 西北 | 120.92 |
| 2月 | 99.18° | 26.47° | 西北 | 88.85 |
| 3月 | 99.02° | 26.78° | 西北 | 38.44 |
| 4月 | 99.18° | 26.34° | 东南 | 51.80 |
| 5月 | 99.40° | 25.89° | 东南 | 54.64 |
| 6月 | 99.22° | 26.40° | 西北 | 59.70 |
| 7月 | 99.45° | 26.09° | 东南 | 41.49 |
| 8月 | 99.54° | 25.98° | 东南 | 14.96 |
| 9月 | 99.28° | 26.47° | 西北 | 60.15 |
| 10月 | 99.50° | 25.70° | 东南 | 87.90 |
| 11月 | 100.04° | 24.62° | 东南 | 131.82 |
| 12月 | 100.01° | 24.74° | 西北 | 13.16 |
The authors have declared that no competing interests exist.
| [1] |
[
|
| [2] |
[
|
| [3] |
[
|
| [4] |
[
|
| [5] |
[
|
| [6] |
[
|
| [7] |
[
|
| [8] |
[
|
| [9] |
[
|
| [10] |
[
|
| [11] |
[
|
| [12] |
|
| [13] |
|
| [14] |
[
|
| [15] |
[
|
| [16] |
[
|
| [17] |
[
|
| [18] |
[
|
| [19] |
[
|
| [20] |
[
|
/
| 〈 |
|
〉 |