
Journal of Geo-information Science >
Indoor Experimental Study on Vegetation-soil Mixed Pixels based on Polarization Vegetation Index
Received date: 2016-07-12
Request revised date: 2016-09-26
Online published: 2017-03-20
Copyright
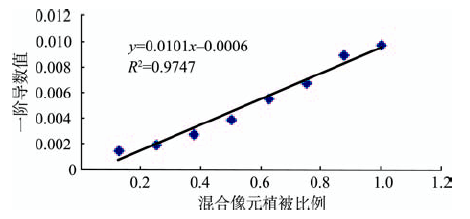
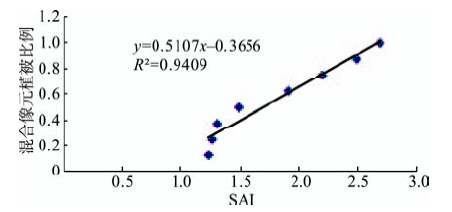
In remote sensing images, mixed pixel is a common phenomenon. The inversion of component composition and proportion of mixed pixels has been a key and difficult point in remote sensing research. Besides, the study of the mixed pixel using polarization vegetable index has not been conducted in China, yet. This study analyzed the hyperspectral characteristics of polarized reflections of vegetation-soil mixed pixels in different area ratios and discussed the hyperspectral characteristics under different conditions. We used the polarized reflection ratios to calculate the polarization vegetation indices of 12 types of 0 degree polarization and constructed the mathematical model of vegetation area ratio related to spectral characteristic parameters and vegetation index. The results show that vegetation area ratio and polarization angle have certain influence on hyper-spectrum of polarization of mixed pixels. The correlation between polarized reflection ratio of 865nm and the proportion of the vegetation is the best. When the polynomial fitting is applied, the coefficient of determination is up to 0.99. It implies this method is suitable for the inversion of the proportion of vegetation in pixels. With the proportion of vegetation there is a good linear correlation of first order differential of the polarization spectrum on "red edge",R- square = 0.974. Spectral characteristic parameters and vegetation index have good correlations with vegetation area ratio with the P-DVI and spectral absorption index (SAI) showing the best fitting goodness of vegetation area ratio (the coefficients of determination are 0.99 and 0.94, respectively). It implies this method is suitable for the inversion of vegetation area in vegetation-soil mixed pixels.
CHEN Xingren , HAN Yang , WANG Jiaqi , LU Zhen . Indoor Experimental Study on Vegetation-soil Mixed Pixels based on Polarization Vegetation Index[J]. Journal of Geo-information Science, 2017 , 19(3) : 374 -381 . DOI: 10.3724/SP.J.1047.2017.00374
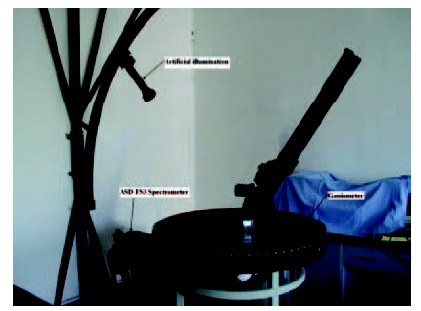
Fig. 1 BRDF platform and spectrometer图1 BRDF平台与光谱仪 |
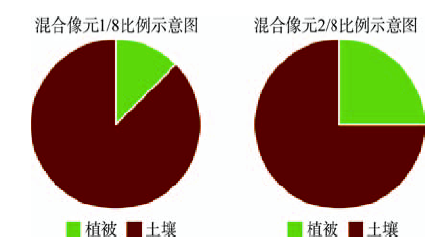
Fig. 2 Schematic diagram of mixed pixels图2 混合像元示意图 |
| 植被指数 | 名称 | 公式 |
|---|---|---|
| P-NDVI | 归一化植被指数 | (R800-R675)/(R800+R675) |
| P-RVI | 比值植被指数 | R800/R675 |
| P-DVI | 差值植被指数 | R800-R675 |
| P-MSR | 优化比值植被指数 | (R800/R675-1)/(R800/R675+1)1/2 |
| P-FNDVI | 全波段归一化植被指数 | (R930-R515)/(R930+R515) |
| P-FRVI | 全波段比值植被指数 | R765-R585 |
| P-FDVI | 全波段差值植被指数 | R1230-R1100 |
| P-EVI | 增强型植被指数 | 2.5(R800-R675)/(R800+6R675-7.5R457+1) |
| P-HJVI | 环境植被指数 | 2(R800-R675)/(7R550-7.5R457+0.9) |
| P-TVI | 转换植被指数 | ((R800-R675)/(R800+R675))1/2+0.5 |
| P-RDVI | 再归一化植被指数 | ((R800-R675)(R800-R675)/(R800+R675))1/2 |
| P-WDRVI | 宽动态植被指数 | (0.15R800-R675)/(0.15R800+R675) |
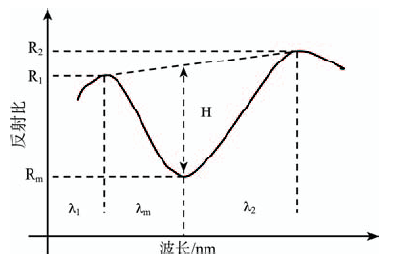
Fig. 3 The principle of the SAI model图3 SAI模型原理图 |
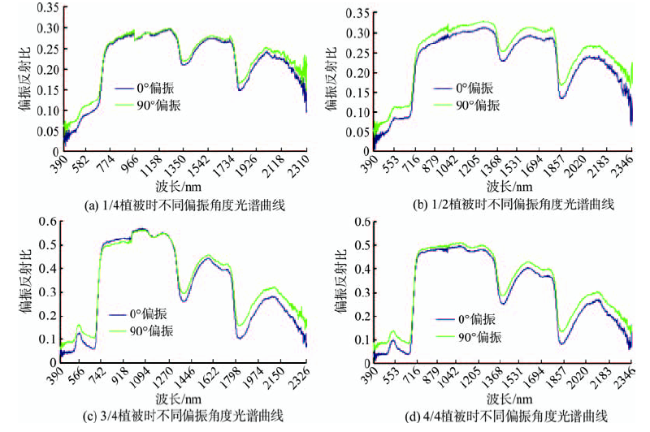
Fig. 4 Polarization spectral curve of mixed pixels in different polarization angel图4 混合像元不同偏振态下的偏振高光谱图 |
Fig. 5 Polarization spectral curve of different vegetation area proportion图5 不同植被面积比例的植被偏振高光谱图 |
Tab. 2 Linear relationship between the vegetation area proportion and polarization reflection of typical wave band表2 植被面积比例与特征波段偏振反射比的线性关系 |
| 波段/nm | 函数类型Function Type | 线性方程Linear Equation | R2 |
|---|---|---|---|
| 490 | 线性 | Y=0.0759X+0.07243 | 0.660 |
| 多项式 | Y=0.19086X 2-0.13881X+0.11765 | 0.924 | |
| 指数 | Y=0.07976e0.60985x | 0.674 | |
| 670 | 线性 | Y=0.00952X+0.14264 | 0.036 |
| 多项式 | Y=0.15924X 2-0.16962X+0.17996 | 0.670 | |
| 指数 | Y=0.14286e0.05444x | 0.053 | |
| 865 | 线性 | Y=0.42943X+0.14957 | 0.940 |
| 多项式 | Y=0.40419X 2-0.02529X+0.2443 | 0.990 | |
| 指数 | Y=0.20129e1.0903x | 0.972 |
Fig. 6 The first order differential curves of polarization hyper-spectrum of mixed pixels图6 混合像元偏振高光谱一阶微分导数图 |
Fig. 7 The fitting curve of vegetation areaproportion and red edge derivative图7 植被面积比例与红边导数值线性拟合图 |
Tab. 3 The selection of “red edge” band表3 “红边”波段选取 |
| 植被比例 | ||||||||
|---|---|---|---|---|---|---|---|---|
| 1/8 | 2/8 | 3/8 | 4/8 | 5/8 | 6/8 | 7/8 | 9/9 | |
| 波段位置/nm | 718 | 719 | 720 | 723 | 725 | 721 | 722 | 722 |
Tab. 4 Linear relationship between vegetation index and vegetation area proportion表4 植被指数与植被面积比例的线性关系 |
| 植被指数 | 线性方程 | R2 |
|---|---|---|
| P-NDVI | Y=0.44855X+0.15725 | 0.95 |
| P-RVI | Y=2.6253X+1.0798 | 0.96 |
| P-DVI | Y=0.46314X+0.03518 | 0.99 |
| P-MSR | Y=0.22428X+0.07863 | 0.95 |
| P-FNDVI | Y=0.16978X+0.41284 | 0.79 |
| P-FRVI | Y=1.8486X+1.4331 | 0.92 |
| P-FDVI | Y=-0.07629X+0.02629 | 0.92 |
| P-EVI | Y=0.4X+0.0237 | 0.98 |
| P-HJVI | Y=0.3264X+0.0399 | 0.98 |
| P-TVI | Y=0.2243X+0.5786 | 0.96 |
| P-RDVI | Y=4.6949X-0.1587 | 0.94 |
| P-WDRVI | Y=0.4167X-0.6901 | 0.96 |
Tab. 5 The sensitive wave band of differentvegetation area proportion表5 不同植被面积比例下的敏感波段 |
| 植被面积 比例 | 吸收谷波长 位置/nm | 波段范围 /nm | 吸收谷宽度 /nm |
|---|---|---|---|
| 1/8 | 1424 | 1320~1637 | 317 |
| 2/8 | 1422 | 1313~1593 | 280 |
| 3/8 | 1422 | 1313~1646 | 331 |
| 4/8 | 1435 | 1314~1670 | 356 |
| 5/8 | 1455 | 1315~1670 | 355 |
| 6/8 | 1450 | 1272~1658 | 386 |
| 7/8 | 1453 | 1262~1662 | 400 |
| 8/8 | 1450 | 1282~1663 | 381 |
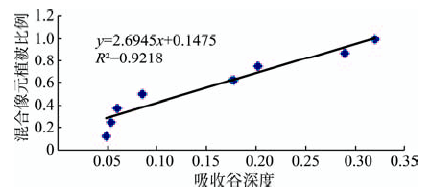
Fig. 8 Linear relationship between absorption valleydepth and vegetation area proportion图8 吸收谷深度与植被像元比例的一次相关关系 |
Fig. 9 Linear relationship between SAI andvegetation area proportion图9 SAI与植被像元比例的一次相关性关系 |
The authors have declared that no competing interests exist.
| [1] |
[
|
| [2] |
[
|
| [3] |
[
|
| [4] |
[
|
| [5] |
[
|
| [6] |
[
|
| [7] |
[
|
| [8] |
[
|
| [9] |
|
| [10] |
[
|
| [11] |
[
|
| [12] |
[
|
| [13] |
[
|
| [14] |
|
| [15] |
[
|
| [16] |
[
|
| [17] |
[
|
| [18] |
[
|
| [19] |
|
| [20] |
|
| [21] |
|
| [22] |
|
| [23] |
[
|
| [24] |
[
|
| [25] |
[
|
/
| 〈 |
|
〉 |

