
Journal of Geo-information Science >
Evaluation of Intensive Coastline Utilization of Tianjin Center Harbor
Received date: 2016-06-13
Request revised date: 2016-10-13
Online published: 2017-03-20
Copyright
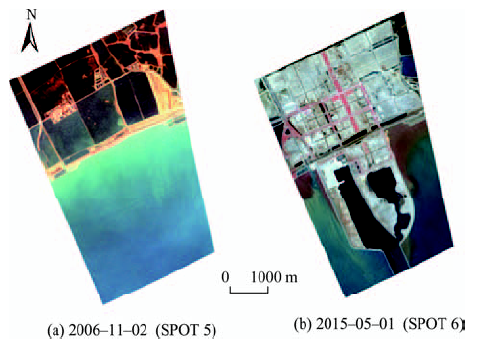
As the natural intersection belt of land and ocean areas, coastline zone plays a key role in promoting regional economic development. Therefore, the evaluation of coastline utilization is of great importance for coastline resource management. This paper firstly created an index system for the evaluation of coastline resource. Then, for optimal allocation of coastline resource, an evaluation index system for intensive coastline utilization based on remote sensing data as well as socio-economic data was proposed. Through interpreting two SPOT remote sensing images and field survey, all the index values were obtained. Then, two multi-factor evaluation models, coastline resource evaluation model and intensive coastline utilization evaluation model, were established based on the analytical hierarchy process (AHP). Tianjin center harbor, China, was taken to validate the feasibility of the models. The interpretation and analysis of remote sensing data of the harbor between 2006 and 2015 indicated that: (1) Tianjin center harbor covers an area of 2639.16 hm2, of which 1451.46 hm2 is the land reclamation area, accounting for 55% of the total area; (2) the length of coastline surrounding the harbor was 2.46 km in 2006, but increased to 10.84 km in 2015 due to the land reclamation; and (3) the utilized land reclamation area is 527.76 hm2, accounting for a proportion of 36.36%.The application of the aforementioned evaluation models to Tianjin Center Harbor on the basis of the information extracted from the remote sensing images and in situ investigation data showed that (1) the coastline-occupation level of the harbor in 2006 can be classified as a third grade with a score of 3.004; (2)the intensive coastline utilization of the harbor reached a comprehensive value of 0.3271, of which the factor of coastline utilization status scored a relatively high value of 0.1611, accounting for 49.25%, while the factor of output-to-input ratio hit a lowest of 0.0565. The analysis results suggested that the two proposed models could work effectively in the evaluation of the coastline resource and intensive coastline utilization for the Tianjin center harbor.
YANG Lijuan , XU Hanqiu , TANG Fei , FU Wei , WANG Meiya , SUN Feng-qin . Evaluation of Intensive Coastline Utilization of Tianjin Center Harbor[J]. Journal of Geo-information Science, 2017 , 19(3) : 417 -424 . DOI: 10.3724/SP.J.1047.2017.00417
Tab.1 The evaluation index system of coastline resource表1 岸线资源评价指标及权重 |
| 指标 | 权重 | 影响因子 | 权重 |
|---|---|---|---|
| 自然环境条件 | 0.2661 | 水文条件 | 0.1167 |
| 海洋水质条件 | 0.1183 | ||
| 岸线长度 | 0.0789 | ||
| 陆域生态环境 | 0.2205 | ||
| 水深条件 | 0.3574 | ||
| 海岸类型 | 0.1082 | ||
| 海域通航条件 | 0.2102 | 航道、锚地条件 | 1.0000 |
| 陆域集疏条件 | 0.1693 | 道路通达度 | 1.0000 |
| 陆域宽度 | 0.1434 | 陆域宽度 | 1.0000 |
| 社会经济条件 | 0.2110 | 产业配套设施完备度 | 0.4550 |
| 开发现状 | 0.5450 |
Tab.2 The grading standard of impact factor表2 影响因子定级标准 |
| 优(5分) | 良(4分) | 中(3分) | 较差(2分) | 差(1分) | |
|---|---|---|---|---|---|
| 水文条件 | 岸线很稳定 | 岸线稳定 | 岸线微冲 | 岸线较不稳定 | 岸线不稳定 |
| 海洋水质条件 | Ⅰ类(清洁) | Ⅱ类(较清洁) | Ⅲ类(轻度污染) | Ⅳ类(中度污染) | Ⅴ类(严重污染) |
| 岸线长度/m | >3500 | 2000~3500 | 1000~2000 | 500~1000 | <500 |
| 陆域生态环境 | 优(一级) | 良(二级) | 一般(三级) | 较差(四级) | 差(五级) |
| 水深条件/m | >20 | 15~20 | 10~15 | 5~10 | <5 |
| 海岸类型 | 基岩海岸 | 沙砾质海岸 | 淤泥质海岸 | 生物海岸 | 其他 |
| 航道/锚地条件 | 供10万t船舶停靠 | 供5万t船舶停靠 | 供1万t船舶停靠 | 供5000 t船舶停靠 | 供1000 t船舶停靠 |
| 道路通达度 | 高速公路(高速/铁路) | 一级公路(高速/国道) | 二级公路(省道) | 三级公路(县道/城郊道路) | 四级公路(乡村道路) |
| 陆域宽度/m | >1000 | 800~1000 | 500~800 | 100~500 | <100 |
| 产业配套设施完备度 | 很完善 | 较好 | 基本完备 | 不全 | 很不完备 |
| 开发现状 | 属于重点开发岸线 | 符合岸线总体规划 | 基本符合岸线总体规划 | 部分岸线总体规划受限制开发 | 部分重要岸线总体规划受限制开发 |
Tab.3 The evaluation index system of intensivecoastline utilization表3 岸线集约利用评价指标及权重确定 |
| 指标 | 权重 | 影响因子 | 权重 |
|---|---|---|---|
| 岸线利用状况 | 0.2370 | 岸线利用率 | 0.3325 |
| 围填海面积开发强度 | 0.4047 | ||
| 新增码头岸线长度比率 | 0.2628 | ||
| 岸线投入产出水平 | 0.3420 | 固定资产投入产出比率 | 1.0000 |
| 岸线运营强度 | 0.4210 | 货物吞吐量强度 | 1.0000 |
Tab.4 The calculation formula of impact factor表4 各影响因子计算公式 |
| 影响因子 | 计算公式 |
|---|---|
| 岸线利用率 | 已使用岸线长度/规划的岸线长度 |
| 围填海面积开发强度 | 围填海建设面积/围填海总面积 |
| 新增码头岸线长度比率 | 新增岸线长度/岸线总长度 |
| 固定资产投入产出比率 | 年平均收益总额/固定年投资额 |
| 货物吞吐量强度 | 货物吞吐量/规划的岸线长度 |
Fig. 1 The study area of Tianjin center harbor图1 天津中心渔港研究区 |
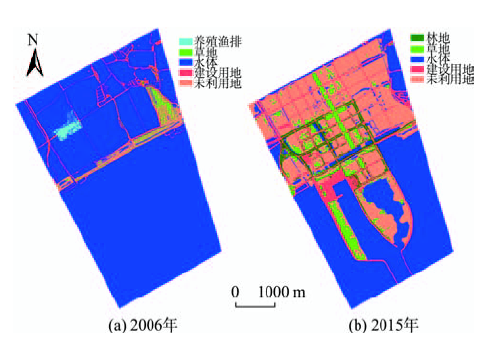
Fig. 2 The classification of land cover in Tianjin center harbor图2 研究区土地覆盖分类 |
Tab.5 The statistics data of land cover change表5 天津中心渔港土地覆盖类型变化统计 |
| 2006年/hm2 | 2015年/hm2 | 2006-2015年变化 | ||
|---|---|---|---|---|
| 面积/ hm2 | 比例/% | |||
| 养殖渔排 | 23.93 | - | -23.93 | -0.91 |
| 草地 | 20.78 | 125.77 | 104.99 | 3.98 |
| 水体 | 2383.46 | 1187.70 | -1195.76 | -45.31 |
| 建设用地 | 116.77 | 313.29 | 196.52 | 7.45 |
| 未利用地 | 94.21 | 923.70 | 829.49 | 31.43 |
| 林地 | - | 88.70 | 88.70 | 3.36 |
| 岸线长度/km | 5.04 | 10.84 | 5.80 | |
| 总面积 | 2639.16 | |||
Tab.6 The score of impact factor of coastline resource表6 影响因子得分情况 |
| 影响因子 | 天津中心渔港情况 | 得分 |
|---|---|---|
| 水文条件 | 岸线属于侵蚀性岸段,岸线较不稳定 | 2 |
| 海洋水质条件 | 工程海域属于国家四类海水水质标准(中度污染) | 2 |
| 岸线长度 | 占用岸线长度为2.46 km | 4 |
| 陆域生态环境 | 陆域环境质量属于二类 | 4 |
| 水深条件 | 等深线3~5 m | 1 |
| 海岸类型 | 岸线属于沙砾质海岸 | 4 |
| 航道、锚地条件 | 工程所在区域可供5000 t船舶停靠 | 2 |
| 道路通达度 | 工程区附近有公路,铁路,机场 | 5 |
| 陆域宽度 | 陆域浅滩纵向约3500 m | 5 |
| 产业配套设施完备度 | 通信,医疗,水电基本满足需求 | 3 |
| 开发现状 | 属于天津岸线开发重点项目 | 5 |
Tab.7 The calculation results of impact factors表7 评价指标计算结果 |
| 影响因子 | 计算公式 | 计算值 | 结果 |
|---|---|---|---|
| 岸线利用率 | 已使用岸线长度/规划的岸线长度 | 2.46 /2.46 | 1.0000 |
| 围填海面积开发强度 | 围填海建设面积/围填海总面积 | 527.76 /1451.46 | 0.3636 |
| 新增码头岸线长度比率 | 新增岸线长度/岸线总长度 | 8.26 /10.84 | 0.7620 |
| 固定资产投入产出比率 | 年平均收益总额/固定年投资额 | 5.57/33.75 | 0.1651 |
| 货物吞吐量强度 | 货物吞吐量/规划的岸线长度 | 1700/2.46 | 0.2600* |
注:*表示正规化的指标值 |
Tab.8 The score of the evaluation of coastline resource表8 岸线资源评价得分情况 |
| 指标 | 得分 | 影响因子 | 得分 |
|---|---|---|---|
| 自然环境条件 | 0.6540 | 水文条件 | 0.2334 |
| 海洋水质条件 | 0.2366 | ||
| 岸线长度 | 0.3156 | ||
| 陆域生态环境 | 0.8820 | ||
| 水深条件 | 0.3574 | ||
| 海岸类型 | 0.4328 | ||
| 海域通航条件 | 0.2102 | 航道、锚地条件 | 2.0000 |
| 陆域集疏条件 | 0.8465 | 道路通达度 | 5.0000 |
| 陆域宽度 | 0.4302 | 陆域宽度 | 5.0000 |
| 社会经济条件 | 0.8630 | 产业配套设施完备度 | 1.3650 |
| 开发现状 | 2.7250 | ||
| 综合得分 | 3.004 | ||
Tab.9 The score of the evaluation of intensive coastline utilization表9 岸线集约利用评价得分情况 |
| 指标 | 得分 | 影响因子 | 得分 |
|---|---|---|---|
| 岸线利用状况 | 0.1611 | 岸线利用率 | 0.3325 |
| 围填海面积开发强度 | 0.1471 | ||
| 新增码头岸线长度比率 | 0.2002 | ||
| 岸线投入产出水平 | 0.0565 | 固定资产投入产出比率 | 0.1651 |
| 岸线运营强度 | 0.1095 | 货物吞吐量强度 | 0.2600 |
| 综合得分 | 0.3271 | ||
The authors have declared that no competing interests exist.
| [1] |
|
| [2] |
[
|
| [3] |
|
| [4] |
[
|
| [5] |
[
|
| [6] |
|
| [7] |
[
|
| [8] |
|
| [9] |
|
| [10] |
|
| [11] |
|
| [12] |
|
| [13] |
|
| [14] |
|
| [15] |
|
| [16] |
|
| [17] |
|
| [18] |
|
| [19] |
|
| [20] |
|
| [21] |
[
|
| [22] |
[
|
| [23] |
[
|
| [24] |
|
| [25] |
|
| [26] |
|
| [27] |
|
/
| 〈 |
|
〉 |