Orginal Article

The Prediction of Beijing Urban Growth Boundary

  • HU Yecui , 1, 2, * ,
  • FU Ling 1 ,
  • LI Qi 1
Expand
  • 1. Department of Land Science and Technology, China University of Geosciences, Beijing 100083, China
  • 2. Key Lab of Land Consolidation and Rehabilitation, the Ministry of Land and Resources, Beijing 100035, China
*Corresponding author: HU Yecui, E-mail:

Received date: 2016-06-21

  Request revised date: 2016-08-16

  Online published: 2017-04-20

Copyright

《地球信息科学学报》编辑部 所有

Abstract

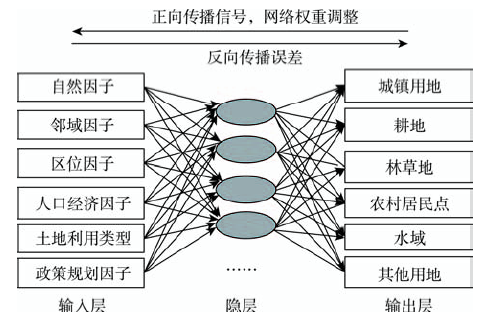
Urban growth boundary (UGB) is an effective tool to control urban sprawl. China has carried out the UGB delineation for 14 cities since 2014. UGB includes rigid boundary and elastic boundary. The rigid boundary is an external constraint line and the elastic boundary is the developing line of the interior. In this study, from the angle of the urban endogenous development motivation, we selected 6 types of influence factors such as nature, population economy, location, neighborhood, land use type and policy planning, totally 18 factors. We tried to use genetic algorithms, CA and BP neural network to establish the UGB model to define Beijing elastic boundary. From the angle of ecological carrying capacity of land, we selected terrain, topography, parks and water, land use status, urban land distance and nature reserves as the influence factors and we tried to use construction land suitability evaluation method to define Beijing rigid boundary. The results show that by using our urban growth boundary model to predict Beijing elastic urban growth boundary, the percent area match was 96%, kappa value is 0.812, the UGB Model accuracy is good and the prediction area of Beijing elastic UGB is 1738.98 square kilometers. Through the suitability evaluation, the rigid boundary area is 3297.01 square kilometers.

Cite this article

HU Yecui , FU Ling , LI Qi . The Prediction of Beijing Urban Growth Boundary[J]. Journal of Geo-information Science, 2017 , 19(4) : 486 -492 . DOI: 10.3724/SP.J.1047.2017.00486

1 引言

中国人口城市化率由1978年的17.92%增加到2015年的54.77%,随着城市人口的增多城市空间迅速扩张,与规划相悖的增长形态在各大城市显现[1]。城市增长边界(UGB)能有效抑制城市无序蔓延,被多个国家应用,比较突出的是波兰特[2]。该城市自1975年划定UGB以来,人口增加了50%,但新增建设用地仅增长2%,UGB边界内的城市土地开发得到有效控制。
与国外相比,中国城市增长边界的应用较少。2006年4月实施的《城市规划编制办法》中对城市总体规划纲要首次提出划定城市增长边界的要求“提出禁建区、限建区、适建区范围,并要求研究中心城区空间增长边界”。2014年,《国家新型城镇化规划(2014-2020年)》指出要合理确定城市规模、开发边界。北京、上海、武汉等14个城市选为城市开发边界试点城市,并推动未来全国600多个城市UGB的划定及实施管理。目前关于UGB尚未有统一的定义,本文将其定义为:以防止城市无序蔓延和保护土地资源为目的,而划定的允许城市建设用地扩张的最大边界,包括刚性和弹性2种边界。刚性边界是外部的约束线,不能超越这条界线进行城市开发;弹性边界则是内部所需要的发展线,边界外不允许城市开发建设,但遇特殊情况可适当调整。
关于UGB的划定方法,国内外开展了较为广泛的研究,如基于土地生态适宜性的评价方法,从土地是否适宜建设角度来划定刚性UGB和弹性UGB[3-7]。龙瀛等采用元胞自动机模型,通过元胞行为控制因子预测城市扩张划定UGB[8-10]。Tayyebi等采用城市增长径向距离法,选定城市的多个中心点,以距离为测度建立预测模型,模拟城市边界变化位置,划定伊朗德黑兰UGB[11-12]。Arsanjani运用智能体模型、Nemmour等运用矢量支撑机模拟城市扩张,划定城市增长边界[13-14]。周锐等基于生态安全格局,利用最小阻力模型划定城镇增长的刚性边界与弹性边界[15]。从各种方法来看,土地生态适宜性评价方法最简单,但其缺乏对城市内生发展动力因素的分析,其他模型方法对城市内生发展动力考虑周全,但欠缺对土地生态适宜性方面的考虑。基于此,本文将改进的遗传神经网络(GANN)和元胞自动机模型(CA)充分结合,同时纳入土地生态适宜性评价,进行北京市弹性UGB和刚性UGB的预测研究。

2 数据与方法

2.1 研究区概况

北京位于华北平原西北隅,总面积164.11 万hm2,是中国的政治、文化、国际交往和科技创新中心。随着人口与经济的增长,北京城市建成区的面积不断向外围呈圈层式扩展。根据中国城市统计年鉴,2000-2010年北京城市建成区面积增加696 km2,到2013年已达1306 km2。划定城市增长边界,实现北京城市用地的高效合理利用刻不容缓。

2.2 基础数据

本研究采用的数据主要有:① 2005年北京市Landsat5 TM遥感影像和2015年北京市Landsat8 OLI遥感影像,影像数据均来自USGS网站;② 北京市交通道路图,由2006年的1:10 000航空摄影图得到,并以2015年的Landsat8 OLI影像进行补充完善;③ 北京市DEM图,从地理空间数据云网站下载;④ 2005年和2015年北京市各区常住人口数据和常住各区GDP数据,均来自各区统计局网站。

2.3 UGB模型构建

本研究基于GANN和CA建立城市增长边界预测模型,其中的GANN是遗传算法改进BP神经网络所得到的遗传神经网络。
2.3.1 遗传神经网络
BP神经网络以误差反向传播方式来不断调整网络权值和阈值,从而最大限度的逼近复杂系统。遗传算法则通过模拟自然进化过程来搜索最优解。BP神经网络存在学习速度慢,容易出现过度拟合等缺点。利用遗传算法不易陷于局部最优的优点,改进BP神经网络方法,能够使BP神经网络得到更好的初始权值及阈值。遗传神经网络包括结构确定、GA改进及网络预测。结构确定是依据输入及输出的参数确定网络结构。GA改进是按一定的方式对GA的个体赋予权值及阈值,经过一系列选择、交叉等,得到有最好适应度值的个体,达到改进BP神经网络权值及阈值的目的。网络预测是使用GA改进后得到的权值及阈值,对输入的样本数据进行训练,之后输入预测数据进行预测。
2.3.2 GANN与CA结合
CA模型充分考虑了地理现象在空间上的相互作用和时间上的因果关系,能够较好的模拟城市扩张过程[16]。CA模型模拟土地利用变化主要包括确定元胞状态、输入邻域影响因子和确定地类转换规则。转换规则为神经网络结构中的输出层,通过神经网络预测可以得到各类用地的转换概率,即转换规则。CA模型的关键技术和难点就是如何提高土地利用转换规则的准确性[17]。本研究将遗传神经网络嵌入CA模型,自动获得和校验CA模型的转换参数,能够更好地模拟复杂系统,提高模拟精度。
2.3.3 影响因素的选择
城市增长边界的规模和空间布局受自然、社会、经济及政策等多重因素的影响。本文结合数据的可获得性、CA与GANN模型的适用性,选取了影响北京市城市扩张的6类18个影响因子,包括海拔、坡度和坡向等自然因素;地区GDP、人口密度、到道路的距离、到铁路的距离、到绿地的距离、到建筑物的距离及到行政中心的距离等社会经济因素和土地利用类型因素;《北京市限建区规划(2006­2020年)》、2015年《京津冀协同发展规划纲要》及2015年《北京市城市总体规划(2004­2020年)》修改框架等政策因素; 邻域因素,包括邻近城镇用地、林草地、农村居民点、耕地、水域和其他用地的单元数。
2.3.4 UGB模型设计
在整个UGB模型中,遗传神经网络部分直接通过编程实现,而遗传神经网络和CA模型的结合是将CA模型直接设计在遗传神经网络中,并由其得到土地转换规则,所以最终整个UGB模型是基于BP神经网络进行的。其中,BP神经网络结构采用matlab2012b开发,并分为3层:① 输入层,有18个神经元,对应影响UGB的6类影响因子,共18个预测变量;② 隐含层,有25个神经元,选择tansig()函数作为传递函数;③ 输出层,由6个神经元组成,对应的是6种地类,分别是城镇用地、耕地、林草地、农村居民点、水域、其他用地,传递函数选择logsig()函数。具体结构如图1所示。
Fig. 1 The network structure of the model

图1 模型网络结构

整个UGB模型主要包括3个阶段:训练、精度检验及预测。模型训练阶段输入2005年18个影响因子及2015年土地利用现状数据,其中影响因子数据作为输入层数据,利用一定的计算来调节节点间的权重,不断减小期望输出和实际输出的均方误差,最终达到目标均方误差,使预测结果无限逼近2015年土地利用现状数据。精度检验阶段是用面积匹配值法和Kappa系数法分别从数量和空间上对模型模拟结果进行准确度检验。模型预测阶段,需要输入2015年18个影响因子的ASCII数据,利用已经训练好的网络,预测2025年土地利用状况,从而划定城市UGB。

2.4 建设用地适宜性评价

选取坡度、高程、公园水面、自然保护区等6个主要评价因子,将北京市的建设用地适宜性划分为很适宜、适宜、较不适宜和不适宜4个等级,利用层次分析法确定因子权重,适宜性评价影响因子及其权重如表1所示。
Tab. 1 The factor and weight of construction land suitability evaluation

表1 建设用地适宜性评价因子及权重

因子 适宜级别 分类条件 单因子得分 权重
坡度/° 不适宜 ≥25 1
较不适宜 15~25 2 0.21
适宜 5~15 3
很适宜 0~5 4
高程/m 不适宜 ≥1000 1
较不适宜 500~1000 2 0.11
适宜 100~400 3
很适宜 0~100 4
公园水面/m 不适宜 0~200 1
较不适宜 200~500 2 0.13
适宜 500~1000 3
很适宜 >1000 4
土地利用现状 不适宜 耕地、水域 1
较不适宜 林草地 2 0.23
适宜 其他用地 3
很适宜 城镇用地、农村居民点 4
自然保护区/m 不适宜 0~500 1
较不适宜 500~800 2 0.07
适宜 800~1000 3
很适宜 >1000 4
城镇用地/m 不适宜 >3000 1
较不适宜 2000~3000 2 0.25
适宜 1000~2000 3
很适宜 0~1000 4

3 结果分析

3.1 UGB模型精度检验结果

3.1.1 面积匹配值法
面积匹配值是指各种面积范围的单元在某一单元总数中各自所占的比例的多少。本文用该值来评估UGBM模型的预测精度,具体公式如式(1)所示。
P = 预测改变面积 实际改变面积 × 100 % (1)
预测改变面积指根据UGBM模型模拟的2015年北京市及其在各个方向上预测得到的城镇用地面积;实际改变面积指根据土地利用现状图提取出的北京市及其在各个方向上城镇用地面积。由表2可看出,在西北和西南方向上,模型预测改变的城镇用地面积少于实际城镇用地面积的变化量,面积匹配值分别为87%和93%。东南方向上则恰好相反,模型预测改变的城镇用地面积多于实际城镇用地面积的变化量,匹配值为102%。在东北方向上,模型预测结果较好,面积匹配值达100%。从整个北京市来看,面积匹配值为96%,模型运行精度较高。
Tab. 2 Area matching values for different directions

表2 方向上的面积匹配值

方向 范围/° 预测2015年改变面积/km2 实际2015年改变面积/km2 面积匹配值/%
东北 0~0 89.37 89.26 100
西北 90~180 87.29 100.18 87
西南 180~270 87.10 93.38 93
东南 270~360 100.72 98.53 102
全部 0~360 364.48 381.35 96
3.1.2 Kappa系数法
Kappa系数常用于检测空间分析模型对土地利用的模拟精度[23],当Kappa系数≥0.75时,说明模型模拟精度较高。本文模拟得到的Kappa指数为0.812,说明2015年模型模拟的土地利用情景与实际土地利用现状具有高度一致性,模型空间模拟效果较好。

3.2 UGB模型预测结果

在进行UGB模型训练时,先用遗传算法得到最优的种群个体,然后将其对应的权值和阈值赋予神经网络进行训练,当误差降低到0.0012时停止训练,网络结构达到最佳权值和阈值并具有了联想记忆和预测能力。在此基础上,将2015年的数据集输入到模型中进行2025年UGB预测,得到2025年的北京市土地利用预测结果图(图2)。
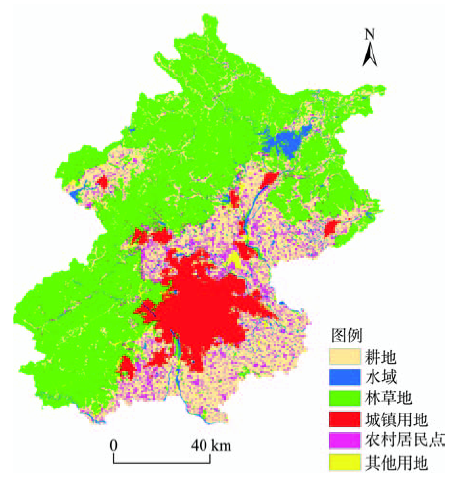
Fig. 2 The predicted land-use map of Beijing in 2025

图2 预测2025年北京市土地利用类型图

3.3 建设用地适宜性评价结果

将北京市土地进行220 m×220 m的网格重采样,直接利用ArcGIS软件叠加适宜性评价选取的坡度、高程等6类建设用地适宜性评价因子图,得到各网格分值。根据网格分值,剔除公园水域、自然保护区等不适宜的建设用地,利用重分类工具,结合GIS空间分析技术,得到北京市建设用地适宜性等级空间分布图(图3)。统计结果表明(表3),北京市限制建设区占到全市土地总面积的一半以上,如果再加上禁止建设区,不适宜建设的土地面积达70.65%。适宜建设区和比较适宜建设区仅占14.63%、14.72%,整体适宜区占比面积小。
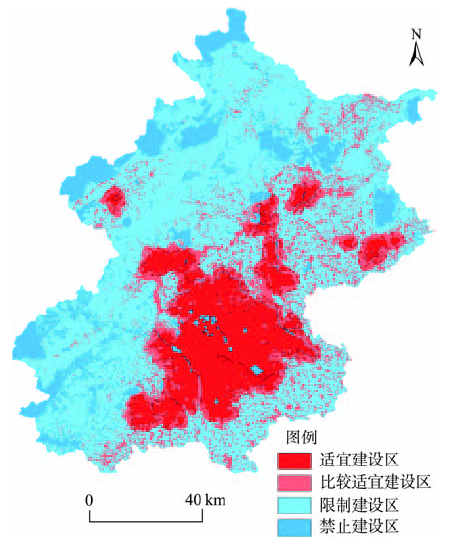
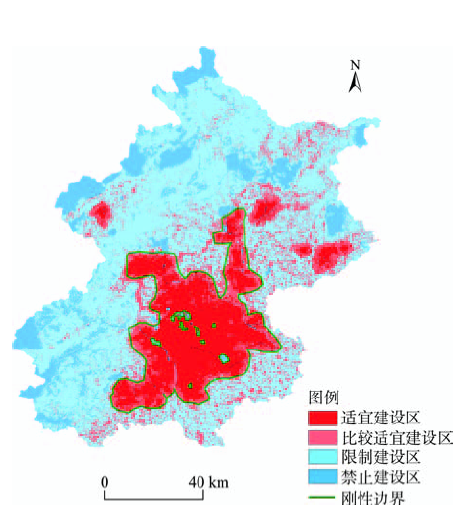
Fig. 3 The results of suitability evaluation of construction land

图3 建设用地适宜性评价结果

Tab. 3 The classification of suitability evaluation results

表3 适宜性评价结果分类表

适宜度评价 分值 面积/km2 占总量比值/%
适宜建设区 3.3-4.0 2395.36 14.63
比较适宜建设区 2.6-3.3 2410.45 14.72
限制建设区 2.1-2.6 8486.93 51.83
禁止建设区 1.1-2.1 3081.56 18.82

3.4 北京市UGB划定

3.4.1 弹性UGB划定
根据2025年土地利用情景模拟图,将主城区最大连片城镇用地划出,作为北京市弹性UGB(图4),总面积1738.98 km2。从图中可看出,2005、2015和2025年3个时期的UGB弹性边界内均包含了城6区及昌平、房山和门头沟部分区域。未来北京市城市扩张将继续沿中心城区向四周扩展,但南部区域方向上的扩展速度明显较西北方向剧烈,尤其是通州、朝阳、大兴和房山等区域扩张最明显。
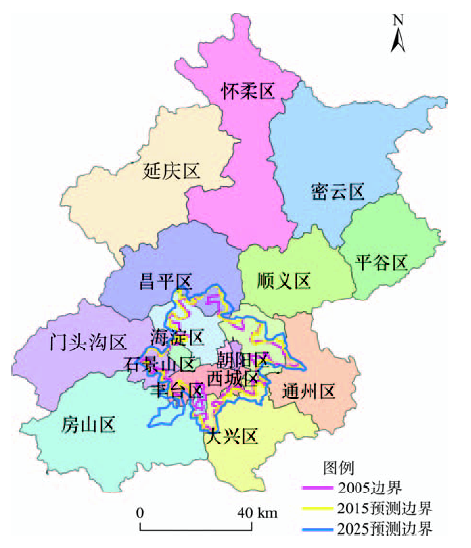
Fig. 4 The elastic boundary extension situation of Beijing

图4 北京市弹性边界扩张情况图

由3期边界内各区的面积(表4)统计结果可知,2005年至2015年,大兴、通州和朝阳城市扩张面积最明显,分别为60.93、55.21和51.59 km2。这与《北京城市总体规划2004-2020》明确要重点发展通州区、亦庄新城区,并将通州发展为北京城市副中心,承担中心城区人口和职能疏解及新的产业聚集区密切相关。2015-2025年,除房山外,通州区城市扩张面积最多,为43.22 km2,主要是通州区城市副中心职能的发展,政府搬迁、建设用地需求急剧增长导致,整体看模型预测结果与实际情况相符。
Tab. 4 The change of each district area in Beijing elastic boundaries (km2)

表4 北京市弹性边界内各区面积变化表(km2

年份 丰台区 石景山区 通州区 朝阳区 海淀区 昌平区 大兴区 房山区 门头沟区
2005
2015
2025
188.43
222.85
238.30
60.99
64.80
66.37
77.32
132.53
175.75
318.43
370.02
406.05
195.66
220.43
253.04
88.80
129.78
153.34
137.51
198.44
232.90
4.82
6.93
76.36
34.50
41.44
50.77
3.4.2 刚性UGB划定
生态限建要素的存在增加了刚性UGB的性能,使得其成为城市扩张的“生态安全底线”,在城市开发过程中设置为最大土地容量界限。除去国家重大建设项目之外,未来城市发展都要控制在最大容量范围内。外界范围内可以适当设立自然保护区、森林公园、生态隔离带等以保护土地资源为目的的生态保护区域。对于北京市刚性边界的划分,可以将区域范围进行建设用地适宜性评价,将主城区的比较适宜和适宜建设区较大区域划在一起,形成其刚性UGB边界。如图5所示,该边界内包含了城六区,通州、房山、大兴、顺义、昌平和门头沟大部分地区,以及怀柔和密云的部分地区,总面积3297.01 km2
Fig. 5 Beijing urban growth rigid boundary

图5 北京市刚性边界图

4 结论

2050年,我国的城镇化率将达到70%,70%的城镇化率意味着未来平均每年建设用地增长率要达到1%。城市开发活动将进一步加速城市空间的扩张。城市增长边界的划分对于合理引导城市扩张,保护生态环境,促进土地节约集约利用等方面,有着不可忽视的作用。
基于UGB模型和数据的可获得性,本文选定了自然、人口经济、区位、邻域、土地利用类型和政策规划6类因素18个因子,结合土地生态适宜性评价结果,预测北京市2025年城市增长边界。研究结果表明,2025年北京市弹性UGB总面积为1738.98 km2,刚性UGB总面积为3297.01 km2,北京市城市扩张明显,尤其是通州区,城市扩张面积达43.22 km2
实验表明,本文设计的基于GANN-CA模型的UGB划定方法对确定城市未来扩展方向有较好的指导意义,规划部门可根据划定结果,结合实际情况和政策需求,指导城市规划和土地利用总体规划编制。但本模型仍存在不足之处:① 本研究的GANN-CA模型只能引入较片面的政策规划因子,尚不能将更多的相关影响因素引入;② 在进行建设用地适宜性评价时,选取的评价因子还不够全面,评价方法仍需进一步优化;③ 选择的判断模型精度的方法仍显粗糙,只能从四个方向进行判断,尚不能深入评估模型模拟过程的精准度。同时,本文还需对未来城市增长边界的稳定状态进行评价,从划定、实施、管理及评价一体化出发,建立全套的UGB评判框架体系,以便引入到实践当中。

The authors have declared that no competing interests exist.

[1]
龙瀛,韩昊英,赖世刚. 城市增长边界实施评估:分析框架及其在北京的应用[J]. 城市规划学刊,2015(1):93-100.在对中国城市规划体系和城市开发实际过程分析的基础上,基于Hopkins(2012)的研究提出了一套针对中国城市的UGBs实施评估的分析框架,包括总规UGBs、控规UGBs、规划许可、实际开发这些环节之间的一致性(conformance)和绩效(performance).现将该分析框架应用于北京,利用北京2004版总规的UGBs、后续批复的一系列控规UGBs、发放的建设用地规划许可证(用地证)、利用遥感和人工手段观测到的城市开发数据(城市扩张即增量开发、城市更新即存量开发),对UGBs进行了系统深入的评估工作.评估结果显示:①控规与总规相比,UGBs有较大扩张;②控规与规划许可的一致性程度较高;③规划许可与UGBs对实际开发的有限控制力度主要体现在没有规划许可的非正式开发.

DOI

[Long Y, Han H Y, Lai S G. Implementation evaluation of urban growth boundaries: An analytical framework for China and a case study of Beijing[J]. Urban Planning Forum, 2015(1):93-100. ]

[2]
张润朋,周春山.美国城市增长边界研究进展与评述[J].规划师,2010,26(11):89-96.城市增长边界是西方国家应对城市蔓延问题提出的一种技术解决措施和空间政策响应,当前已成为 美国控制城市蔓延发展最成功的一种技术手段和政策工具。通过对美国城市增长边界研究进展的综述分析,从设置动因、影响研究(积极效应、负面影响)、实施管 理(成功实施的因素、修正的方法)等方面,揭示了增长边界的技术理念和方法。在此分析基础上,规划师应从城市增长边界在我国的适应性、划定方法与思路、现 行规划管理体系的限制方面思考该技术在我国的有效运用。

DOI

[Zhang R P, Zhou C S.Urban growth boundary research in America[J]. Planners, 2010,26(11):89-96. ]

[3]
祝仲文,莫滨,谢芙蓉.基于土地生态适宜性评价的城市空间增长边界划定——以防城港市为例[J].规划师, 2009,25(11):40-44.2006年颁布实施的《城市规划编制办法》明确要求研究中心城区空间增长边界,用以限制城市发展规模和划定城市建设范围,但当前国内尚未有成熟和统一的划定方法。防城港市尝试采用土地生态适宜性评价的方法,结合层次分析法确定评价因子的权重,运用GIS技术对规划范围区内的土地生态适宜程度进行分析,依据分析结果划定中心城建设用地的刚性增长边界和弹性增长边界,并提出相应的空间管制对策。

DOI

[Zhu Z W, Mo B, Xie F R.Delimitation of urban growth boundary based on landecological suitability evaluation: A case of Fangchenggang[J]. Planners, 2009,25(11):40-44. ]

[4]
蒋玮. 成都市中心城区城市空间增长边界研究[D].成都:西南交通大学,2012.

[Jiang W.Research on urban growth boundary of the Centre area in Chengdu[D]. Chengdu: Southwest Jiaotong University, 2012. ]

[5]
王玉国,尹小玲,李贵才.基于土地生态适宜性评价的城市空间增长边界划定——以深汕特别合作区为例[J].城市发展研究,2012,19(11):76-82.城市增长边界(Urban Growth Boundary,简称UGB)调控空间的规划理念,被视为控制城市蔓延、实现城市精明增长的空间管理工具.2006年由建设部颁布实施的《城市规划实施 编制办法》明确要求制定城市总体规划过程中研究和划定中心城区空间增长边界,当前国内尚未形成成熟和统一的划定方法.在研究深汕特别合作区的土地利用时, 尝试采用土地生态适宜性评价的方法,构建生态适宜性评价指标体系,采用层次分析法确定因子权重,以GIS技术为基础,对规划范围区内的土地生态适宜程度进 行分析,进而划定城市建设用地的刚性增长边界和弹性增长边界,并提出相应的空间管制对策.

DOI

[Wang Y G, Yin X L, Li G C.Delimitation of urbangrowth boundary based on land ecological suitability evaluation: A case of Shenshan special corporation zone[J]. Urban Studies, 2012,19(11):76-82. ]

[6]
李旭锋. 哈尔滨城市空间增长边界设定研究[D].哈尔滨:哈尔滨工业大学,2010.

[Li X F.The research on setting of Harbin urban growth boundaries[D]. Harbin: Harbin Institute of Technology, 2010. ]

[7]
吴小平,陈志江,贾成义,等. 县级城市中心城区增长边界划定思路与策略——海南省白沙黎族自治县中心城区案例[J]. 规划师,2015(9):126-132.随着我国城镇化进程的快速推进,城市用地不断扩张,随之而来的各种城市病也日益凸显。城市增长边界作为一种有助于控制城市蔓延的技术手段和政策,从西方国家引入我国。其在我国的应用尝试较晚,尤其对县级城市中心城区增长边界的研究还比较少。因此,文章以海南省白沙黎族自治县中心城区增长边界的探索为例,确定城市增长规模和发展方向,探索中心城区增长边界的大致范围,再根据中心城区的具体要素,划定中心城区的"刚性"和"弹性"边界,探索县级城市中心城区增长边界的划定方法,明确城市空间发展格局,控制城市蔓延。

DOI

[Wu X P, Chen Z J, Jia C Y, et al. Urban growth boundary of county level towns:Baisha Li ethnic minority county[J]. Planners, 2015(9):126-132. ]

[8]
苏伟忠,杨桂山,陈爽,等.城市增长边界分析方法研究——以长江三角洲常州市为例[J].自然资源学报,2012,27(2):322-331.诸多国家已采取城市增长边界(Urban growth boundary, UGB)对策以抑制城市蔓延,我国目前城市与土地利用规划也明确要求划定UGB,但其分析方法研究还较薄弱。综合系统动力学模型、元胞自动机及城市承载力分析研究常州市区UGB,结果表明:预测到2020年常州市区城市建设用地面积为30 847 hm<sup>2</sup>北部和南部组团外延增长、主城区及南北组团内部填充同步发展,UGB由沿江&mdash;德胜河&mdash;沪宁高速&mdash;新孟河&mdash;德胜河&mdash;武宜运河&mdash;沿江高速&mdash;沪宁高速&mdash;市域界限等围合而成;模型预测的UGB与GH-UGB(实际规划UGB)北部和东部空间拟合良好,西部和南部拟合较差,表明模型预测对空间整体和要素联系考虑不足,而用地规模偏差则表明模型预测更为客观;UGB分析方法在政策、空间规划理念和整体格局上有待完善。

DOI

[Su W Z, Yang G S, Chen S, et al.Analysis method of urban growth boundary of the Changzhou city in the Yangtze river delta[J]. Journal of Natural Resources, 2012,27(2):322-331. ]

[9]
徐康,吴绍华,陈东湘,等.基于水文效应的城市增长边界的确定——以镇江新民洲为例[J].地理科学,2013,33(8):979-985.<p>城市增长边界(UGB)是城市增长管理、控制城市无序蔓延的重要工具,但如何科学定量划定城市增长边界一直是一个技术难题。针对目前城市增长边界定量划定研究的不足,提出一种基于城市水文效应,适用于城市内涝易发区的城市增长边界划定方法。该方法整合了元胞自动机(CA)模型与区域水文模型(SCS),通过CA模型预测城市不透水面积的扩张范围与形态,并以此作为城市水文模型的参数,评估城市淹水面积的比例及风险,最后根据风险水平确定城市增长边界。以镇江新民洲为例,实证研究了该地区的城市增长边界的合理划定,研究发现该区域城市扩张规模控制500 hm<sup>2</sup>之内,城市在最大降雨条件下城市积水面积的风险水平能有效降低。研究结果可为新民洲的水文风险控制及城市规划提供依据,同时可为其他城市增长边界划定提供方法参考。</p>

[Xu K, Wu S H, Chen D X, et al.The urban growth boundary determination based on hydrology effect: Taking Xinminzhou as an example[J]. Scientia Geographica Sinica, 2013,33(8):979-985. ]

[10]
龙瀛,韩昊英,毛其智.利用约束性CA制定城市增长边界[J].地理学报,2009,64(8):999-1008.lt;p>作为控制城市蔓延的重要工具之一,城市增长边界(UGBs)已经在国际学术界得到了广泛的关注和研究。从控制机制来看,由于规划城镇建设用地边界具有控制城市增长的法律地位,与西方国家的UGBs较为相似,因而可以被视为中国特有的一种UGBs。该边界的制定在我国经过了长期的实践,然而以往的方法往往缺乏充分的科学依据。因此,本文提出一种基于约束性元胞自动机来制定城市增长边界的方法,该方法考虑了城市发展的综合因素,能够较为客观、全面地反映城市增长的时空动态变化过程,并能体现众多城市发展政策的影响效果。利用约束性元胞自动机模型,以北京市域为研究区域,制定了中心城、新城和乡镇三个层次的UGBs。实证分析表明,利用该方法与传统方法所制定的UGBs存在一定的差异,因此在拟定新的UGBs或改进现有的UGBs过程中,应当充分考虑这一情况,参考该方法的模拟结果建立更为科学合理的UGBs。</p>

DOI

[Long Y, Han H Y, Mao Q Z.Establishing urban growth boundaries using constrained CA[J]. Journal of Geographical Sciences, 2009,64(8):999-1008. ]

[11]
Tayyebi A, Pijanowski B C, Pekin B.Two rule-based urban growth boundary models applied to the Tehran Metropolitan Area, Iran[J]. Applied Geography, 2011,31(3):908-918.Urban Growth Boundaries (UGBs) that limit urban expansion out are being implemented by planning agencies worldwide. Thus, there is a need to create models that can simulate changes in urban boundaries. The aim of this paper is to present two rule-based spatial-temporal models, one which employs a Distance Dependent Method (DDM) and the other a Distance Independent Method (DIM), to simulate UGBs. These rule-based Urban Growth Boundary Models (UGBMs) use azimuths and distances, vector-based predictive variables, directed from central points within the urban area, to simulate UGB change. DDM employs a single urban boundary in the initial time step to predict the urban boundary in any subsequent time according to the increment of distances across different azimuths. Similarly, the DIM uses the change in distance between two boundaries, one in the initial time step and one in subsequent time step, across different azimuths, to predict the future urban boundary. We use the two rule-based models, DDM and DIM, to project the urban boundary of the Tehran Metropolitan Area in 2012 using data from 1988 to 2000. We compare these rule-based simulation UGBMs to a null UGBM developed from the same data but lacking in specificity of predictive variables. Percent Area Match (PAM) quantity and location goodness of fit metrics are used to assess the agreement between simulated and observed urban boundaries. Results indicate that rule-based UGBMs have a better goodness of fit compared to a null UGBM using PAM quantity and location goodness of fit metrics. We discuss how UGBMs can be used to assist planners in developing future UGBs. (C) 2011 Elsevier Ltd. All rights reserved.

DOI

[12]
石伟伟. 武汉市城市发展边界的设定研究[D].武汉:华中农业大学,2008.

[Shi W W.A study on setting of the urban growth boundary of Wuhan city[D]. Wuhan: Huazhong Agricultural University, 2008. ]

[13]
Arsanjani J J, Helbich M, Vaz E D N. Spatiotemporal simulation of urban growth patterns using agent-based modeling: The case of Tehran[J]. Cities, 2013,32(4):33-42.Rapid urban growth is becoming a serious problem in most developing countries. Tehran, the capital of Iran, stands out as a vibrant metropolitan area, facing uncontrolled urban expansion. Public authorities and decision makers require planning criteria regarding possible spatial developments. To monitor past developmental trends and to simulate emerging spatiotemporal patterns of urban growth, this research applies a geosimulation approach that couples agent-based modeling with multicriteria analysis (MCA) for the period between 1986 and 2006. To model the major determinants controlling urban development, three agent groups are defined, namely developer agents, government agents, and resident agents. The behaviors of each agent group are identified by qualitative surveys and are considered separately using multi-criteria analysis. The interactions of the agents are then combined through overlay functions within a Geographic Information System (GIS). This analysis results in the creation of a propensity surface of growth that is able to identify the most probable sites for urban development. Subsequently, a Markov Chain Model (MCM) and a concise statistical extrapolation are used to determine the amount of probable future expansion in Tehran. For validation purposes, the model is estimated using 2011 data and then validated based on actual urban expansion. Given the accurate predictions of the Markov Chain Model, further predictions were carried out for 2016 and 2026. This simulation provides strong evidence that during the next decade planning authorities will have to cope with continuous as well as heterogeneously distributed urban growth. Both the monitoring of growth and simulation revealed significant developments in the northwestern part of Tehran, continuing toward the south along the interchange networks.

DOI

[14]
Nemmour H, Chibani Y.Multiple support vector machines for land cover change detection: An application for mapping urban extensions[J]. Isprs Journal of Photogrammetry & Remote Sensing, 2006, 61(2):125-133.The reliability of support vector machines for classifying hyper-spectral images of remote sensing has been proven in various studies. In this paper, we investigate their applicability for land cover change detection. First, SVM-based change detection is presented and performed for mapping urban growth in the Algerian capital. Different performance indicators, as well as a comparison with artificial neural networks, are used to support our experimental analysis. In a second step, a combination framework is proposed to improve change detection accuracy. Two combination rules, namely, Fuzzy Integral and Attractor Dynamics, are implemented and evaluated with respect to individual SVMs. Recognition rates achieved by individual SVMs, compared to neural networks, confirm their efficiency for land cover change detection. Furthermore, the relevance of SVM combination is highlighted.

DOI

[15]
周锐,王新军,苏海龙,等. 基于生态安全格局的城市增长边界划定——以平顶山新区为例[J]. 城市规划学刊,2014(4):57-63.基于景观安全格局理论和GIS空间技术,构建了水资源安全、地质灾害规避、生物多样性保护和游憩资源安全4种关键性单一生态过程的安全格局,并整合叠加形成不同安全水平的综合生态安全格局。随后,以综合生态安全格局为城镇增长的阻力因子,并结合城镇中心吸引力、道路吸引力、邻域开发强度等动力因子,利用最小阻力模型对城镇建设用地增长进行模拟预测,进而划定了城镇增长的刚性边界与弹性边界。结果表明:首先,高、中、低三种安全水平下,生态系统的连通性和完整性逐级下降,适宜的建设用地规模依次为108.69km~2、135.43km~2、153.72km~2;其次,基于生态安全格局的城市增长边界划定方法,指明了维护城市生态安全和基本生态系统服务的底线安全格局,有效地限制了城市无序蔓延,并引导城市呈组团式紧凑发展。

DOI

[Zhou R, Wang X J, Su H L. Delimitation of urban growth boundary based on ecological security pattern: A case of Pingding new district[J]. Urban Planning Forum, 2014(4):57-63. ]

[16]
Hu Y, Zheng Y, Zheng X.Simulation of land-use scenarios for Beijing using CLUE-S and Markov composite models[J]. Chinese Geographical Science, 2013,23(1):92-100.This study investigated and simulated land use patterns in Beijing for the year 2000 and the year 2005 from the actual land use data for the year 1995 and the year 2000, respectively, by combining spatial land allocation simulation using the CLUE-S model, and numerical land demand prediction using the Markov model. The simulations for 2000 and 2005 were confirmed to be generally accurate using Kappa indices. Then the land-use scenarios for Beijing in 2015 were simulated assuming two modes of development: 1) urban development following existing trends; and 2) under a strict farmland control. The simulations suggested that under either mode, urbanized areas would expand at the expense of land for other uses. This expansion was predicted to dominate the land-use conversions between 2005 and 2015, and was expected to be accompanied by an extensive loss of farmland. The key susceptible to land-use changes were found to be located at the central urban Beijing and the surrounding regions including Yanqing County, Changping District and Fangshan District. Also, the simulations predicted a considerable expansion of urban/suburban areas in the mountainous regions of Beijing, suggesting a need for priority monitoring and protection.

DOI

[17]
Yang X, Zheng X Q, Chen R.A land use change model: Integrating landscape pattern indexes and Markov-CA[J]. Ecological Modeling, 2014,283(7):1-7.Landscape pattern indexes are quantitative descriptions of the spatial composition and configuration of land use, which can influence a variety of ecological phenomena. In this paper, we propose a land use change simulation model based on landscape pattern indexes, Markov chain and cellular automata. In the model, Markov Chain is applied to predict the amount of land use change; transition potential maps generated from natural and socioeconomic indexes are used to control the spatial distribution of land use; landscape pattern indexes in the start year are used to differentiate the transition probabilities of land use classes within different sub-regions of the study area. First, the principles and implementation of the model were described. Then the model was successfully applied to the simulation of land use change in Changping, a district of Beijing. Based on land use maps in years 1988 and 1998, the land use map in year 2008 was simulated. By analyzing the simulation result, the effectiveness of the model for land use change simulation was demonstrated. By comparing results simulated by this model and the results simulated by Markov-CA model with the actual land use map, the advantage of this model in spatial accuracy was shown.

DOI

Outlines

/