Orginal Article

Spatial-temporal Evolution of Urban Heat Island Effects in Changsha City

  • YE Yu ,
  • QIN Jianxin , * ,
  • HU Shunshi
Expand
  • College of Resources and Environmental Science, Hunan Normal University, Changsha 410081, China
*Corresponding author: QIN Jianxin, E-mail:

Received date: 2016-07-22

  Request revised date: 2016-11-09

  Online published: 2017-04-20

Copyright

《地球信息科学学报》编辑部 所有

Abstract

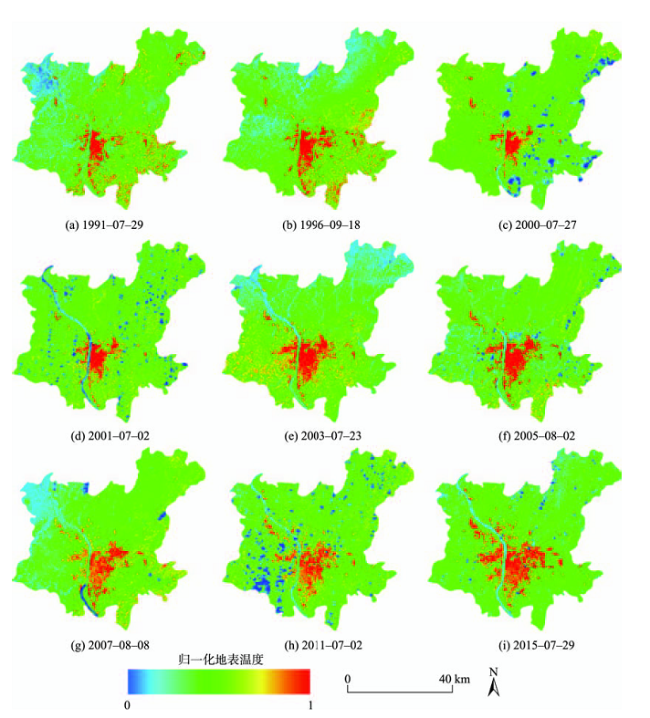
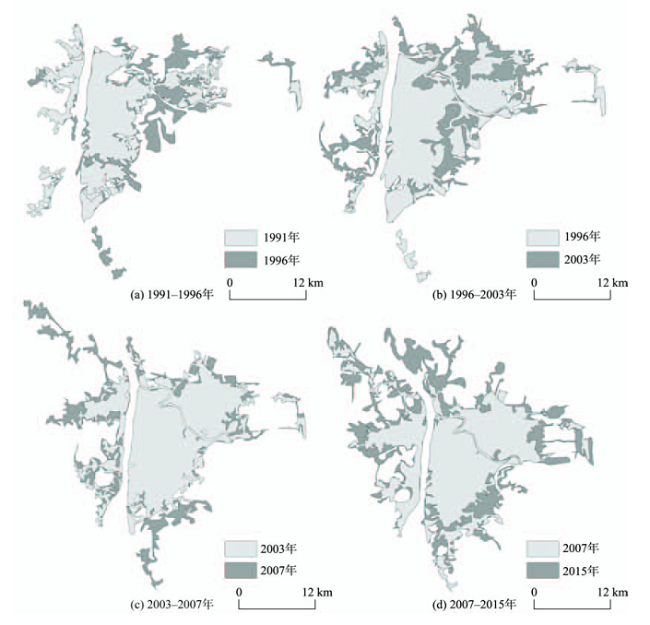
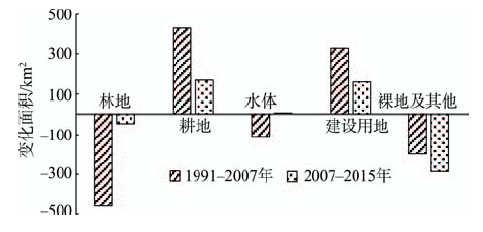
This study used 9 scenes of Landsat TM / ETM images from 1991-2015 in Changsha to retrieve the land surface temperature of built-area of Changsha City and extract the land use/cover types. Combined with the related data, the characteristics of temporal and spatial variation of urban heat island (UHI) effects in Changsha City and the relationship between UHI and urban land use/cover change were analyzed. The results show that the extent of UHI in Changsha increased with the expansion of built-up area, and the spatial and temporal evolution of heat island was consistent with the trend of built-up area. During 1991-1996, the UHI in the east of Changsha city developed rapidly. In 1996, the eastern heat island area increased by 53.54 km2. Then, the UHI extended to the west with the increased area of 39.88 km2 as a result of the extension of city built-up area between 1996-2003. In 2003-2007, the UHI extended to the west and south rapidly, during which the heat island area increased about 33.55 km2. After 2007, the urban area and UHI of Changsha began to expand all-around. In addition, great changes have occurred in the land use/cover types of Changsha. Large area of green land was changed into building land and farmland, which greatly affected the spatial distribution of the land surface temperature (LST). Temperature difference between different land types was reduced significantly. The great capacity of heat absorption of water was obviously reflected. Construction land and bare land made great contributions to the LST.

Cite this article

YE Yu , QIN Jianxin , HU Shunshi . Spatial-temporal Evolution of Urban Heat Island Effects in Changsha City[J]. Journal of Geo-information Science, 2017 , 19(4) : 518 -527 . DOI: 10.3724/SP.J.1047.2017.00518
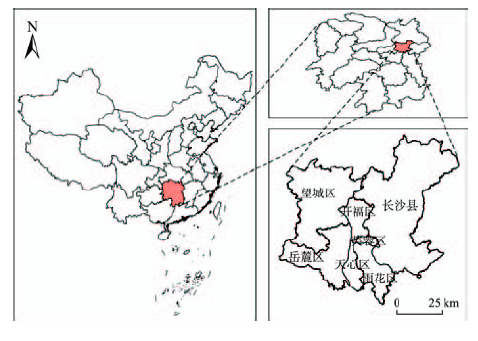
1 引言

城市化进程对城市气候的影响造成了城市热岛效应,1818年LakeHoward发现了伦敦市中心的气温比郊区高这一现象,并提出了“城市热岛”的概念,至此城市热岛问题受到广泛的关注[1]。据有关研究表明,目前有超过50%的人口居住在城市中,而这一比例在2030年预计将达到60%[2-3]。快速的城市扩张与城市化进程导致了植被等大量自然景观被沥青、水泥等不透水面所取代,这种变化使近地表大气的热特性、辐射、粗糙度、湿度等发生了改变[4-7],城市地表特性的变化将导致城市地表温度明显高于周边郊区[6]。随着城市范围的扩张和城市化的进一步发展,城郊气温和地表温度差异将会进一步增加,将对城市环境、气候变化以及居民生活质量产生显著的影响[4-6]。因此,由城市扩张和城市化进程导致的城市热岛效应将成为城市气候、环境和城市规划关注的热点。
国内外学者利用遥感技术对城市热岛进行了大量研究,热红外遥感等技术的发展更为城市热岛监测提供了十分强大的技术手段[8]。尽管城市热岛效应已经引起了国内外学者们的关注,但目前这方面研究仍较多集中于城市热岛的变化分析,对城市热岛的长时间序列、多因子、多时相的定量化分析则有待进一步深入[9-12]。本文以长沙市为例,利用遥感技术对长沙市建成区1991-2015年城市热岛效应进行研究,对长沙市城市热环境时空变化以及主要地表参数的变化对长沙市热岛效应的影响进行了定量分析与研究。这对了解长沙市城市热岛的构成、变化、科学规划城市及建设绿色环保生态城市具有十分重要的意义。

2 研究区概况及数据源

长沙市是湖南省省会,位于湖南省东北部,湘江中下游和长浏盆地的西缘。(111°53′~114°15′E,27°51′~28°41′N)。自古以来就是中国中南部的重要城市。
本文以长沙市主要建成区及其周边区域为研究区域(图1),由于长沙市处于2景影像之间,影像条带号分别为123/40,123/41,故采用1991-2015年共18景夏季Landsat TM/ETM+影像研究长沙市热岛时空变化,各景影像具体信息见表1。本文所使用的影像数据下载自USGS网站,所有影像数据成像时间在6-9月,影像基本无云或具有少量云,尽管部分影像云含量超过10%,但在研究区域内的云量较少,因此不会对本文的研究造成严重影响。
Fig 1 Location of the study area

图1 研究区位置示意图

Tab.1 Remote sensing data used in this study

表1 本文所使用的遥感数据

序号 条带号 传感器类型 成像时间 含云量/%
1 123/40和123/41 TM 1991-07-19 0和1
2 123/40和123/41 TM 1996-09-18 11和0
3 123/40和123/41 TM 2000-07-27 10和14
4 123/40和123/41 ETM+ 2001-07-22 4和13
5 123/40和123/41 ETM+ 2003-07-28 0和0
6 123/40和123/41 ETM+ 2005-08-02 4和7
7 123/40和123/41 ETM+ 2007-08-08 1和2
8 123/40和123/41 ETM+ 2011-07-02 12和24
9 123/40和123/41 ETM+ 2015-07-29 2和8

3 研究方法

3.1 数据预处理

由于ETM+机载扫描行校正器(SLC)故障导致2003年5月31日之后获取的影像出现数据重叠和约25%的数据丢失,因此本研究使用国际科学数据服务平台的多影像局部自适应回归分析模型对2003年以后的数据进行了修复。修复后相对完好的70%~80%数据可用,且由于ETM+影像波段分辨率较低,热红外波段分辨率甚至达到60 m,因此修复后的影像对地表温度反演结果影响较小。对研究区域内的遥感图像进行几何校正、图像增强、镶嵌等预处理后,再利用研究区域内的矢量数据对影像数据进行图像裁剪。

3.2 地表温度反演

本次研究采用覃志豪等[13]提出的单窗算法求算地表温度(LST)。
(1)将TM6波段的DN值按式(1)所示的方程 转换。
L λ = L MAX - L MIN 255 DN + L MIN (1)
式中: L λ 为传感器光谱辐射亮度/( W m - 2 s r - 1 μ m - 1 ); L MAX , L MIN 分别为该波段探测器可探测的最高和最低辐射亮度值,可以通过查找影像的头文件获得,对于TM影像, L MAX = 15.303 W m - 2 s r - 1 μ m - 1 , L MIN = 1.238 W m - 2 s r - 1 μ m - 1 ;对于ETM+影像, L MAX = 17.040 W m - 2 s r - 1 μ m - 1 , L MIN = 1.238 W m - 2 s r - 1 μ m - 1
(2)根据式(2)将辐射亮度换算成亮度温度值。
T 6 = K 2 ln K 1 L + 1 (2)
式中: K 1 K 2 为校正计算常数,与 L MAX L MIN 一样,均可在影像头文件中查到,对于TM数据, K 1 =607.76 W m - 2 s r - 1 μ m - 1 , K 2 =1260.56 K ;对于ETM+数据, K 1 =666.09 W m - 2 s r - 1 μ m - 1 , K 2 =1282.71 K ; L 为辐射亮度值。
(3)根据式(3)计算地表温度。
T s = 1 C a 1 - C - D + b 1 - C - D + C + D T 6 - D T a (3)
式中: T s 是地表温度K; T a T 6 分别是大气平均作用温度(K)和卫星高度上传感器探测到的像元亮度温度( K );a和b是常量,分别为-67.355351和0.458606;C和D是中间变量,C= τ 6 ε 6 ,D= ( 1 - τ 6 ) 1 + τ 6 ( 1 - ε 6 ) ; τ 6 ε 6 分别是热红外波段的大气透射率和地表比辐射率。 T a τ 6 ε 6 的确定可以参考[14]-[16]
为了验证数据的可靠性,根据收集到的气象资料,选取长沙市内长沙站、马坡岭气象站为中心,做100 m的缓冲区,计算缓冲区内LST的平均值,并与气象站当日实测的日平均地表温度作对比,如表2所示。二者绝对误差最大不超过5 ℃,相对误差在1%~18%之间波动,且大部分都小于10%,反演精度满足本文要求,基本可以代表长沙市地表实际温度。
Tab.2 The verification of retrieval

表2 反演结果验证

站名 区站号 经度/°E 纬度/°N 年份 实测温度/℃ LST/℃ 绝对误差/℃ 相对误差
长沙 57687 112.92 28.22 1991 29.5 31.03 1.53 0.05
马坡岭 57679 113.08 28.2 29.9 30.88 0.98 0.03
长沙 57687 112.92 28.22 1996 26.4 29.19 2.79 0.11
马坡岭 57679 113.08 28.2 26.20 27.26 1.06 0.04
长沙 57687 112.92 28.22 2000 30.2 28.94 -1.26 -0.04
马坡岭 57679 113.08 28.2 20.5 28.26 -2.24 -0.07
长沙 57687 112.92 28.22 2001 30.5 31.83 1.33 0.04
马坡岭 57679 113.08 28.2 30.9 30.73 -0.17 -0.01
长沙 57687 112.92 28.22 2003 31.8 35.66 3.86 0.12
马坡岭 57679 113.08 28.2 31.6 34.17 2.57 0.08
长沙 57687 112.92 28.22 2005 27.3 30.41 3.11 0.11
马坡岭 57679 113.08 28.2 27.5 28.72 1.22 0.04
长沙 57687 112.92 28.22 2007 29.6 31.86 2.26 0.08
马坡岭 57679 113.08 28.2 29.5 30.58 1.08 0.04
长沙 57687 112.92 28.22 2011 30.5 30.97 0.47 0.02
马坡岭 57679 113.08 28.2 30.5 29.93 -0.57 -0.02
长沙 57687 112.92 28.22 2015 26.2 30.86 4.66 0.18
马坡岭 57679 113.08 28.2 26.2 30.37 4.17 0.16
尽管研究范围内的各影像获取时间均为夏季,但由于时间跨度大,直接比较地表温度仍会有较大的差别,故采用归一化的方法将地表温度分布范围统一到0和1之间,进一步消除不同成像时期带来的影响(图2)。其归一化公式如式(4)所示[17]
N i = T i - T min T max - T min (4)
式中: N i 表示第i个像元归一化后的值, T i 为第i个像元的地表温度值, T max , T min 分别为地表温度的最大、最小值。利用密度分割方法将归一化后的地表温度划分成低温、较低温、次中温、中温、次高温、高温和极高温7个等级,如表3所示。
Fig. 2 LST distribution for Changsha from 1991 to 2015

图2 1991-2015长沙市建成区地表温度分布情况

Tab.3 The range of different LST intervals

表3 地表温度等级划分

温度等级 区间 范围
#7 极高温区 Ts>Ta+2Sd
#6 高温区 Ta+Sd<TsTa+2Sd
#5 次高温区 Ta+Sd/2<TsTa+Sd
#4 中温区 Ta-Sd/2TsTa+Sd/2
#3 次中温区 Ta-SdTsTa-Sd/2
#2 次低温区 Ta-2SdTsTa-Sd
#1 低温区 Ts<Ta-2Sd

注:Ts表示地表温度;Ta表示地表温度平均值;Sd是标准差

4 结果分析

4.1 长沙市热岛时空变化特征分析

根据图2的地表温度空间分布情况可以看出,长沙市城区地表温度明显高于周边郊区,并形成岛状的高温区域,界线清晰,热岛现象十分明显,证明城市热岛效应确实存在。各温度区呈不规则的环状分布,表现出温度由低到高或由高到低逐渐变化的规律性[18]。长沙城市热岛的空间分布与扩展和城市建成区的轮廓基本一致,并随着城市的发展向外扩张[18];城市高温区基本集中在工商业集中和人口密集的城市中心地区,并呈现出地表温度从城市中心向郊区逐渐降低的热岛的空间分布格局。
总的来说,长沙市热岛效应空间分布情况随时间的推移和城市发展具有以下4个明显特征:
(1)1991-1996年城市东部热岛效应加速显现
20世纪90年代初期,长沙城市规模比较小,城市强高温区主要集中在湘江东部建筑和人口密集的旧城区以及湘江西岸岳麓山风景区下南北向的一小片人口密集区。1992年长沙市经济开发区坐落于长沙县,大量林地和耕地逐渐被开发成建设用地,相较于1991年,长沙市东部1996年新增加热岛面积约53.54 km2图3(a))。1991-1996年,长沙市建成区热岛沿浏阳河向东快速发展,位于东北部的长沙县也开始出现大范围的热岛区,且有与长沙市旧城区的热岛区相连接的趋势。
Fig.3 Comparison of the distribution of UHI in Changsha during 1991-2015

图3 1991-2015年长沙市热岛各阶段分布情况对比

(2)1996-2003年城市西部热岛效应延伸
2000-2003年,长沙市开启了较大规模的城市建设,城市热岛效应向城市各个方向开始加速扩展。落户于岳麓区的长沙高新技术开发区开启大规模建设,使岳麓大道、319国道及湘江西岸原有的老城区的高温区连成一片,增加面积约为39.88 km2图3(b))。此外,长沙市区的外环以及西部和北部开始出现沿高速发展的线状高温区,并有沿线继续发展的趋势,主要原因是随着长沙绕城高速北段和西段的修建以及长益高速和京珠高速(京港澳高速)长沙段的建成,高速周边居住人口逐渐增多,并形成了一定的人口和建筑密集区,从而导致了线状高温区的出现。
(3)2003-2007年加速发展的西、南部热岛
2003-2007年,湖南省开始大规模建设资源节约型和环境友好型长株潭城市群,长沙市南部城区发展迅速,大面积的裸地和植被覆盖区被建筑物和不透水面所取代,导致热岛扩展速度明显变快,与2003年相比高温区和中温区总面积增加约33.55 km2图3(c))。此外,沿湘江往西北望城区方向也不断有新的高温区域出现;湘江西岸岳麓区热岛则以新市政府和高新技术开发区为中心呈面状加速向四周延伸,并有与望城区高温区连成片的趋势。同时,老城区建筑密集的区域开始向周边城区疏散,聚集的区域强高温中心开始出现向周边分散的趋势,城市强高温区较往年减少。
(4)2007-2015年全面发展的长沙城区与热岛
2011-2015年,长沙市东、西、南、北4个方向高温区范围继续扩展,东部热岛以黄花机场为中心向外扩展。湘江以西国家级高新技术产业开发区麓谷工业园的迅速发展和长沙高铁南站的建成运营,带动了长沙城区西北部与南部的迅速发展以及两地中、高温区的进一步扩大,岳麓区热岛与望城区热岛基本连成片,南部大面积低温区和较低温区发展成为中温区和高温区区,北部热岛扩展则相对缓慢,热岛区与非热岛区基本以捞刀河为界(图3(d))。研究区强热岛相对于2007年持续减少,这与中、高温区温度差异的缩小和区域热岛中心的分散一定的关系[19-20]

4.2 土地利用/覆盖变化对长沙市热岛强度影响分析

不同下垫面覆盖类型的地表温度有很大差异,对城市热岛强度贡献也不同[21]。为了研究长沙市热岛强度与土地利用/覆盖变化的关系,结合长沙市国土资源局的土地利用数据,将土地利用/覆盖类型与地表温度分布情况进行叠加分析,得到1991、2007和2015年间的土地利用/覆盖变化转移情况(表4图4)和各土地利用/覆盖类型的地表温度情况(表5)。可以看出,2015年各土地利用/覆盖类型的温度均比1991年高,证明随着城市的发展及土地利用类型的变化,城市热岛效应明显增强。
Tab.4 The transfer matrix of land covers in 1991 and 2015(km2

表4 1991年和2015年土地利用/覆盖转移矩阵(km2

2015年 1991年 合计
林地 耕地 水体 建设用地 裸地及其他
林地 890.48 103.78 10.25 19.29 130.64 1154.44
耕地 486.81 715.78 86.92 111.05 273.54 1674.10
水体 10.59 12.16 122.84 6.33 3.55 155.47
建筑用地 223.66 202.00 36.85 122.06 173.26 757.83
裸地及其他 46.16 38.06 4.96 10.15 28.86 128.19
Fig.4 The changes of land use/cover type area from 1991 to 2015

图4 1991-2015年各土地利用/覆盖类型面积变化情况(km2

Tab.5 Average normalized LST (mean±S.D) associated with land covers

表5 各土地利用/覆盖类型的地表温度特征

土地类型 归一化温度
1991年 2007年 2015年
林地 0.22±0.05 0.37±0.03 0.40±0.04
耕地 0.22±0.05 0.36±0.03 0.40±0.02
水体 0.18±0.05 0.34±0.05 0.35±0.03
建设用地 0.33±0.11 0.41±0.06 0.48±0.10
裸地及其他 0.26±0.06 0.40±0.07 0.47±0.06
表4图4可以发现,1991-2015年长沙市土地利用/覆盖类型发生了明显的变化,变化面积最大的是耕地,截至2015年,耕地总面积增加602.32 km2,变化比例达56.2%,其次是林地和建设用地,约503.26 km2林地转变为其他类型用地,建设用地则在24年间增加488.95 km2,变化比例达181.85%。其中,1991-2007年土地利用/覆盖类型比2007-2015年变化更剧烈。从图4可知,截至2007年,耕地面积急剧增加433.24 km2,建设用地则增加了328.22 km2,林地和水体在1991-2007年则分别减少了458.07 km2和109.44 km2。而在2007-2015年土地利用/覆盖类型的变化比1991-2007年小了很多,林地减少速度明显放缓,其次是耕地,水体面积更是少许增加。值得注意的是,2007-2015年裸地及其他用地减少面积比1991-2007年裸地及其他用地减少面积要多近二分之一,这与2005年以后湖南省深化对土地的集约节约利用,加大对裸地及其他土地类型的利用政策有关。
结合表5可看出,建设用地的地表平均温度最高,其次是裸地及其他用地;水体的温度始终最低,其次是林地和耕地。这是由于建设用地下垫面主要由砖石水泥、混凝土等不透水面构成,热传导率和热扩散率较大,具有较强的太阳辐射吸收能力;且城市建筑物密集,不利于城市内部的空气流通,导致地表温度很高。裸地及其它用地植被覆盖度低,比热容较低且导热性好,因此在接收太阳辐射之后温度上升较快。水体比热容大,热传导率小,因此温度最低。林地和耕地植被的蒸腾作用可以减少土壤中的热量,因此地表温度也比较低。城区林地、水体以及未利用地大幅度减少,取而代之的是大量的房屋、工厂、道路等建设用地和耕地,使城市下垫面性质发生了显著变化,这些变化造成了地表热特征在时空尺度上的改变,导致了热岛效应。这与长沙市的快速发展和经济水平的不断提高有着密切关系。
为了更深入地研究土地覆盖变化与城市热岛格局时空变化之间的关系,利用ArcGIS从长沙市中心城区以1 km为间距向外生成1~18 km范围内的18个环形缓冲区,并对这18个环形缓冲区内的土地覆盖面积比重以及归一化温度均值进行统计,绘制成随缓冲区距离变化的曲线图(图5)。
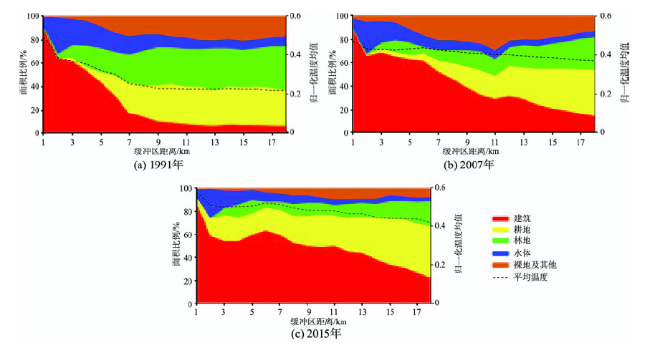
Fig.5 Variations of the land cover proportion and the average normalized LST with distance

图5 各土地覆盖类型面积比重及归一化平均温度随距离变化情况

图5可看出,1991年长沙市建设用地主要集中在6 km以内的中心城区,总体上随距离呈单调下降趋势,6 km之外以耕地和林地为主,另外裸地及其他用地也占了一部分。2007年建设用地由中心城区向外大幅度上升,裸地及其他用地也有所增加,而林地及耕地比重则在距中心城区11 km以内的范围下降迅速,但总体上耕地仍保持了一定的比重。2015年裸地及林地面积持续减少,耕地在中心城区以及郊外所占比重都有所回升并有增大的趋势。建设用地则不仅仅局限于长沙市中心城区及周边地区,在远离中心城区的地区也保持了一定的比重,这一分布特征与长沙市城市的扩展模式有密切联系。
图5给出了缓冲区内归一化温度均值随距离变化的情况。对照图5(a)、(b)、(c)可发现,1991年地表温度随与中心城区距离的增加持续降低,变化明显,到了9km以外林地和耕地比重较大的范围则比较平稳。而2007年和2015年温度曲线总体都要高出1991年,随距离的增长下降趋势也比较缓慢,可以发现温度随距离的变化情况与水体、建筑、林地和耕地面积比重的变化高度相关,这与表5的数据结果相吻合:在中心城区,建设用地面积对地表温度的贡献十分巨大,水体、林地等对缓解热岛效应起了很大作用;但在远离中心城区的环形区域,水体面积所占比重微小,林地面积也下降到一定比重,而建设用地面积大幅度上升,因此水体及林地等对热岛的缓解作用也变得十分微弱。
为了衡量各土地利用类型对地表温度的贡献,计算1991、2007和2015年3期数据每一温度区间的土地利用/覆盖类型面积比例(表6)。由表6可看出,在高温区,建设用地和裸地及其他占比最大,随着温度的下降,二者所占比例明显减少,水体、林地和耕地的比重逐渐增大,说明建设用地和裸地等对地表温度有很大的贡献。对比1991-2015年相同温度范围内不同的土地利用/覆盖类型可发现,各种土地利用类型的面积组成比也发生了很大的变化。1991年低温区林地面积占19.38%,耕地面积占76.60%,水体面积占3.81%;2015年则变成林地面积占22.15%,耕地面积占24.44%,水体面积占48.61%。反观高温区各类土地覆盖类型,1991年建筑用地面积占32.85%,裸地及未利用地面积占39.33%,耕地面积占21.1%;到2015年则逐渐变成建筑用地面积占74.62%,裸地及其他用地面积占12.78%,耕地面积占10.86%。对1991至2015年地表温度进行统计(表5)发现,1991年研究区内归一化平均温度为0.22,而2015年研究区归一化平均温度增长为0.42,证明长沙市建成区热岛强度在1991-2015年间有所增强。综合表5可以分析,导致这种情况的原因很大部分在于1991年,建筑用地面积较小,林地、耕地占研究区面积较大,研究区内平均温度较低,但各土地类型之间温度差异较大。1991-2015年,由于城市的扩张,大量林地、未利用地和水体被开垦为耕地和建设用地,林地和水体面积不断减少,因此2015年研究区地表平均温度虽然较1991年要高,但是各土地类型之间的温度差异较1991年而言变小,水体良好的吸热性能逐渐显现出来,才会出现1991年低温区水体比例很小,而在2015年低温区水体占比达到48.61%的情况。耕地在2期的低、中温区甚至高温区都分别占据很大比例,这与长沙市的地理位置和耕地类型有一定的关系:长沙市地处长江南岸,是典型的亚热带季风性气候,大部分耕地都是水田,小部分是旱地,水田含水量高,比热容较大,而旱地比热容较小,从而导致耕地在低、中、高温区都占据有部分比例,并且低、中温区耕地比例明显比高温区所占比例要大。而林地在2期的低温区和中温区都分别占据很大比例,进一步说明水体、林地、耕地这3种土地类型可以显著降低地表温度,并且水体的作用明显大于林地和耕地。这种降温作用对于控制和分割城市热岛效应的空间分布具有重要的实际意义,因此,合理的规划水体、林地和耕地有助于缓解城市热岛效应[20-22]
Tab.6 The transfer matrix of land covers from 1991 to 2015(%)

表6 1991和2015年各温度等级区不同土地利用/覆盖面积比例(%)

土地类型 低温区 中温区 高温区
1991年 2007年 2015年 1991年 2007年 2015年 1991年 2007年 2015年
林地 19.38 26.89 22.15 56.79 35.81 37.88 2.62 3.89 1.56
耕地 76.60 49.06 24.44 28.06 53.42 55.37 21.10 10.25 10.86
水体 3.81 20.20 48.61 5.80 4.81 1.30 4.11 0.15 0.18
建设用地 0.03 3.21 4.79 0.74 2.30 4.42 32.85 59.45 74.62
裸地及其他 0.18 0.64 0.01 8.65 3.66 1.03 39.33 26.27 12.78

5 结语

本文采用1991-2015年的TM/ETM+影像对长沙市城市扩展造成的城市热岛效应和热岛的空间格局、强度,以及随时间的变化的长沙市土地利用/覆盖情况对城市地表温度的影响进行了定量的评价和研究。研究结果表明:20世纪90年代初期,长沙市热岛主要集中在湘江以东的中心城区和老城区,1991-2015年长沙市建成区以较快的速度大幅增长。在所研究的24年间,长沙市城市扩展对长沙市城市热岛效应造成了很大的影响:1991-1996年,长沙市热岛范围向东部长沙县扩展,随着河西岳麓区的人口经济发展,2000之后长沙市建成区迅速向西扩展,西部高温区范围也快速增加;2003年之后城市热岛逐渐向南扩张,至此,长沙市城市热岛范围已经随着城市建成区的发展向东、南、西、北4个方向快速扩大,城市高温区面积则随着建成区的变大逐渐减小,中温区面积增加,造成这种现象的原因很可能是随着城市的发展和土地利用的变化,城市地表温度逐渐升高,研究区内高低温差异逐渐减小。进一步对长沙市地表温度与主要土地覆盖/利用类型之间的关系进行定量分析表明,不同的下垫面覆盖类型的地表温度有很大差异,对城市热岛强度贡献不同。1991-2015年,研究区内大量林地、水体和未利用地转变成建设用地和耕地,对地表温度的贡献巨大,这与长沙城市的快速发展和经济水平的不断提高有密切关系。
由于受天气因素的影响,本文只收集到 1991-2015年部分年份的夏季影像,在后续研究中,将收集不同年份、不同传感器的影像,进一步分析城市热环境与城市建成区的时间和空间变化关系,以便为缓解和控制城市热岛提供有效的科学依据。

The authors have declared that no competing interests exist.

[1]
陈云浩,李晓兵,史培军,等.上海城市热环境的空间格局分析[J].地理科学,2002,22(3):317-322.城市热环境是城市空间环境在热力场中的综合表现,通过对城市热环境的研究可以揭示城市空间结构、城市规模的发展变化。在RS、GIS的支持下,研究城市热环境的空间格局分析方法。借鉴景观生态学的研究方法,首次提出热力景观观点用以研究城市热环境空间格局,创建了热力景观空间格局的评价体系(总体评价指标、类评价指标、块评价指标)。对不同时期上海城市热环境的空间结构与格局进行了研究,使传统的对热环境空间格局的定性研究进入了定量阶段。

DOI

[Chen Y H, Li X B, Shi P J, et al.Study on spatial pattern of urban heat environment in Shanghai city[J]. Scientia Geographica Sinica, 2002,22(3):317-322. ]

[2]
Zhou W, Huang G, Cadenasso ML.Does spatial configuration matter? Understanding the effects of land cover pattern on land surface temperature in urban landscapes[J]. Landscape and urban planning, 2011,102(1):54-63.The effects of land cover composition on land surface temperature (LST) have been extensively documented. Few studies, however, have examined the effects of land cover configuration. This paper investigates the effects of both the composition and configuration of land cover features on LST in Baltimore, MD, USA, using correlation analyses and multiple linear regressions. Landsat ETM + image data were used to estimate LST. The composition and configuration of land cover features were measured by a series of landscape metrics, which were calculated based on a high-resolution land cover map with an overall accuracy of 92.3%. We found that the composition of land cover features is more important in determining LST than their configuration. The land cover feature that most significantly affects the magnitude of LST is the percent cover of buildings. In contrast, percent cover of woody vegetation is the most important factor mitigating UHI effects. However, the configuration of land cover features also matters. Holding composition constant. LST can be significantly increased or decreased by different spatial arrangements of land cover features. These results suggest that the impact of urbanization on UHI can be mitigated not only by balancing the relative amounts of various land cover features, but also by optimizing their spatial configuration. This research expands our scientific understanding of the effects of land cover pattern on UHI by explicitly quantifying the effects of configuration. In addition, it may provide important insights for urban planners and natural resources managers on mitigating the impact of urban development on UHI. (C) 2011 Elsevier B.V. All rights reserved.

DOI

[3]
Peng J, Xie P, Liu Y, et al.Urban thermal environment dynamics and associated landscape pattern factors: A case study in the Beijing metropolitan region[J]. Remote Sensing of Environment, 2016,173:145-155.Urbanization has eco-environmental consequences; among which are effects on the urban thermal environment, which have drawn extensive attention especially in metropolitan regions having intensive population and high building density. In this study, the variation of the thermal environment during the urbanization process from 2001 to 2009 in the Beijing metropolitan region was evaluated using the spatial Lorenz curve and distribution index. In addition, the effects of landscape composition and spatial configuration on the thermal environment were investigated using correlation analysis and piecewise linear regression. The urban heat island (UHI) was found to be much more significant in summer than in spring, autumn and winter. Furthermore, the magnitude of the urban thermal environment in Beijing has increased during the process of urbanization. The suburban areas of Beijing, including the new urban development zone and ecological conservation zone, have increased the magnitude of the thermal environment. However, the opposite effect has occurred in the center of Beijing, including the core functional zone and urban function extended zone. Landscape types such as built-up areas and barren land make the most significant contribution to the thermal environment, whereas ecological land plays a significant role in mitigating the UHI. When the coverage of ecological land exceeded 70% (25 km 2 ) of the total land area, the cooling efficiency of this landscape type was relatively obvious, and the shape index and fragmentation index of landscape configuration both had a significantly positive correlation (0.594 and 0.510 Pearson's coefficients, respectively) with average land surface temperature. The Pearson's coefficient between the ecological land proportion and the average land surface temperature was 0.614 (P < 0.01); this value was higher than that for the effects of the spatial configuration, indicating that landscape composition affects the thermal environment more than does spatial configuration.

DOI

[4]
Kalnay E, Cai M.Impact of urbanization and land-use change on climate[J]. Nature, 2003,423(6939):528-531.

[5]
Weng Q.A remote sensing?GIS evaluation of urban expansion and its impact on surface temperature in the Zhujiang Delta, China[J]. International Journal of Remote Sensing, 2001,22(10):1999-2014.The Zhujiang Delta of South China has experienced a rapid urban expansion over the past two decades due to accelerated economic growth. This paper reports an investigation into the application of the integration of remote sensing and geographic information systems (GIS) for detecting urban growth and assessing its impact on surface temperature in the region. Remote sensing techniques were used to carry out land use/cover change detection by using multitemporal Landsat Thematic Mapper data. Urban growth patterns were analysed by using a GIS-based modelling approach. The integration of remote sensing and GIS was further applied to examine the impact of urban growth on surface temperatures. The results revealed a notable and uneven urban growth in the study area. This urban development had raised surface radiant temperature by 13.01 K in the urbanized area. The integration of remote sensing and GIS was found to be effective in monitoring and analysing urban growth patterns, and in evaluating urbanization impact on surface temperature.

DOI

[6]
Zhou L, Dickinson RE, Tian Y, et al.Evidence for a significant urbanization effect on climate in China[J]. Proceedings of the National Academy of Sciences of the United States of America, 2004,101(26):9540-9544.

[7]
历华,柳钦火,邹杰.基于MODIS数据的长株潭地区NDBI和NDVI与地表温度关系研究[J].地理科学,2009,29(2):262-267.基于4个季节的MODIS影像,计算长株潭地区的地表温度、NDBI和NDVI,比较NDBI和NDVI与地表温度之间关系,对地表城市热岛效应研究的指标NDBI和NDVI进行对比分析。结果表明,NDBI与4个季节的地表温度间都存在明显的线性关系,而NDVI与地表温度间关系并不明显且随季节发生变化,说明NDBI是地表城市热岛效应研究的有效指标,在地表城市热岛效应的季节变化研究中NDBI可作为NDVI的一个附加指标。

[Li H, Liu Q H, Zou J.Relationships of LST to NDBI and NDVI in Changsha-Zhuzhou-Xiangtan area based on MODIS data[J]. Scientia Geographica Sinica, 2009,29(2):262-267. ]

[8]
孙天纵,周坚华.城市遥感[M].上海:上海科学技术文献出版社,1995.

[Sun T Z, Zhou J H.Urban Remote Sensing[M]. Shanghai: Shanghai Scientific&Technicial Publishers,1995. ]

[9]
张伟,蒋锦刚,朱玉碧.基于空间统计特征的城市热环境时空演化[J].应用生态学报, 2015,26(6):1840-1846. ]lt;div style="line-height: 150%">利用遥感反演和GIS空间分析等工具,提出了一种基于空间统计特征的城市热岛范围界定方法,并应用该方法分析了1984&mdash;2010年杭州市城市热环境的时空演化规律.结果表明: 1984&mdash;2010年间,杭州市的城市热岛面积增加了8.66倍;杭州城市热岛的空间形态日趋复杂,空间分布由单中心的聚集状态逐渐向多中心的扩散状态发展;杭州城市热环境呈现出由区域低温均衡向区域高温均衡发展的态势.城市热岛的动态变化检测表明,城市扩张是杭州城市热岛发育的主要原因.本文所提方法考虑了城市地表温度的空间相关关系,反映了城市地表温度的全局统计特征,提供的信息更多,也更为客观和准确.通过该方法的推广,有助于解决当前城市热岛研究中研究样本之间缺乏通用性和可比性的问题.</div><div style="line-height: 150%">&nbsp;</div><div style="line-height: 150%">&nbsp;</div>

[Zhang W, Jiang J G, Zhu Y B. Spatial-temporal evolution of urban thermal environment based on spatial statistical features[J]. Chinese journal of applied ecology, 2015,26(6):1840-1846. ]

[10]
白杨,王晓云,姜海梅,等.城市热岛效应研究进展[J].气象与环境学报,2013,29(2):101-106.随着城市规模的高速发展和城市人口的急剧膨胀,因城市下垫面结构的急剧变化和城市人为热排放的迅速增加所引起的城市热岛效应已逐渐成为严重影响城市人居环境和居民健康的重要因素。城市热岛效应研究已成为城市气候和区域气候研究中的热点问题。为更好地研究城市热岛效应,及时追踪国内外最新进展,综述了城市热岛的概念和形成机制,重点介绍了地面气象资料观测法、遥感监测法和边界层数值模式模拟法等3种城市热岛效应研究方法,总结了城市热岛效应国内外最新研究进展。最后基于现有城市热岛效应研究不够完善和深入,研究过于简单化和表面化,尺度局限于宏观大尺度以及各种方法自身的局限性等不足,指出在未来的城市热岛效应研究中,应突破现有的大中尺度,注意结合高分辨率卫星遥感影像进行多尺度多平台监测以及综合考虑气溶胶粒子对辐射强迫的影响等。

[Bai Y, Wang X Y, Jiang H M, et al.Progress of urban heat island effect[J]. Journal of Meteorology and Environment, 2013,29(2):101-106. ]

[11]
Carlson T N, Arthur S T.The impact of land use - land cover changes due to urbanization on surface microclimate and hydrology: A satellite perspective[J]. Global & Planetary Change, 2000,25(1):49-65. ]ABSTRACT Vegetation cover, surface moisture availability (wetness) and radiant surface temperature constitute microclimatic variables derivable from multi-spectral satellite imagery. In addition, fraction impervious surface cover and urban-induced surface runoff (RO) are obtainable from such imagery when it is combined with a conventional image classification. Using AVHRR and Landsat TM data, we illustrate how these parameters respond to urbanization with a case study of Chester County, PA a region that has undergone rapid urban development over the past decade. Specific factors affecting the change in the surface microclimatic variables are discussed. Based on a statistical analysis of the Chester County data, future values of these microclimatic parameters can be predicted, given the characteristics of the initial land surface and an estimate of the change in vegetation and urban coverage.

DOI

[12]
乔治,田光进.北京市热环境时空分异与区划[J].遥感学报,2014,18(3):715-734.城市热环境空间区划是采用分区管理的思路来缓解城市社会经济发展与热环境之间矛盾的技术基础。本文构建城市热环境区划模型的思路为:(1)将不同时相的MODIS地表温度数据产品进行正规化、分级,分析2008年北京城市热环境时空分布特征。(2)构建城市热环境影响因素评价体系,并通过空间主成分分析计算得到热环境影响主成分因子。(3)通过自组织映射神经网络,利用热环境影响主因子,进一步对热环境进行空间区划。结果表明,北京夜间较白天城市热岛分布层次感明显,夏季白天较其他季节高温区聚合程度高。区域下垫面组成要素直接影响热环境,北京城市热环境的主成分因子依次为植被覆盖、地形地貌、城市下垫面建设规模和人为热排放,并依此将北京划为7个热环境区域,根据各个分区热环境成因机制差异分别提出热环境改善和调控措施。

DOI

[Qiao Z, Tian GJ.Spatio-temporal diversity and regionalization of the urban thermal environment in Beijing[J]. Journal of Remote Sensing, 2014,18(3):715-734. ]

[13]
覃志豪, Minghua Z, Karnieli A, 等. 用陆地卫星TM6数据演算地表温度的单窗算法[J]. 地理学报,2001(4):456-466.陆地卫星 TM数据 (TM6)热波段表示地表热辐射和地表温度变化。长期以来 ,从 TM6数据中演算地表温度通常是通过所谓大气校正法。这一方法需要估计大气热辐射和大气对地表热辐射传导的影响 ,计算过程很复杂 ,误差也较大 ,在实际中应用不多。根据地表热辐射传导方程 ,推导出一个简单易行并且精度较高的演算方法 ,把大气和地表的影响直接包括在演算公式中。该算法需要用地表辐射率、大气透射率和大气平均温度 3个参数进行地表温度的演算。验证表明 ,该方法的地表温度演算较高。当参数估计没有误差时 ,该方法的地表温度演算精度达到 0 .4℃ ,在参数估计有适度误差时 ,演算精度仍达 1 .1℃。因该方法适用于仅有一个热波段的遥感数据 ,故称为单窗算法。

DOI

[Qin Z H, Minghua Z, Karnieli A, et al.Mono-window algorithm for retrieving land surface temperature from Landsat TM6 data[J]. Acta Geographica Sinica, 2001,4:456-466.]

[14]
Qin Z, Karnieli A, Berliner P.A mono-window algorithm for retrieving land surface temperature from Landsat TM data and its application to the Israel-Egypt border region[J]. International Journal of Remote Sensing, 2010,22(18): 3719-3746.

[15]
覃志豪, Wenjuan L, Minghua Z, 等. 单窗算法的大气参数估计方法[J]. 国土资源遥感,2003(2):37-43.根据地表热辐射传导方程,提出了一个简单可行且精度较高的专门用于从TM6数据中演算地表温度的方法———单窗算法。这一算法把大气和地表状态对地表热传导的影响直接包括在演算公式中。该方法需要两个大气参数进行地表温度的演算,即大气平均作用温度和大气透射率。本文论述这两个大气参数的估计方法:根据大气水分含量或地表附近空气湿度来估计大气透射率;通过分析标准大气剖面资料,尤其是大气水分和气温随高程的变化规律,根据地表温度推算大气平均作用温度。

DOI

[Qin Z H, Wenjuan L, Minghua Z, et al.Estimating of the essential atmospheric parameters of mono-window algorithm for land surface temperature retrieval from Landsat TM6[J]. Remote Sensing For Land &Resources, 2003,2:37-43. ]

[16]
Chander G, Markham B.Revised Landsat - 5 TM radiometric calibration procedures and postcalibration dynamic ranges[J]. IEEE Transactions on Geoscience and Remote Sensing, 2003,41(11):2674-2677.Effective May 5, 2003, Landsat-5 (L5) Thematic Mapper (TM) data processed and distributed by the U.S. Geological Survey (USGS) Earth Resources Observation System (EROS) Data Center (EDC) will be radiometrically calibrated using a new procedure and revised calibration parameters. This change will improve absolute calibration accuracy, consistency over time, and consistency with Landsat-7 (L7) Enhanced Thematic Mapper Plus (ETM+) data. Users will need to use new parameters to convert the calibrated data products to radiance. The new procedure for the reflective bands (1-5,7) is based on a lifetime radiometric calibration curve for the instrument derived from the instrument's internal calibrator, cross-calibration with the ETM+, and vicarious measurements. The thermal band will continue to be calibrated using the internal calibrator. Further updates to improve the relative detector-to-detector calibration and thermal band calibration are being investigated, as is the calibration of the Landsat-4 (L4) TM.

DOI

[17]
徐涵秋,陈本清. 不同时相的遥感热红外图像在研究城市热岛变化中的处理方法[J]. 遥感技术与应用,2003(3):129-333.lt;p>卫星图像的热红外波段已被广泛地用来研究城市热岛效应。由于客观条件的限制,在城市热岛变化的比较研究中,很难获得不同年代的同时相图像,特别是在南方多云雨的地区。所以,这给城市热岛的变化研究带来了很大的困难。为此,采用了将不同时相的热红外图像进行正规化、分级,并制成差值影像图的方法,较好地减少了季相差异的影响,使得不同时相的热红外图像得以对比。为了定量地研究城市热岛(UHI)的变化,还创建了城市热岛比例指数(URI)。该指数通过热岛面积和城市建成区面积的比例关系并赋于不同的权重值来定量地评估热岛现象的变化情况。</p>

DOI

[Xu H Q, Chen B Q.An image processing technique for the study of urban heat island changes using different seasonal remote sensing data[J]. Remote Sensing Technology And Application, 2006,3:125-131. ]

[18]
历华,曾永年,柳钦火.基于遥感的长沙市城市热岛与土地利用/覆盖变化研究[J].国土资源遥感,2008,78(4):47-52.基于多时相Landsat TM/ETM^+影像,首先计算长沙市地表亮度温度,然后利用NDVI(归一化植被指数)、MNDWI(改进的归一化水体指数)、NDBI(归一化建筑指数)和NDBaI(归一化裸土指数)4个指数,采用决策树分类方法对长沙市影像进行土地利用/覆盖分类。在此基础上,对长沙市城市热岛的空间分布特征、时空演变特征以及城市热岛与土地利用/覆盖变化和各种影响因子之间的关系进行研究。结果表明,随着长沙市城区范围的不断扩张,城市热岛范围也不断增大;土地利用/覆盖类型的变化会改变地表温度的空间分布,城市用地和裸地是城市热岛强度的主要贡献因素,水体和林地具有较好的降温作用。地表温度与4种归一化指数的回归分析表明,它们之间存在明显的相关性,不同土地利用/覆盖类型的地表温度存在较大差异。

DOI

[Li H, Zeng Y N, Liu Q H.A remote sensing image-based study of the relationship between urban heat island and land use/cover changes in changsha city[J]. Remote Sensing For Land &Resources, 2008,78(4):47-52. ]

[19]
Ghobadi Y, Pradhan B, Shafri HZM, et al.Assessment of spatial relationship between land surface temperature and landuse/cover retrieval from multi-temporal remote sensing data in South Karkheh Sub-basin, Iran[J]. Arabian Journal of Geosciences, 2014,8(1):525-537.

[20]
Liu K, Su H, Zhang L, et al.Analysis of the urban heat island effect in Shijiazhuang, China using satellite and airborne data[J]. Remote Sensing, 2015,7(4):4804-4833.The urban heat island (UHI) effect resulting from rapid urbanization generally has a negative impact on urban residents. Shijiazhuang, the capital of Hebei Province in China, was selected to assess surface thermal patterns and its correlation with Land Cover Types (LCTs). This study was conducted using Landsat TM images on the mesoscale level and airborne hyperspectral thermal images on the microscale level. Land surface temperature (LST) was retrieved from four scenes of Landsat TM data in the summer days to analyze the thermal spatial patterns and intensity of surface UHI (SUHI). Surface thermal characteristics were further examined by relating LST to percentage of imperious surface area (ISA%) and four remote sensing indices (RSIs), the Normalized Difference Vegetation Index (NDVI), Universal Pattern Decomposition method (VIUPD), Normalized Difference Built-up Index (NDBI) and Biophysical Composition Index (BCI). On the other hand, fives scenes of airborne TASI (Thermal Airborne Spectrographic Imager sensor) images were utilized to describe more detailed urban thermal characteristics of the downtown of Shijiazhuang city. Our results show that an obvious surface heat island effect existed in the study area during summer days, with a SUHI intensity of 2-4 degrees C. The analyses reveal that ISA% can provide an additional metric for the study of SUHI, yet its association with LST is not straightforward and this should a focus in future work. It was also found that two physically based indices, VIUPD and BCI, have the potential to account for the variation in urban LST. The results concerning on TASI indicate that diversity of impervious surfaces (rooftops, concrete, and mixed asphalt) contribute most to the SUHI, among all of the land cover features. Moreover, the effect of impervious surfaces on LST is complicated, and the composition and arrangement of land cover features may play an important role in determining the magnitude and intensity of SUHI. Overall, the analysis of urban thermal signatures at two spatial scales complement each other and the use of airborne imagery data with higher spatial resolution is helpful in revealing more details for understanding urban thermal environments.

DOI

[21]
张建明,王鹏龙,马宁,等.河谷地形下兰州市城市热岛效应的时空演变研究[J].地理科学,2012,32(12):1530-1537.lt;p>基于1999 年和2010 年的Landsat ETM+和TM影像, 以单窗算法反演了兰州市地表温度, 研究兰州市最近10 a 的城市热岛时空分布以及演变特征。研究结果表明:兰州市城市热岛的空间分布与延展与城市建城区的扩展相一致, 热岛范围不断扩大, 次中温和中温区大面积减少, 相应的次高温和高温区大面积增加, 热岛强度明显增强;除了城市下垫面覆盖类型, 黄河低温带亦逐渐成为影响城市热岛分布的重要因子。各土地利用类型的平均温度均有所升高, 建设用地和未利用地温度最高, 对热岛效应贡献最大, 是城市热岛的主要贡献因子, 绿地和水体能够很好的缓解热岛效应。地表温度和信息指数NDVI、MNDWI、NDBI、NDBaI在兰州市河谷空间格局上显著相关, 存在很好的对应关系。</p>

[Zhang J M, Wang P L, Ma N, et al.Spatial-temporal evolution of urban heat island effect in basin valley: A case study of lanzhou city[J]. Scientia Geographica Sinica, 2012,32(12):1530-1537. ]

[22]
牟雪洁,赵昕奕.珠三角地区地表温度与土地利用类型关系[J].地理研究,2012,31(9):1580-1597.利用安徽省1961~2010年气象观测资料和气象灾情资料,依据极端气候事件及主要气象灾害评估技术规范和相关标准,挑选主要气候事件及气象灾害评估指标。应用主成分分析方法确定各指标权重,通过综合加权分别构建年干旱、雨涝、低温冷冻害、高温、风雹及雾霾等气候异常指数评估模型和灾损模型。在此基础上,利用灰色关联方法构建气候年景模型,反演近50a安徽省年景指数序列,参照世界气象组织推荐的百分位数法划分气候年景等级阈值,分别取0~10%,10%~30%,30%~70%,70%~90%,90%~100%为好、较好、一般、较差和差气候年景。近50a来,1965年、1973年、1975年、1993年和1997年为好气候年景;1966年、1969年、1991年、1996年和1998年气候年景差。通过综合灾损模型以及相关气象灾害文献资料验证表明,气候年景评估方法和等级标准可以较好地反映年度气候的真实状况,可为省、市、县级区域的气候年景评估提供科技支撑。

[Mou X J, Zhao X Y.Study on the relationship between surface temperature and land use in Pearl River Delta[J]. Geographical Research, 2012,31(9):1580-1597. ]

Outlines

/