
Journal of Geo-information Science >
A Study of Urban Heat Island Intensity Based on “Local Climate Zones”
Received date: 2016-07-25
Request revised date: 2016-11-09
Online published: 2017-05-20
Copyright
In the context of city expansion and raise of awareness of climate change, urban planners are looking for methods and tools to take the urban heat island (UHI) into account. Urban heat island intensity (UHII) is an important metric used in measuring UHI effect. Nevertheless, its quantitative measurement has not yet been clearly addressed. Due to the limitation of meteorological stations either in number or location, the traditional method of calculating the temperature difference between urban and rural areas based on the meteorological station data fails to accurately describe the UHII of a city. In order to solve this problem, a classification schema “Local Climate Zones” (LCZ) was proposed by Steward and Oke. Nowadays, the satellite remote sensing imagery is widely used to reveal urban heat island phenomenon. Therefore, this paper applied the new framework of LCZ to the study of UHII in Fuzhou City, located in the center of the Fuzhou basin, southeast China, using remote sensing technology. Fuzhou City has witnessed a rapid urban expansion since the late 1970s. The fast expansion of the city has caused severe UHI phenomenon in the city. Thus, it has become the top one furnace city in China. This study reveals that LCZ based on remote sensing technology can effectively distinguish the thermal contrasts among all LCZ classes. Such contrasts are governed largely by height and spacing of buildings, pervious surface fraction, trees density and soil wetness. In addition, the LCZ can fully disclose the distribution patterns of UHI. In this study, we revealed a UHIILCZ of 6.73℃ for Fuzhou city on 27 September 2015, which indicates a significant UHI in the city.
Key words: urban heat island intensity; local climate zones; remote sensing; Fuzhou
LIN Zhongli , XU Hanqiu . A Study of Urban Heat Island Intensity Based on “Local Climate Zones”[J]. Journal of Geo-information Science, 2017 , 19(5) : 713 -722 . DOI: 10.3724/SP.J.1047.2017.00713
Fig. 1 Location of the study area and its Landsat 8 image (2015-09-27)图1 研究区位置及其Landsat 8影像(2015-09-27) 注:红色矩形柜区域为本文研究区 |
Tab. 1 Local climate zones scheme表1 LCZ分类体系[16] |
| 建筑类型 | 定义 | 土地覆盖类型 | 定义 |
|---|---|---|---|
 | 密集混合的高层建筑(10层以上);几乎无树木;不透水路面;建筑材质为混凝土、钢材、石头和 玻璃 |  | 茂密的落叶林和(或)常绿林;地表覆盖大量可透水面(低矮的植被);区域功能为天然林、苗圃林或城市公园 |
 | 密集混合的中层建筑(3-9层);几乎无树木;不透水路面;建筑材质为石头、砖、瓦片和混凝土 |  | 稀疏的落叶林和(或)常绿林;地表覆盖大量可透水面(低矮的植被);区域功能为天然林、苗圃林或城市公园 |
 | 密集混合的低层建筑(1-3层);几乎无树木;不透水路面;建筑材质为石头、砖、瓦片和混凝土 |  | 开阔分布的灌木、矮树丛和矮小的树木;地表覆盖大量可透水面(裸土或沙);区域功能为天然灌木林地或农用地 |
 | 开阔分布的高层建筑(10层以上);地表覆盖大量可透水面(低矮的植被、稀疏的树木);建筑材质为混凝土、钢材、石头和玻璃 |  | 草地或草本植物/作物。几乎无树木;区域功能为草地、农用地或城市公园 |
 | 开阔分布的中层建筑(3-9层);地表覆盖大量可透水面(低矮的植被、稀疏的树木);建筑材质为混凝土、钢材、石头和玻璃 |  | 岩石或不透水路面;几乎无植被;区域功能为天然荒漠(岩石)或城市交通运输干道 |
 | 开阔分布的低层建筑(1-3层);地表覆盖大量可透水面(低矮的植被、稀疏的树木);建筑材质为木头、砖、石头、瓦片和混凝土 |  | 土或沙;几乎无植被;区域功能为天然沙漠或农用地 |
 | 密集混合的单层建筑;几乎无树木;夯实的土质路面;轻质建筑材质(木头,茅草和波纹状板材) |  | 大面积开阔的水体,如海和湖;或小面积水体,如河、水库和池塘 |
 | 开阔分布的低层大型建筑(1-3层);几乎无树木;不透水道面;建筑材质为钢材、混凝土、金属和 石头 | 土地覆盖的可变特性 (因气候变化,农业耕作和季节循环所引起的土地覆盖特性的变化) | |
 | 自然环境中零散的中、小型建筑;地表覆盖大量可透水面(低矮的植被、稀疏的树木) | b 光秃的树木 | 冬季少叶落叶林 |
| s 积雪覆盖 | 积雪覆盖厚度大于10 cm | ||
 | 中低层工业建筑(塔、贮水池、堆积物);几乎无树木;不透水路面或夯实的土质路面;建筑材质为金属、钢材和混凝土 | d 干燥地表 | 焦土(如火烧迹地) |
| w 湿润地表 | 浸水土壤 | ||
Tab. 2 LCZ identification based on Landsat 8 and Google Earth images表2 研究区主要LCZ类别Landsat 8与Google Earth影像对照 |
| Landsat 8影像 | Google Earth影像 | Landsat 8影像 | Google Earth影像 |
|---|---|---|---|
| LCZ 1 密集高层建筑 | LCZ A 茂密树木 | ||
 |  |  |  |
| LCZ 2 密集中层建筑 | LCZ B 稀疏树木 | ||
 |  |  |  |
| LCZ 3 密集低层建筑 | LCZ C 灌木和矮树 | ||
 |  |  |  |
| LCZ 5 开阔中层建筑 | LCZ D 低矮植被 | ||
 |  |  |  |
| LCZ 8 大型低层建筑 | LCZ E 道路 | ||
 |  |  |  |
| LCZ 10 工业厂房 | LCZ F 裸土或沙 | ||
 |  |  |  |
| LCZ G 水体 | |||
 |  | ||
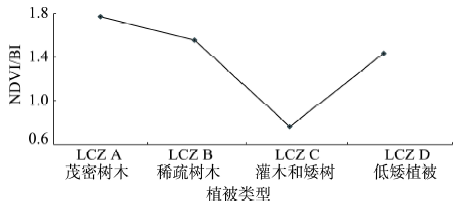
Fig. 2 Spectral signatures of NDVI/BI of LCZ vegetation types图2 LCZ植被类型NDVI/BI光谱特征曲线 |
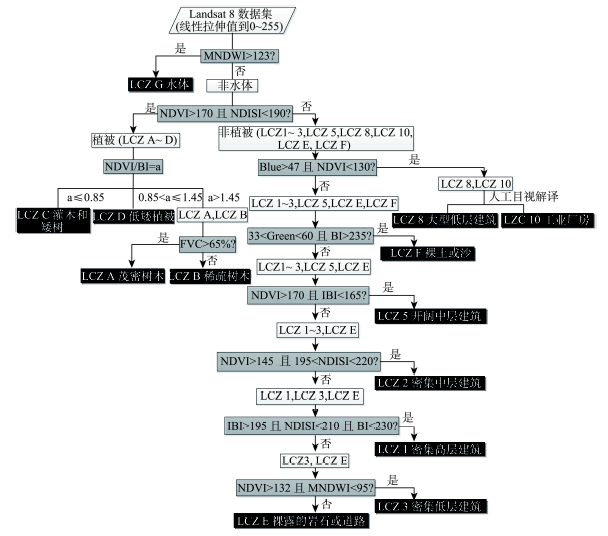
Fig. 3 Flow chart of the hierarchical classification of LCZ图3 LCZ遥感分层分类流程图 |
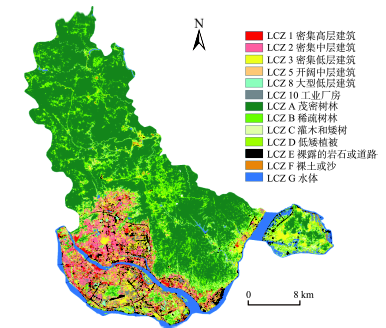
Fig. 4 LCZ classification image of the study area图4 研究区LCZ分类结果图 |
Tab. 3 Statistics of LCZ classification results表3 LCZ分类结果统计 |
| LCZ类型 | 研究区范围 | 建成区范围 | |||
|---|---|---|---|---|---|
| 面积/km2 | 比例/% | LST/℃ | 面积/km2 | 比例/% | |
| LCZ 1 密集高层建筑 | 21.29 | 2.10 | 37.38 | 19.48 | 8.42 |
| LCZ 2 密集中层建筑 | 68.01 | 6.71 | 39.67 | 64.44 | 27.86 |
| LCZ 3 密集低层建筑 | 52.62 | 5.19 | 39.23 | 33.52 | 14.49 |
| LCZ 5 开阔中层建筑 | 21.88 | 2.16 | 37.89 | 19.24 | 8.32 |
| LCZ 8 大型低层建筑 | 2.23 | 0.22 | 42.45 | 2.23 | 0.96 |
| LCZ 10 工业厂房 | 16.79 | 1.66 | 41.82 | 15.14 | 6.54 |
| LCZ A 茂密树木 | 546.41 | 53.92 | 28.24 | 4.61 | 1.99 |
| LCZ B 稀疏树木 | 78.22 | 7.72 | 28.64 | 6.31 | 2.73 |
| LCZ C 灌木和矮树 | 53.55 | 5.28 | 32.72 | 15.45 | 6.68 |
| LCZ D 低矮植被 | 44.52 | 4.39 | 32.94 | 8.61 | 3.72 |
| LCZ E 裸露的岩石或道路 | 30.47 | 3.01 | 39.23 | 22.33 | 9.65 |
| LCZ F 裸土或沙 | 14.66 | 1.45 | 37.96 | 9.38 | 4.06 |
| LCZ G 水体 | 62.76 | 6.19 | 29.05 | 10.56 | 4.57 |
| 合计 | 1013.41 | 100.00 | - | 231.33 | 100.00 |
Tab. A Confusion matrix for LCZ classification results附表A LCZ分类误差矩阵 |
| 验证数据 | ||||||||||||||||
|---|---|---|---|---|---|---|---|---|---|---|---|---|---|---|---|---|
| LCZ类型 | 1 | 2 | 3 | 5 | 8 | 10 | A | B | C | D | E | F | G | 行合计 | 使用者精度/% | |
| 分类数据 | 1 | 84 | 9 | 0 | 0 | 1 | 1 | 0 | 0 | 0 | 1 | 4 | 0 | 15 | 115 | 73.04 |
| 2 | 8 | 173 | 9 | 4 | 0 | 3 | 0 | 0 | 3 | 0 | 9 | 1 | 0 | 210 | 82.38 | |
| 3 | 1 | 15 | 88 | 0 | 2 | 4 | 0 | 1 | 0 | 0 | 4 | 6 | 0 | 121 | 72.73 | |
| 5 | 1 | 12 | 0 | 39 | 0 | 2 | 0 | 0 | 2 | 1 | 1 | 1 | 0 | 59 | 66.10 | |
| 8 | 0 | 0 | 0 | 1 | 13 | 0 | 0 | 0 | 0 | 0 | 0 | 0 | 0 | 14 | 92.86 | |
| 10 | 0 | 4 | 5 | 0 | 0 | 34 | 0 | 0 | 0 | 0 | 2 | 0 | 0 | 45 | 75.56 | |
| A | 0 | 0 | 0 | 0 | 0 | 0 | 236 | 14 | 4 | 0 | 0 | 0 | 0 | 254 | 92.91 | |
| B | 0 | 0 | 0 | 0 | 0 | 0 | 4 | 29 | 8 | 1 | 0 | 0 | 0 | 42 | 69.05 | |
| C | 1 | 0 | 0 | 4 | 0 | 0 | 0 | 4 | 52 | 2 | 0 | 2 | 3 | 68 | 76.47 | |
| D | 2 | 0 | 0 | 0 | 0 | 0 | 0 | 1 | 2 | 37 | 0 | 0 | 1 | 43 | 86.05 | |
| E | 0 | 4 | 0 | 0 | 0 | 0 | 0 | 0 | 2 | 0 | 40 | 5 | 0 | 51 | 78.43 | |
| F | 0 | 2 | 2 | 0 | 0 | 3 | 0 | 0 | 0 | 0 | 0 | 28 | 0 | 35 | 80.00 | |
| G | 0 | 0 | 0 | 0 | 0 | 0 | 0 | 0 | 0 | 0 | 1 | 0 | 142 | 143 | 99.30 | |
| 列合计 | 97 | 219 | 104 | 48 | 16 | 47 | 240 | 49 | 73 | 42 | 61 | 43 | 161 | 1200 | ||
| 生产者精度/% | 86.60 | 79.00 | 84.62 | 81.25 | 81.25 | 72.34 | 98.33 | 59.18 | 71.23 | 88.10 | 65.57 | 65.12 | 88.20 | |||
| 总精度/% | 82.93 | |||||||||||||||
| Kappa系数 | 0.806 | |||||||||||||||
The authors have declared that no competing interests exist.
| [1] |
|
| [2] |
|
| [3] |
|
| [4] |
[
|
| [5] |
[
|
| [6] |
|
| [7] |
|
| [8] |
|
| [9] |
|
| [10] |
[
|
| [11] |
[
|
| [12] |
|
| [13] |
|
| [14] |
|
| [15] |
|
| [16] |
|
| [17] |
|
| [18] |
|
| [19] |
|
| [20] |
|
| [21] |
|
| [22] |
天气网.四大火炉新排名福州居首[N/OL]. 2014. .
|
| [23] |
|
| [24] |
|
| [25] |
USGS. Landsat 8 (L8) Operational Land Imager (OLI) and Thermal Infrared Sensor (TIRS)[OL]. , 2013.
|
| [26] |
|
| [27] |
|
| [28] |
|
| [29] |
|
| [30] |
|
| [31] |
|
| [32] |
|
| [33] |
[
|
| [34] |
[
|
| [35] |
|
| [36] |
|
| [37] |
|
/
| 〈 |
|
〉 |
