
Journal of Geo-information Science >
Research on the Spatio-temporal Visualization of Multiple Time Series Land Use Change by the Self-organizing Map
Received date: 2016-10-11
Request revised date: 2017-03-07
Online published: 2017-06-20
Copyright
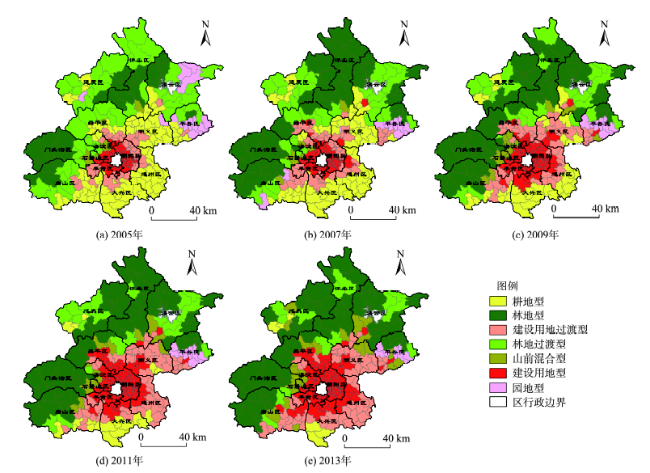
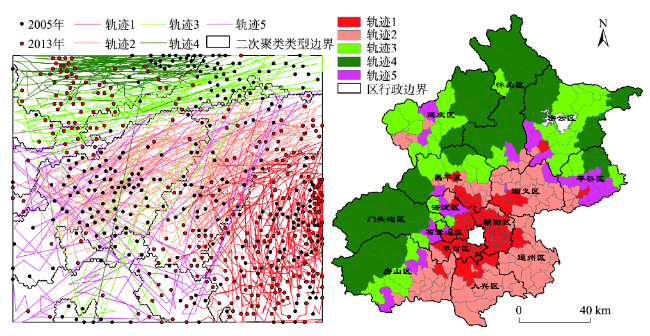
Analysis of multiple time series land use of spatio-temporal evolution at fine scale is a hot and important research area currently. In this study, the self-organizing map (SOM) neural network was used to analyze the land use spatio-temporal distribution at township-level in Beijing. The study was based on 5 periods of land use classification data of Beijing in 2005, 2007, 2009, 2011 and 2013. We implemented spatio-temporal integrated expression and comparative analysis of multiple time series land use data at township-level. Through creating and training self-organizing map neural network, we could find out the distribution of different land use types (built-up land, farmland, forest land, grassland, garden, water, and unused land) on the SOM output plane. This represented the proportional relationship of different land use types in land use structure. By second-step clustering and building land use change trajectory, we got the spatio-temporal evolution rules of the land use in township of Beijing. The results revealed that there were five land use change trajectories and three spatio-temporal evolution patterns in Beijing at township level. The plain area is developing to the land use structure of high built-up land proportion. The mountainous area is developing to the land use structure of high forest land proportion, and the land use change of piedmont zone is complex.
QI Jianchao , LIU Huiping , GAO Xiaofeng . Research on the Spatio-temporal Visualization of Multiple Time Series Land Use Change by the Self-organizing Map[J]. Journal of Geo-information Science, 2017 , 19(6) : 792 -799 . DOI: 10.3724/SP.J.1047.2017.00792
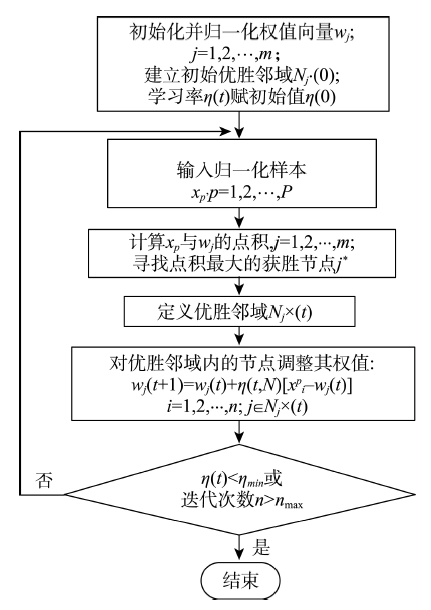
Fig. 1 Flow chart of SOM algorithm图1 SOM算法流程图 |
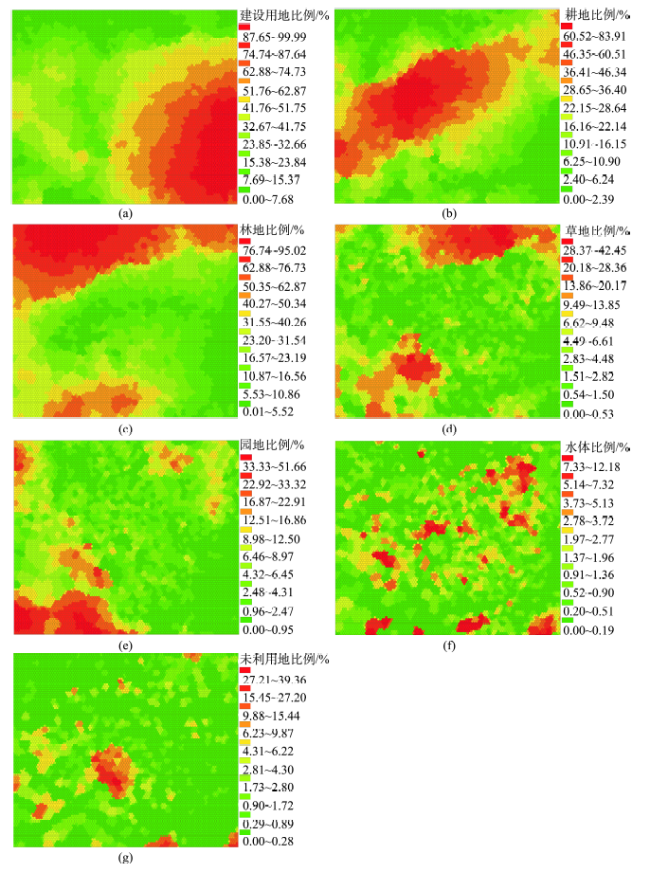
Fig. 2 Output component planes of SOM图2 SOM输出成分平面图 |
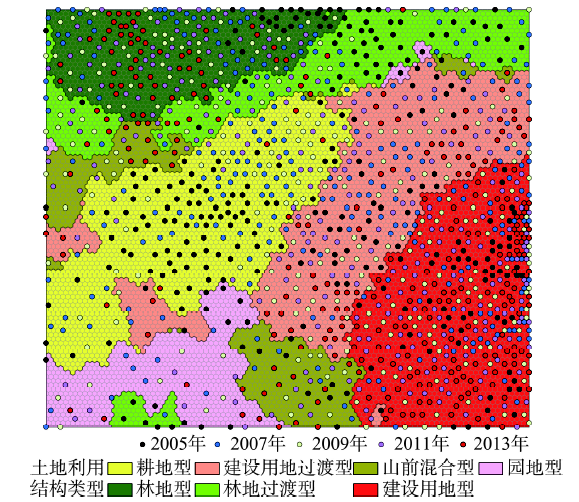
Fig. 3 Best matching unit and regional division of SOM output plane by second-step clustering图3 获胜神经元与二次聚类SOM输出面板区域划分 |
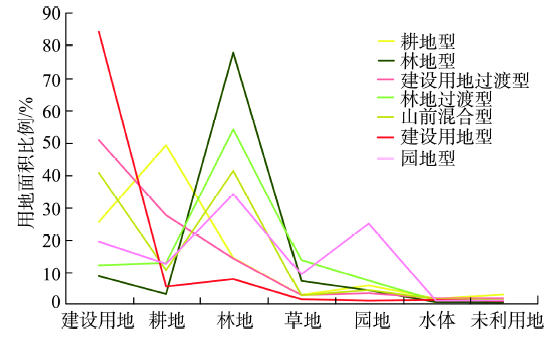
Fig. 4 Area ratios of different land use types in second-step clustering results图4 二次聚类结果(土地利用结构类型)中各用地类型所占比例 |
Fig. 5 Geospatial visualization of the second-clustering results of township from 2005 to 2013图5 2005-2013年各乡镇二次聚类结果在地理空间中的可视化 |
Fig. 6 Land use change trajectories and visualization图6 土地利用变化轨迹与可视化 |
The authors have declared that no competing interests exist.
| [1] |
[
|
| [2] |
[
|
| [3] |
|
| [4] |
|
| [5] |
[
|
| [5] |
|
| [7] |
|
| [8] |
[
|
| [9] |
[
|
| [10] |
|
| [11] |
[
|
| [12] |
|
| [13] |
|
| [14] |
[
|
| [15] |
|
| [16] |
|
| [17] |
[
|
| [18] |
|
| [19] |
|
| [20] |
|
| [21] |
|
| [22] |
|
| [23] |
|
/
| 〈 |
|
〉 |