Orginal Article

Fine-grained Population Estimation and Distribution Characteristics in Shanghai

  • LI Mingxiao , 1, 2 ,
  • CHEN Jie , 1, * ,
  • ZHANG Hengcai 1 ,
  • QIU Peiyuan 1 ,
  • LIU Kang 1, 2 ,
  • LU Feng 1
Expand
  • 1. State Key Laboratory of Resources and Environmental Information System, Institute of Geographic Sciences and Natural Resources Research, Chinese Academy of Sciences, Beijing 100101, China
  • 2. University of Chinese Academy of Sciences, Beijing 100049, China
*Corresponding author: CHEN Jie, E-mail:

Received date: 2016-08-01

  Request revised date: 2016-10-20

  Online published: 2017-06-20

Copyright

《地球信息科学学报》编辑部 所有

Abstract

Urban population distribution and its dynamic changes have been playing a key role in urban planning and management. Currently, the wide use of information communication technology (ICT) provides an opportunity to support fine-scale studies by acquiring accurate individual positioning data. By extracting regular individual trajectories from a mobile communication signaling dataset, this study established an estimation procedure of urban population distribution and quantitatively analyzed spatiotemporal characteristics of population distribution and migration in Shanghai. The results indicated that, firstly, mobile communication signaling data had the ability to describe the dynamic characteristics of urban population and to estimate the real population size of a city in a quantitative and relatively an authentic way by taking its advantages of wide sample coverage, high spatial resolution, good timeliness and multiple spatiotemporal scales. Secondly, population distribution of Shanghai on the whole is stable all day long. Comparatively, population at the daytime showed a more remarkable spatial agglomeration phenomenon than population at night. Thirdly, the population migration between urban functional areas and other areas is rare. During the rush hour in the morning and evening, the population migration was mainly depicted as a relatively equally both-way movements between central urban area and other new urban functional areas. Within each functional area, more than half of its population is not moving out. In conclusion, this study can be useful for urban planning, emergency management and public traveling information services.

Cite this article

LI Mingxiao , CHEN Jie , ZHANG Hengcai , QIU Peiyuan , LIU Kang , LU Feng . Fine-grained Population Estimation and Distribution Characteristics in Shanghai[J]. Journal of Geo-information Science, 2017 , 19(6) : 800 -807 . DOI: 10.3724/SP.J.1047.2017.00800

1 引言

人口分布是人口移动过程的空间表现形式,与社会经济发展息息相关[1]。人口分布统计数据广泛应用于城市规划、道路交通、环境保护、医疗卫生等领域。掌握不同时间不同空间城市人口密度的动态变化,探索城市人口移动特征及其演化规律,可为城市用地规划与交通规划、公共安全事件风险评估与应急指挥、商业选址与广告投放等提供重要的决策依据。广义上,人口分布涉及各种人口过程和人口现象的空间表现形式[1]。狭义上,人口分布特指人口数量的空间差异。本文从狭义的人口分布出发,研究城市人口的时空分布差异及其蕴含的人口移动特征。
现有人口分布的研究方法包括基于自然、社会经济数据推导的人口分布研究[2-4],基于多源遥感影像反演的人口分布研究[5-7]和基于移动目标(居民和交通工具等)离散出行轨迹或通讯频度推导的人口分布研究[8-12]。上述方法各有特色:① 基于自然、社会经济数据推导的人口分布研究虽然具有良好的空间覆盖度,但其空间尺度粗放,虽能在一定程度上提高人口分布估计的空间精度,但存在数据时效性滞后、更新周期长等问题。此外,当把社会经济数据与人口普查数据二者结合使用,存在的数据间时相不匹配、多统计口径不一致、数据拆分等问题会极大地影响人口分布估计精度。② 基于多源遥感数据反演的人口分布研究大幅提高了空间精度和时效性,但遥感数据获取受卫星过境时间限制,仅能反映部分时刻的人口分布情况,难以掌握人口分布特征的动态变化过程。③ 基于移动目标离散出行轨迹或通讯频度推导的人口分布研究通过获取大量用户的出租车轨迹、社交网络定位结果或移动通讯行为发生时所在基站位置,反映地理单元上人口分布的变化情况。该类数据仅能获取用户出行轨迹的片段,且获取的人口仅为人口总体中的一部分,存在人口采样偏差问题。
随着移动通讯技术的发展,移动通讯设备的 普及率已达到极高比例。截止2013年底,中国移 动电话用户数达11.06亿,移动设备普及率约81.3%,其中上海等特大城市移动设备普及率已达到126%[13-14]。移动通讯信令数据准确记录了移动通讯用户在移动通讯网络中活动时的通讯基站位置和活动的相关信息。当移动通讯终端产生开关机、通话或收发短信、访问移动互联网、甚至基站切换行为时,用户所关联的蜂窝基站及时间将被保存在信令数据中,辅之以蜂窝基站的精确坐标及其多个基站的信号交会方法,可以获取误差范围在市区500 m、郊区1000 m以内的用户位置信息[13,15]。移动通讯信令数据较全面地反映了用户的连续出行轨迹,具有样本数量庞大、样本相对其他数据源无 偏性较好,且支持定位精度以上多时空尺度自由切分的数据特点。移动通讯信令数据为精细时空尺度下人口分布动态特征分析提供了全新、优质、可靠的数据源,能有效支持动态人口分布估算及特征研究[13,16]
上海市是中国人口集聚能力最强的城市之一,城市人口长期保持净流入状态。目前,已有大量关于上海市人口分布变化时空特征的研究成果,包括都市区人口增长与分布规律[17-18]、人口未来情景预测[19]、就业空间格局变化[18,20-23]、城市空间结构演 变[13]、流动人口变化及聚集区空间分布规律[24-25]等。上述研究对于增进上海市人口分布时空特征及变化规律的认识具有重要价值,但已有研究多依据区县尺度分析,缺乏对精细时空尺度下的动态人口分布的系统认知,且无法全面、准确地反映上海市全天人口分布及时空变化特征。
鉴于此,本文以上海市人口为研究对象,基于移动通讯信令轨迹数据,开展全市域人口分布与人口移动特征分析,以期通过精细时空尺度下城市人口分布与移动的动态感知及量化分析,为上海城市规划、应急管理、交通出行等提供更加精准的科学依据。

2 研究区与数据源

2.1 研究区概况

本文以上海市为研究区。上海市是中国的经济、金融、贸易、航运中心。2010年11月完成的全国第六次人口普查结果显示上海市常住人口为2301.91万人。2015年上海市GDP为24 964.99亿元,蝉联中国城市第一。依据上海市“十一五”经济社会发展纲要,上海市城镇体系按照中心城和郊区2条主线,构建“1个中心城”和“9个新城”共10个城市功能承载区,如图1所示。
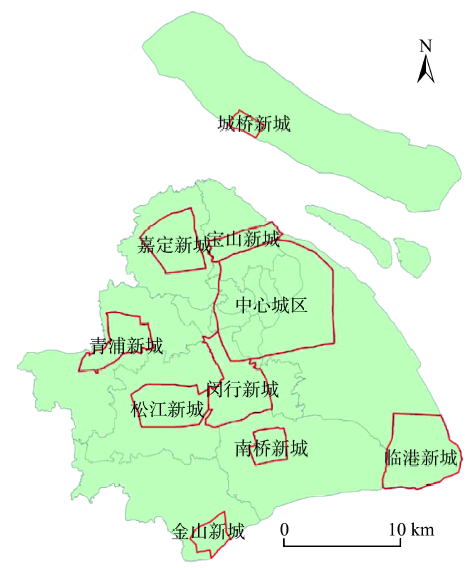
Fig.1 Urban functional areas in Shanghai

图1 上海城市功能承载区示意图

2.2 数据预处理

本文所用数据为匿名化处理后的某工作日上海移动通讯信令轨迹数据。该数据空间覆盖全上海市域,用户数逾1700万,信令数据记录量超过10亿条。每条记录包括用户ID、记录时间、所在位置经纬度及通讯事件类型。对于每个用户而言,一天的轨迹为 T = ( ( x 1 , y 1 , t 1 , e 1 ) , ( x 2 , y 2 , t 2 , e 2 ) , , ( x n , y n , t n , e n ) ) ,其中ti为记录时间,(xi, yi)为地理坐标, e i 为事件类型。该数据的空间定位精度为上海市移动基站小区,基站小区空间覆盖范围半径在市区约 100~500 m、郊区约400~1000 m[15],平均时间间隔约30 min。
本文面向全上海市域人口分布研究需求,以公里格网为空间单元、一小时为时间间隔,对轨迹进行时空重采样,生成用户轨迹表示为 T = ( Gi d 1 , t 1 , Gi d 2 , t 2 , , Gi d 24 , t 24 ) 。对重采样后各空间单元移动通讯信令轨迹数进行统计,同时依据上海市移动公司市场渗透率对各空间单元手机用户数进行反演,将手机用户数近似为人口规模,获取城市人口分布时空图谱,并在此基础上开展上海市人口分布时空特征分析。

3 上海市人口分布时空特征

3.1 上海市总体人口规模估算

城市人口规模是城市地理研究、城市规划编制以及城市发展政策制定过程中所必需的一个基本数量指标。以往多借用人口普查数据,但受普查员入户查点询问、当场填报资料的数据获取手段限制,人口普查数据难以准确表达实际的城市人口规模。移动通讯信令数据记录了移动通讯用户在移动通讯网络中活动时的所在城市位置,依据城市内移动通讯信令用户数量和用户市场渗透率计算潜在手机用户数量,可将其近似为城市人口规模,成为一种快速、有效的城市人口规模调查方式。
考虑夜间人口相对稳定,研究以夜间用户数量均值1619.75万人作为基数,结合当前上海市移动公司约65%的用户市场渗透率(①2012年中国移动上海分公司市场部调查。),计算得到上海市夜间实际人口规模为2491.92万人。而据全国第六次人口普查数据显示,上海市常住人口数为2301.91万人。二者相差190.01万人。

3.2 上海市人口分布时空演化

基于移动通讯信令反演获取的人口分布结果较人口普查和灯光遥感反演方法具有更高的时空分辨率。采用移动通讯信令数据,分析得出上海市公里格网级每小时人口密度时空图谱,某工作日2时、6时、10时、14时、18时、22时等典型时段人口动态分布特征如图2所示。可以看出,上海市不同时刻的人口分布在早晚高峰前后发生显著变化,白天、夜晚各时段人口分布基本保持不变。人口密集区域在地理空间上呈稳定分布态势,密集区域与中心城区及新城范围大致相符且在不同时段基本保持稳定。得益于上海市城镇体系规划导向、中心城区产业转移和各自新城产业发展,松江新城、闵行新城、南桥新城等城市新城在各时段均表现出较为明显的人口聚集,总体呈现出“一核心、多组团”的网络化城乡空间格局。
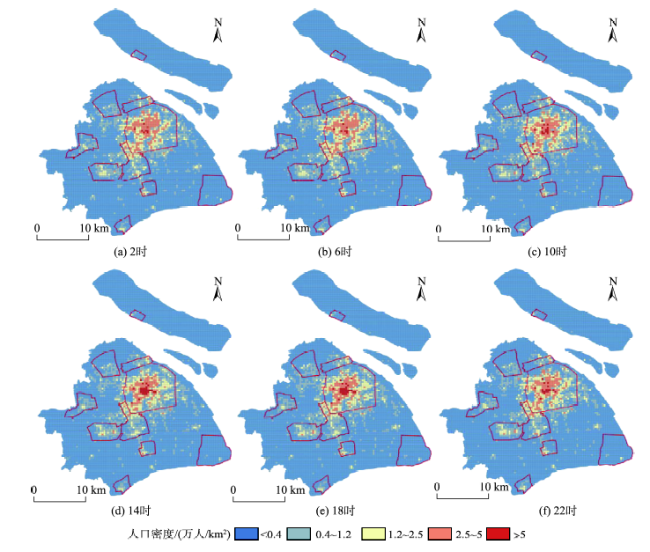
Fig. 2 Spatio-temporal mapping of population density in Shanghai (one weekday)

图2 上海市人口密度一日时空图谱(某工作日)

3.3 上海市昼夜人口空间分布

城市昼夜人口的空间分布是透视城市发展的重要窗口,掌握上海市昼夜人口的空间分布特征有助于深入了解上海市各片区的城市功能。本文分别选取夜间、日间人口密度变化最小的2时和14时作为夜间和日间代表时段,分析上海市昼夜人口分布特征。
从人口规模来看,上海市中心城区及新城昼夜人口规模如表1所示。可以看出,嘉定新城、青浦新城由于其空间位置距中心城区较远,产业发展较为成熟,对周边地区居民具有较强吸引力,昼夜人口比略高;闵行新城和宝山西新城由于空间位置靠近中心城区,承担部分中心城区卧城功能,昼夜人口比略低;上海市中心城区及其它新城昼夜人口比均接近于1,说明各区域城市功能具有混合性质,昼夜间人口输入输出相对平衡。
Tab.1 The day and night population size of central urban area and new urban areas in Shanghai

表1 上海市中心城区及各新城昼夜人口规模

区域 白天人口/万人 夜间人口/万人 昼夜人口比/%
中心城区 1109.30 1061.71 104.48
南桥新城 28.30 28.09 100.75
松江新城 92.87 89.67 103.57
闵行新城 145.16 152.73 95.04
嘉定新城 39.44 35.11 112.33
青浦新城 45.00 42.31 106.36
宝山新城 38.25 40.36 94.77
城桥新城 5.75 5.72 100.52
金山新城 18.94 19.54 96.93
临港新城 21.05 20.52 102.58
从空间分布特征角度来看,上海市人口昼夜空间分布特征差异主要体现在上海市中心城区。日间,上海市中心城区人口存在明显的空间集聚中心,即人民广场区域;人口高值区域较多且分布集中,人口密度呈明显的环状结构向外递减。夜间,人口高值分布较为破碎且数量较少,人口由日间高值区域向较高区域迁移。与日间人口分布相比,夜间人口较高密度区域和中密度区域范围更广泛,人口集中程度较低。

4 上海市人口移动时空特征

人口分布时空变化的背后,蕴含着不断的人口移动。移动通讯信令数据为全面、准确、量化地研究城市人口移动提供了可能。在上海市人口分布时空特征分析的基础之上,为了深入解读不同时段上海市人口分布变化的时空过程,本文重点分析不同时空层次上的上海市人口移动特征。

4.1 上海市功能承载区内外人口移动特征

由上海市中心城区和各个新城构成的城市功能承载区在上海市人口聚集中占据了重要位置。依据基于移动通讯信令反演获取的人口分布结果,城市功能承载区土地面积仅占上海市全市面积的31.38%,而24 h人口占比稳定且高达72.61%~73.51%。基于移动通讯信令数据较全面地反映用户的连续出行轨迹的数据特性,本文借鉴人口学中迁移率[26]概念,计算各个时刻上海市城市功能承载区与其它区域之间的人口移动率,结果如图3所示。其中,红色代表人口由其他区域流入城市功能承载区,蓝色代表人口由城市功能承载区流入其它区域。可以看出,城市功能承载区内外人口移动呈现明显的早晚双峰结构。此外,各时刻人口流出、人口流入比率大致相当,且总流动率均小于10%,表明上海市城市功能承载区与其他区域之间人口移动很少。
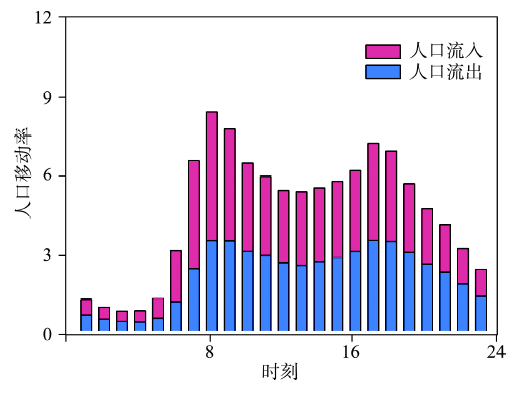
Fig. 3 The ratios of inflow and outflow population between urban functional areas in Shanghai

图3 上海市城市功能承载区内外的人口移动率

4.2 上海市功能承载区内人口移动特征

进一步地,针对各个城市功能承载区,研究选取早晚高峰时段,计算上海市城市功能承载区内部人口流动OD矩阵,其结果如图4所示。其中,红色/蓝色箭头代表两地之间人口流量较多/较少的方向,箭头粗细反映两地之间人口的流量大小。可以看出,上海市功能承载区内部人口移动主要体现为中心城区与各个新城之间的人口移动,除闵行新城承担次级中转中心功能吸引部分人流外,新城之间人口移动较少。
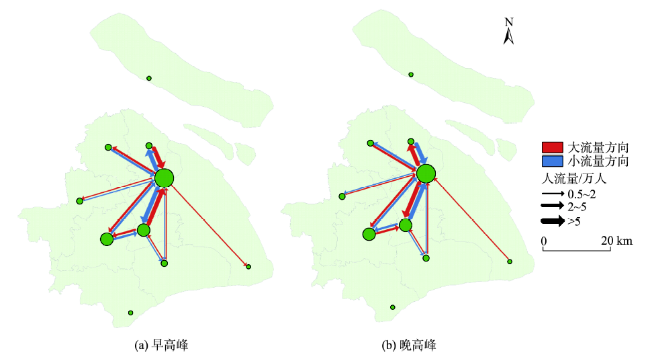
Fig. 4 The population movement within urban functional areas in Shanghai

图4 上海市城市功能承载区内部人口移动

为分析各个通道双向人口移动不平衡程度,定义通道不平衡性系数为大流量方向人流量和小流量方向人流量的比值[22],分析结果如表2所示。分析发现,除临港新城与嘉定新城由于学校或产业由中心城区向新城迁移导致中心城区与两新城通道不平衡系数略大于1.4外,其他通道不平衡系数均较低,反映出上海市早晚高峰时段中心城区与新城间双向人口流量近似的人口移动特征。此外,针对各城市功能承载区区内人口移动轨迹的统计发现,上海市所有城市功能承载区内均有超过半数的人口全天仅在其所在城区内部活动,未跨出城区一步,该结果在一定程度上体现出上海市各城市功能承载区在满足区内人口基本生活的各项功能发展方面已相对健全与完备。
Tab.2 The unbalanced factor of the main channels of population movement in Shanghai

表2 上海市人口移动主要通道不平衡系数

主要通道 不平衡系数(早高峰) 不平衡系数(晚高峰)
中心城区-闵行新城 1.352 1.389
中心城区-宝山新城 1.269 1.166
中心城区-松江新城 1.181 1.144
中心城区-嘉定新城 1.582 1.518
中心城区-青浦新城 1.366 1.378
中心城区-南桥新城 1.022 1.071
中心城区-临港新城 2.115 2.174
闵行新城-南桥新城 1.111 1.049
闵行新城-松江新城 1.236 1.172

5 结论与讨论

城市精细尺度的人口分布状况对于理解城市社会、经济、环境的发展现状及规划其未来发展方向均具有十分重要的意义。移动通讯信令数据记录了城市人口移动行为,具有时空精度高,样本覆盖面广,且支持定位精度以上多时空尺度自由切分的数据特点,为研究精细时空尺度城市人口分布提供了新的研究方案。本文依据移动通讯信令的轨迹数据,依托时空重采样,实现了城市精细尺度人口分布时空估算的方法流程,通过搭建大数据并行计算平台以实现TB级移动通讯信令数据管理。同时,以上海市为研究区,定量化地分析了上海市人口分布特征及人口移动过程。结果表明:① 在数据方面,基于移动通讯信令数据估算城市人口分布的方式样本覆盖广、时空精度高、支持时效性较强且时空尺度灵活多变的应用研究需求,能够定量地描述城市人口分布时空动态特征且能推算城市真实人口规模;② 在人口分布时空特征方面,在全市域尺度上,上海市各时段人口空间分布分布较为稳定且差异较小;在中心城区,日间人口较夜间人口呈现更为显著的空间集聚特征;③ 在人口移动时空特征方面,城市功能承载区与其他区域之间人口移动很少;早晚高峰期间,各城市功能承载区之间人口移动均体现为中心城区与其它新城之间的移动,且2个方向移动人数较为平衡;各城市功能承载区内均有超过半数的人口全天仅在其所在城区内部活动。本文通过精细时空尺度下城市人口分布与移动的动态感知及量化分析,为上海城市规划、应急管理、交通出行等提供更精准的科学依据。
目前,有关精细尺度下的城市人口分布研究仍处于发展探索阶段:① 在研究数据的代表性方面,仅获取上海市移动公司信令数据,在估算人口时采用上海市移动公司市场渗透率进行估算,以手机用户数近似为实际人口规模,暂未考虑各通讯公司在不同区域市场渗透率的差异和低龄幼儿、高龄老人等非潜在手机用户群体对人口规模的影响;② 在研究数据的预处理过程中,如何彻底去除因移动通讯信令“乒乓效应”所致的定位误差、如何识别同一用户携带多部手机所致的数据冗余等问题有待更合理地解决;③ 在研究尺度的选择方面,移动通讯信令数据定位精度受基站密度影响,在城市核心区域定位精度较高,而郊区定位精度较低。如何兼顾不同区域的定位精度、选择合适的时空尺度开展人口分布研究需要深入探索;④ 在数据抽样规模方面,大数据时代为城市精细尺度人口分布研究带来了机遇,然而海量时空轨迹数据的快速处理并非易事。本文选取的某一工作日的移动通讯信令数据在多大程度上表征一般性的人口分布时空特征,还有待进一步验证。

The authors have declared that no competing interests exist.

[1]
张善余. 人口地理学概论(第三版)[M].上海:华东师范大学出版社,2013.

[ Zhang S Y.Population Geography (The Third Edition)[M]. Shanghai: East China Normal University Press, 2013. ]

[2]
闫庆武,卞正富,张萍等.基于居民点密度的人口密度空间化[J].地理与地理信息科学,2011,27(5):95-98.提出了一种基于居民点密度的人口密度空间化方法.以江苏省人口数 据空间化为例,在采用核密度估计法得到江苏省镇(乡、街道)居民点密度后,运用基于居民点密度的人口密度空间化计算公式获得江苏省1 000 m×1 000 m的人口密度格网图,结果表明:江苏省人口分布的热点地区正是在建的三大都市圈(苏锡常都市圈、南京都市圈和徐州都市圈),其中苏锡常都市圈的人口分布呈 现各向异性,而南京和徐州都市圈的人口分布则表现为各向同性;人口密度不仅取决于居民点密度,还与平均每个居民点的人口数密切相关,居民点密度大的区域的 人口密度不一定大,居民点密度小的区域的人口密度也不一定小.

[ Yan Q W, Bian Z F, Zhang P, et al.Census Spatialization Based on Settlements Density[J]. Geography and Geo-Information Science, 2011,27(5):95-98. ]

[3]
Krunić N, Bajat B, Kilibarda M.Dasymetric Mapping of Population Distribution in Serbia Based on Soil Sealing Degrees Layer[M]. Surface Models for Geosciences. Springer International Publishing, 2015:137-149.

[4]
Alahmadi M, Atkinson P, Martin D.Estimating the spatial distribution of the population of Riyadh[J]. Saudi Arabia using remotely sensed built land cover and height data. Computers, Environment and Urban Systems, 2013,41:167-176.

[5]
Ural S, Hussain E, Shan J.Building population mapping with aerial imagery and GIS data[J]. International Journal of Applied Earth Observation and Geoinformation, 2011,13(6):841-852.Geospatial distribution of population at a scale of individual buildings is needed for analysis of people's interaction with their local socio-economic and physical environments. High resolution aerial images are capable of capturing urban complexities and considered as a potential source for mapping urban features at this fine scale. This paper studies population mapping for individual buildings by using aerial imagery and other geographic data. Building footprints and heights are first determined from aerial images, digital terrain and surface models. City zoning maps allow the classification of the buildings as residential and non-residential. The use of additional ancillary geographic data further filters residential utility buildings out of the residential area and identifies houses and apartments. In the final step, census block population, which is publicly available from the U.S. Census, is disaggregated and mapped to individual residential buildings. This paper proposes a modified building population mapping model that takes into account the effects of different types of residential buildings. Detailed steps are described that lead to the identification of residential buildings from imagery and other GIS data layers. Estimated building populations are evaluated per census block with reference to the known census records. This paper presents and evaluates the results of building population mapping in areas of West Lafayette, Lafayette, and Wea Township, all in the state of Indiana, USA. (C) 2011 Published by Elsevier B.V.

DOI

[6]
Azar D, Engstrom R, Graesser J, et al.Generation of fine-scale population layers using multi-resolution satellite imagery and geospatial data[J]. Remote Sensing of Environment, 2013,130:219-232.A gridded population dataset was produced for Pakistan by developing an algorithm that distributed population either on the basis of per-pixel built-up area fraction or the per-pixel value of a weighted population likelihood layer. Per-pixel built-up area fraction was calculated using a classification and regression trees (CART) methodology integrating high- and medium-resolution satellite imagery. The likelihood layer was produced by weighting different geospatial layers according to their effect on the likelihood of population being found in the particular pixel. The geospatial layers integrated into the likelihood layer were: 1) proximity to remotely sensed built-up pixels, 2) density of settlement points in a fixed kernel, 3) slope, 4) elevation, and 5) heterogeneity of landcover types found within a search radius. The method for weighting these layers varied according to settlement patterns found in the provinces of Pakistan. Differences in zonal population estimates generated from the 100-meter gridded population layer resulting from this study, Oak Ridge National Laboratory's LandScan (2002) , and CIESIN's Gridded Population of the World and Global Rural Urban Mapping Project (GPW and GRUMP) are examined. Population estimates for small areas produced using this paper's method were found to differ from census counts to a lesser degree than those produced using LandScan, GPW, or GRUMP. The root mean square error (RMSE) for small area population estimates for this method, LandScan, GPW, and GRUMP were 31,089, 48,001, 100,260, and 72,071, respectively.

DOI

[7]
Lung T, Lubker T, Ngochoch J K, et al.Human population distribution modelling at regional level using very high resolution satellite imagery[J]. Applied Geography, 2013,41:36-45.Modelling the distribution of human population based on satellite-derived information has become an important field of research, providing valuable input e.g. for human impact assessments related to the management of threatened ecosystems. However, few regional-scale studies have been conducted in developing countries, where detailed land cover data is usually absent, and the potential of very high resolution (VHR) satellite imagery in this context has not been explored yet. This study uses results obtained through object-based image analysis (OBIA) of QuickBird imagery for a subset of a highly populated rural area in western Kenya. Functions are established that approximate frequency distributions of QuickBird-derived locations of houses in relation to five factors. These factors are known to impact settlement patterns and data is available for the entire study area. Based on an overall probability coefficient (weight) calculated from the single functions, human population is redistributed at the smallest administrative level available (version A). In addition, the problem of artefacts remaining at administrative boundaries is addressed by combining the approach with the pycnophylactic smoothing algorithm ( Tobler, 1979 ) (version B). The results show distinct patterns of population distribution, with particular influence of rivers/streams and slope, while version B in addition is free of boundary artefacts. Despite some limitations compared to models based on detailed land cover data (e.g. the ability of capturing abrupt changes in population density), a visual and numerical evaluation of the results shows that using houses as classified from VHR imagery for a study area subset works well for redistributing human population at the regional level. This approach might be suitable to be applied also in other regions of e.g. sub-Saharan Africa.

DOI

[8]
Liu X, Wang J.The geography of Weibo[J]. Environment and Planning A, 2015,47(6):1231-1234.

[9]
Pan G, Qi G, Wu Z, et al.Land-use classification using taxi GPS traces[J]. IEEE Transactions on Intelligent Transportation Systems, 2013,14(1):113-123.Detailed land use, which is difficult to obtain, is an integral part of urban planning. Currently, GPS traces of vehicles are becoming readily available. It conveys human mobility and activity information, which can be closely related to the land use of a region. This paper discusses the potential use of taxi traces for urban land-use classification, particularly for recognizing the social function of urban land by using one year's trace data from 4000 taxis. First, we found that pick-up/set-down dynamics, extracted from taxi traces, exhibited clear patterns corresponding to the land-use classes of these regions. Second, with six features designed to characterize the pick-up/set-down pattern, land-use classes of regions could be recognized. Classification results using the best combination of features achieved a recognition accuracy of 95%. Third, the classification results also highlighted regions that changed land-use class from one to another, and such land-use class transition dynamics of regions revealed unusual real-world social events. Moreover, the pick-up/set-down dynamics could further reflect to what extent each region is used as a certain class.

DOI

[10]
Cranshaw J,Schwartz R,Hong J I,et al.The livehoods project: Utilizing social media to understand the dynamics of a city[C]. International AAAI Conference on Weblogs and Social Media. 2012:58-65.

[11]
Ratti C, Frenchman D, Pulselli R M, et al.Mobile landscapes: using location data from cell phones for urban analysis[J]. Environment and Planning B: Planning and Design, 2006,33(5):727-748.

[12]
Pierre D, Catherine L, Samuel M, et al.Dynamic population mapping using mobile phone data[J]. Proceedings of the National Academy of Sciences of the United States of America, 2014,111(45):15888-15893.During the past few decades, technologies such as remote sensing, geographical information systems, and global positioning systems have transformed the way the distribution of human population is studied and modeled in space and time. However, the mapping of populations remains constrained by the logistics of censuses and surveys. Consequently, spatially detailed changes across scales of days, weeks, or months, or even year to year, are difficult to assess and limit the application of human population maps in situations in which timely information is required, such as disasters, conflicts, or epidemics. Mobile phones (MPs) now have an extremely high penetration rate across the globe, and analyzing the spatiotemporal distribution of MP calls geolocated to the tower level may overcome many limitations of census-based approaches, provided that the use of MP data is properly assessed and calibrated. Using datasets of more than 1 billion MP call records from Portugal and France, we show how spatially and temporarily explicit estimations of population densities can be produced at national scales, and how these estimates compare with outputs produced using alternative human population mapping methods. We also demonstrate how maps of human population changes can be produced over multiple timescales while preserving the anonymity of MP users. With similar data being collected every day by MP network providers across the world, the prospect of being able to map contemporary and changing human population distributions over relatively short intervals exists, paving the way for new applications and a near real-time understanding of patterns and processes in human geography.

DOI

[13]
钮心毅,丁亮,宋小冬.基于手机数据识别上海中心城的城市空间结构[J].城市规划学刊,2014(6):61-67.

[ Niu X Y, Ding L, Song X D.Understanding urban spatial structure of Shanghai central city based on mobile phone data[J]. Urban Planning Forum, 2014,6:61-67. ]

[14]
Sanou B.The World in 2013: ICT facts and figures[R]. International Telecommunications Union, 2013.

[15]
冉斌. 手机数据在交通调查和交通规划中的应用[J].城市交通,2013(1):72-81,32.

[ Ran B.Use of cellphone data in travel survey and transportation planning[J]. Urban Transport of China, 2013,1:72-81,32. ]

[16]
王德,王灿,谢栋灿,等.基于手机信令数据的上海市不同等级商业中心商圈的比较——以南京东路、五角场、鞍山路为例[J].城市规划学刊,2015(3):50-60.利用手机信令数据,以上海市南京东路、五角场和鞍山路三个不同等级的商业中心为例对商圈进行合理地划分,分析和比较了不同等级商业中心的消费者数量的空间分布特征,并采取一定的可视化手段和空间统计指标对三个商业中心的等级性进行空间抽象,深入探讨不同等级商业中心的消费者空间分布特点.研究表明,不同等级商业中心在消费者分布范围、空间集聚性、对称性方面都存在较大差异.整体来看,从大范围覆盖的广域型高等级中心到依托局部高密度的地缘型低等级中心,形成了一种有序的商业中心空间体系.另外,也对这一特征的深层机制进行了剖析,并简要探讨了对商业网点规划的应用价值.

DOI

[ Wang D, Wang C, Xie D C, et al.Comparison of retail trade areas of retail centers with different hierarchical levels: a case study of east Nanjing Road, Wujiaochang, Anshan Road in Shanghai[J]. Urban Planning Forum, 2015,3:50-60. ]

[17]
高向东,吴文钰.20世纪90年代上海市人口分布变动及模拟[J].地理学报,2005,60(4):637-644.lt;p>利用上海市1990年第四次、2000年第五次人口普查资料,运用4种不同的方法划分上海市区,分析了上海市1990~2000年的人口分布变动,模拟了1990年和2000年的人口分布模型。结果表明:从1990年到2000年的10年中,上海中心城人口大量减少,郊区人口增加,人口郊区化显著,上海人口分布变动趋于均衡;上海人口的郊迁扩散方式,主要与同心圆式的环形道路与放射形道路作为基本骨架的城市建设格局有密切关系,尤其是受早已建成的内环线的影响;上海人口郊区化主要表现为近域推进, 1990~2000年的圈层人口密度变动曲线的相交点大约在5 km处,圈层人口密度变化主要在16 km之内;对人口分布模型的模拟则表明,上海人口分布虽然符合负指数函数模型,但不是最优模型,上海人口密度分布的最优模型是Cubic函数。</p>

DOI

[ Gao X D, Wu W Y.Population redistribution and modelling of Shanghai City in the 1990s[J]. Acta Geographica Sinica, 2005,60(4):637-644. ]

[18]
李健,宁越敏.1990年代以来上海人口空间变动与城市空间结构重构[J].城市规划学刊,2007(2):20-24.

[ Li J, Ning Y M.Population spatial change and urban spatial restructuring in Shanghai since the 1990s[J]. Urban Planning Forum, 2007,2:20-24. ]

[19]
王裕明,吉祥,刘彩云.上海市人口结构变化预测研究[J].上海经济研究,2014(3):89-98.

[ Wang Y M, Ji X, Liu C Y.Study on prediction of population change in Shanghai[J]. Shanghai Journal of Economics, 2014,3:89-98. ]

[20]
孙斌栋,魏旭红.上海都市区就业——人口空间结构演化特征[J].地理学报,2014,69(6):747-758.研究以非参数模型计量为基础,从集聚&mdash;分散维度和单中心&mdash;多中心维度刻画了上海都市区就业、人口空间演化特征,并与北京都市区的研究结果进行了横向比较。研究表明,上海都市区的就业和人口不断向外扩散,同时近、远郊均出现了稳定的再集中,就业和人口的空间多中心性都在增强。而北京只存在人口的分散化和多中心化,就业却呈现集中化和单中心化的态势。因而,上海都市区的就业&mdash;人口空间匹配程度高于北京。产业结构差异是造成北京、上海两地就业空间演化特征分异的原因之一,上海制造业比重高于北京,郊区的制造业集聚强化了近、远郊吸纳就业能力,促进了多中心空间结构的形成。北京和上海中心城区的就业、人口规模仍在扩张,导致近邻地区被包络在内,原有的次中心逐渐消失,因而,科学确定中心城区的增长边界,有效防止邻近蔓延,应当成为特大城市未来发展的关注重点。

DOI

[ Sun B D, Wei X H.Spatial distribution and structure evolution of employment and population in Shanghai metropolitan area. Acta Geographica Sinica, 2014,69(6):747-758. ]

[21]
丁亮,钮心毅,宋小冬.上海中心城就业中心体系测度——基于手机信令数据的研究[J].地理学报,2016,71(3):484-499.lt;p>利用手机信令数据识别上海市域内手机用户的工作地和居住地,获取就业者的通勤数据,测度上海中心城的就业中心体系.首先用就业者工作地数据生成就业密度分布图,基于中心城的就业密度识别就业中心.随后,用就业者工作地和居住地数据分别从就业密度和通勤联系两方面测度各中心的能级,分析各中心的腹地和势力范围.研究发现:① 上海中心城的就业中心呈主中心强大的弱多中心体系;② 就业密度越高的中心与其他地区的通勤联系一般也越强,但通勤联系在各中心间的差异更显著;③ 能级越高的中心腹地面积越大,但势力范围不一定越大;④ 相比于能级,职住功能混合度对职住平衡的影响更大;⑤缺少就业中心的地区势力范围呈交替状.本研究一定程度上能有助于解决既往就业中心体系研究因空间单元较大,缺少通勤数据在中心识别,通勤联系测度等方面受到的局限,希望能为构建上海中心城就业多中心体系提供帮助.</p>

DOI

[ Ding L, Niu X Y, Song X D.Measuring the employment center system in Shanghai central city: a study using mobile phone signaling data[J]. Acta Geographica Sinica, 2016,71(3):484-499. ]

[22]
张天然. 基于手机信令数据的上海市域职住空间分析[J].城市交通,2016,14(1):15-23.居民居住地与工作地的空间关系是城市空间布局的重要依据。基于手机信令数据,提出分区域的居民通勤距离和就业岗位通勤距离计算方法。通过对比验证了手机信令数据与居民出行调查数据的职住空间和距离分布特征较为吻合。重点分析上海市中心城区及周边地区的职住空间关系及通勤距离。提出职住通道平衡概念,并分析职住通道不平衡地区与轨道交通拥挤程度的关系,指出土地利用布局优化对职住通道平衡的重要性。通过分析不同新城的职住空间特征,探讨新城范围划定对统计分析的影响,总结了新城职住空间较为独立、居民内部就业率较高的特征。

DOI

[ Zhang T R.Job-housing spatial distribution analysis in Shanghai metropolitan area based on cellular signaling data[J]. Urban Transport of China, 2016,14(1):15-23. ]

[23]
许宁,尹凌,胡金星.从大规模短期规则采样的手机定位数据中识别居民职住地[J].武汉大学学报·信息科学版,2014,39(6):750-756.使用大规模手机定位数据获取居民职住地分布是大数据趋势下城市研究的新兴技术.然而,现有的研究主要使用了长期不规则稀疏采样的手机通话数据,对短期规则采样的手机定位数据缺乏尝试.基于大规模短期规则采样的手机定位数据,提出了一种居民职住地识别的方法.这是首次从大规模短期规则采样的手机定位数据中进行居民职住地识别的尝试,并对识别结果进行了较全面的验证.该研究成果为职住平衡等相关城市问题研究探讨了一种新型大规模数据源的可行性,在低成本大幅度提高相关研究的样本代表性和分析结果可靠性上具有重要意义.

DOI

[ Xu N, Yin L, Hu J X.Identifying home-work locations from short-term, large-scale, and regularly sampled mobile phone tracking data[J]. Geomatics and Information Science of Wuhan University, 2014,39(6):750-756. ]

[24]
罗仁朝,王德.上海流动人口聚居区类型及其特征研究.城市规划,2009(2):31-37.

[ Luo R C, Wang D.Types and characteristics of migrant communities in Shanghai. City Planning Review, 2009,2:31-37. ]

[25]
付磊,唐子来.上海市外来人口社会空间结构演化的特征与趋势[J].城市规划学刊,2008(1):69-76.

[ Fu L, Tang Z L.The social spatial structure of floating population in Shanghai and its evolution since the reform and opening-up. Urban Planning Forum, 2008,1:69-76. ]

[26]
吕晨. 人口的迁移与流动[M].广州:中山大学出版社,2014.

[ Lv C.The migration and movement of population[M]. Guangzhou: Sun Yat-sen University Press, 2014. ]

Outlines

/