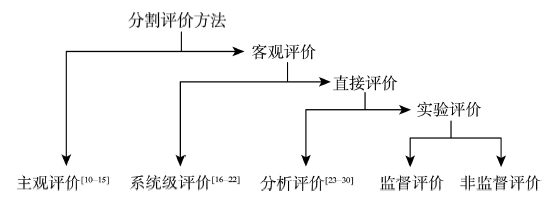
匹配完成之后就可以对匹配对象进行差异计算,学者们提出了多种评价指标对分割对象和分割参考对象的差异度进行度量,差异评价指标可以基于对象的形状、大小、位置、边界、灰度和分割、参考对象数量。差异的度量结果数值越大,分割结果和理想的标准分割结果偏差越大,说明在此类影像中该分割算法的性能较差。本文将目前常用的评价指标分为几何关系指标、数量指标、混合指标。
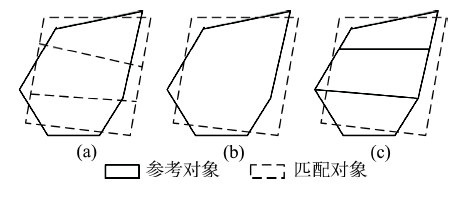
基于区域的测度指标主要是对参考对象和匹配对象之间的几何关系差异(Geometric Discrepancy)进行度量。几何关系包含3种基本类型,分别是重叠
、过分割
、欠分割
(
图4)。文献[37]、[40]-[42]对这3种几何关系进行了详细的定义和阐述。
Fig. 4 Geometric relationship between the reference object and the corresponding object图4 参考对象和匹配对象几何关系 |
Fram等
[43]和陈秋晓等
[44]基于区域重叠面积最大法选定与参考对象重叠面积最大的重叠对象进行匹配,通过将对象重叠区域定义为参考对象被正确分割的区域,定义了正确分割的百分数(Fraction of Correctly Segmented Pixels,FCSP)。该方法仅对参考对象的过分割现象进行了描述,但未对匹配对象的欠分割程度进行评价。
(8)
FCSP的取值与参考对象和分割对象之间的重叠面积呈正相关,取值范围为[0, 1]。FCSP值为1时,对应的影像分割效果最好。
与
FCSP类似,Lucieer等
[35]基于区域重叠面积最大法,针对对象之间的面积差异提出了面积匹配指数(Area Fit Index,AFI)。
(9)
式中:AFI的取值范围[-1,1],理想取值为0。AFI大于0表示分割对象分割过度,AFI小于0表示分割对象未分割完全。但当重叠面积占参考对象或匹配对象面积比较小时,对欠分割和过分割现象的评价并不可靠。
Zhan等
[45]定义了相似尺寸(SimSize)指标,对参考对象和匹配对象的尺寸(面积)相似程度进行评价。该方法仅考虑了面积相似度,在一对多的匹配关系下,当参考对象和多个匹配对象面积相似度相同但重叠面积不同时,显然重叠面积大的匹配对象分割结果更理想,但通过
SimSize值无法判断。
, (10)
式中:SimSize的取值在[0, 1]之间,最佳取值为1。
Moller等
[46]根据重叠区域面积占参考对象和重叠对象面积的比例,定义了相关区域指标(Relative Area in Sub-Object,
RAsub)(等价于FCSP),(Relatice Area in Super-Object,
RAsuper),对过分割和欠分割现象进行评价。
(11)
(12)
式中:RAsub和RAsuper的取值范围为[0, 1],取值越高分割结果越理想。
Weidner
[47]定义了质量合格率(Quality Rate,QR)。当参考对象和匹配对象的重叠面积等于对象并集的面积时二者完全重合,面积相似度达到最大,分割效果最好。与
FCSP和
AFI相比,
QR的计算不仅考虑了参考对象和匹配对象的重合面积,还考虑了二者面积的相似度,能更加客观的对二者的几何关系进行评定。
(13)
基于重叠区域的测度指标,计算简单,定义直观,是目前较为常用的评测指标。
Clinton等
[48]提出过分割比例(Over Segmentation,OS),对
RAsub和
RAsuper指标进行改进,将重叠对象替换为匹配对象,使用欠分割区域和过分割区域替代重叠区域,欠分割比例(Under Segmentation,US),通过过分割和欠分割区域面积占参考对象和匹配对象的面积的比例,对分割对象的的过分割欠分割程度进行度量。
(14)
(15)
OS和US通常组合为ED1使用,取值范围均为[0,1],取最佳值0时分别参考对象不存在过分割现象和匹配对象不存在欠分割现象。
分割后续的影像分类应用中,在分类器设计合理的情况下,过分割对象依旧可以被正确分类,不会对最终分类结果造成影响。但欠分割无可避免的会直接影响到分类精度
[47,42]。Liu等
[37]基于此特性对
US指标进行改进,提出潜在分割误差 (Potential Segmentation Error,PSE)。通过错误分类比例(欠分割区域面积/参考对象面积)间接对分割结果进行评价。
(16)
式中:PSE的取值范围均为[0, ],取最佳值0时参考对象不存在欠分割现象。
PSE和
NSR通常组合为
ED2(
表1)使用,
NSR和
PSE为同一量级时
ED2指数最可靠。
ED2指数同时对分割结果的几何差异和数量差异进行了度量,但当大量参考对象被过分割时,
NSR和
PSE的量级难以一致。此外,一对多过分割和多对一欠分割的共存也会导致
NSR指标的无效。因此,Yang 等
[49]对
NSR、
PSE、
ED2改进,基于局部欠分割比例和过分割比例的平均值,提出了过分割指标2 (OverSegmentation 2,OS2)、欠分割指标2 (Under-Segmentation 2,US2)。
(17)
(18)
式中:
OS2和
US2为归一化指标,取值范围均为[0, 1]。
OS2和
US3通常组合为
ED3(
表1)使用,可以对全局的几何差异和数量差异进行评价。
Tab. 1 Typical combined measures of supervised evaluation method表1 典型监督评价混合指标 |
| 指标 | 公式 | 组合 | 文献 |
| ED1 | | 欠分割和过分割指标 | Clinton[48] |
| ED2 | | 欠分割和数量指标 | Liu[37] |
| ED3 | | 局部欠分割和过分割指标 | Yang[49] |
| SEI |
| 基于双向匹配的局部欠分割和过分割指标 | Yang[38] |
| M | | 区域和距离指标 | Moller[46] |
| ADI | | 欠分割和过分割指标 | Cheng J[50] |
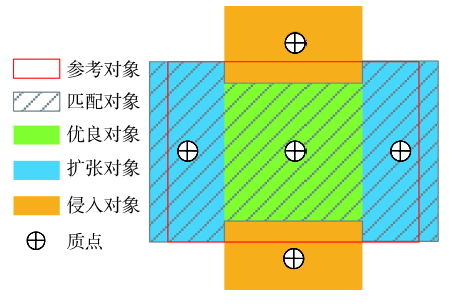
Cheng等
[50]基于Object-Fate匹配方法,定义Omission Error(OE)和Comission Error(CE)指标对参考对象和匹配对象的差异进行评价。
OE为侵入对象与参考对象重叠区域(过分割区域)与参考对象面积的比值。
CE为不与参考对象重叠的扩张对象面积(欠分割区域)与参考对象面积的比值。从计算原理的角度,
OE等价于
OS指标,
CE等价于
PSE指标。因此
OE和
CE为基于Object-Fate匹配方法的过分割指标和欠分割指标,并可与基于Object-Fate的数量差异指标组合使用。
(19)
(20)
基于过分割欠分割区域的评价测度可以直接对分割结果的过分割欠分割现象进行定量的反映。该指标不仅可以通过评价结果对分割方法的性能进行评价,比较不同分割方法的优劣,还可以依据分割结果欠分割和过分割程度对分割尺度进行调整,选取最优分割尺度。正因如此基于过分割区域和欠分割区域的测度指标逐步取代基于重叠区域的测度指标成为主流。
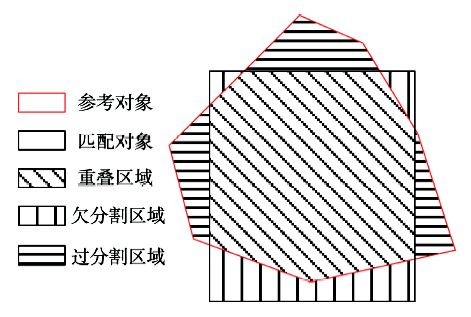
基于位置和边界的测度指标,是对参考对象和匹配对象之间的几何关系差异进行度量。不同于基于区域的测度指标通过重合、过分割、欠分割程度进行评价,基于位置和边界的指标通过对象间位置相似度和判断对象间边界吻合程度来评价分割结果的优劣。
Zhan等
[45]提出(Quality of Object Location,qLoc),以参考对象和匹配对象的质心距离作评价对象之间的位置相似程度。
(21)
式中:dist(a,b)为a,b之间的欧氏距离。qLoc的最小值即最佳取值为0,最大值取决于输入图像和所采用的分割方法和匹配方法。
Moller等
[46]基于
qLoc指标进行改进,提出相关位置指标 (Relative Poistion,RP),对
qLoc的结果进行归一化。
(22)
式中:RP的取值范围为[0,1],取值与位置相似度成正相关。
Cheng等
[50]提出(Position Discrepancy Index,PDI)距离差异指数,通过计算扩张对向和优良对象与参考对象距离的平均值,评价基于Object-Fate匹配方法对象的位置相似度。
(23)
式中:N、M为优良对象和扩张对向的数量;PDI的最小值即最佳取值为0。
基于位置的评测指标,原理简单,算法复杂度低。但该指标只对位置相似度进行评价,对分割结果的评价并不充分,在位置相似度完全一致时依然可能存在严重的过分割和欠分割现象。因此,该指标不能单独使用,需要与其他评测指标组合使用。
理想的匹配分割对象应当与参考对象在边界上完全重合,因此基于边界的评测指标可以单独使用,通过边界重合度和形状相似度直接对分割效果进行评价。该算法复杂计算量较大,且不适用于一对多或多对一的匹配情况。
Lucieer等
[35]提出基于基于距离指标(Distance-Based Measure,D),通过计算参考对象矢量边界上像素与匹配对象矢量边界上像元的最短欧氏距离来反应边界重合度。
PR、
PS分别为参考对象矢量边界和匹配对象矢量边界上的
N和
M个像元。
D的值越小边界重合度越高。
(24)
于欢等
[51]定义矢量距离指数(Vector Distance,VD):参考对象矢量边界和匹配对象矢量边界在横纵2个方向上的距离之和。
(25)
式中: 为第a条横向距离线的长度; 为横向距离线总数; 为第b条纵向距离线的长度; 为纵向距离线总数。距离线的间隔均为等距。VD的大小与分割效果负相关,当VD为0时,参考对象与匹配对象边界完全重合,分割效果最好。
刘大伟等
[52]提出形状相似度指标(Shape Similarity, SS),通过比较对象质心向边界所引射线长度差异的方式计算形状相似度,并进行了归一化处理。
(26)
式中: 为射线角度间隔,发出的总射线数为 ,记为N。 是质心以旋转角度 发出射线和边界交点与对象质心之间的距离。SS的范围为[0, 1],值越低参考对象和匹配对象的差异度越低,分割效果越好。
基于数量的指标是对参考对象和匹配对象的数量差异(Arithmetic Discrepancy)进行度量。对象的数量关系包括一对多、一对一和多对一,文献[37]对这3种数量关系进行了详细的定义和阐述。在分割结果理想的情况下,所有参考对象和匹配对象都应当是一对一的关系。
Strasters等
[53]提出破碎度(Fragmentation,FRAG)。
(27)
式中:m和v分别是参考对象和匹配对象的数量;p和q是尺度参数,需要根据实际情况和应用进行设定。FRAG的取值范围为[0, 1],取1时分割效果 最好。
Liu等
[37]提出分割比率数量(Number of Segments Ratio,NSR)。
式中:m和v分别是参考对象和匹配对象的数量。NSR值为0时,所有参考对象和匹配对象均一一对应,分割效果最好。NSR值越大,一对多或多对一的匹配数量关系越多,间接说明过分割或欠分割现象愈发严重。
E Schöpfer等
[39]基于Object-Fate匹配方法,提出后代忠诚度(Offspring Loyalty, OL)和干扰度(Interference, I),分割质量越好,优良对象占匹配对象的比重越高,入侵对象占全部分割对象的比重越低。
(29)
(30)
式中:n为对应对象的数量;OL和I的理想取值为 1和0。
在分割评价中,对数量关系差异的评价和对几何差异的评价同样重要。对于理想的分割结果,对象间几何差异一定很小,但较小的几何差异并不能保证理想的分割结果。在一些极端情况下,如所有匹配对象的大小均为一个像元时,匹配对象均与参考对象完全重叠,根据几何差异的定义并不存在过分割和欠分割现象,这显然是不合理的。因此基于数量的测度指标目前受到学者们广泛的重视,将其与基于区域的测度指标联合共同对分割结果评价是未来的趋势。
研究将多种不同类型的指标综合运用到监督分割评价当中,结合二者的优点,弥补各自的局限性,更加客观全面的对分割结果进行评价(
表1)。若指标没有严格的定义范围,或者范围与其它的指标处于不同量级,在组合使用之前需要进行规范化、标准化或归一化处理。
