Orginal Article

Study on Urban Green View Index

  • ZHANG Jiahui , 1, 2 ,
  • MENG Qingyan , 1, * ,
  • SUN Yunxiao 1 ,
  • SUN Zhenhui 1 ,
  • ZHANG Linlin 1
Expand
  • 1. Applied Earth Observation System Division, Institute of Remote Sensing and Digital Earth, CAS, Beijing 100101, China
  • 2. College of Resources and Environment, University of Chinese Academy of Sciences, Beijing 100049, China
*Corresponding author: MENG Qingyan, E-mail:

Received date: 2017-03-06

  Request revised date: 2017-04-05

  Online published: 2017-06-20

Copyright

《地球信息科学学报》编辑部 所有

Abstract

By identifying the research gap in the quantitative study of the visual quality of street landscape, a new Green View Index is proposed to assess the human-viewed street. The newly developed method describes the green-appearance area of street greenery that can be captured and its spatial distribution via simulating the real scene of the surrounding trees in the human eye field. Results indicate that the proposed Green View Index can reflect the impact of the size of tree canopy, layout of buildings, and distances between trees and viewers on the visual perception of street greenery in complex road scenes. The advantages of this method are as follows: by making full use of multi-source information, the green view of any location can be calculated with high precision based on automatic interpretation, which greatly reduces manual effort and errors and facilitates multi-regional comparative evaluation. The effectiveness of multi-source remotely sensed data in evaluating the visual effect has been proved, and the new Green View Index can be a relatively objective measurement in guiding urban landscape planning and management.

Cite this article

ZHANG Jiahui , MENG Qingyan , SUN Yunxiao , SUN Zhenhui , ZHANG Linlin . Study on Urban Green View Index[J]. Journal of Geo-information Science, 2017 , 19(6) : 838 -845 . DOI: 10.3724/SP.J.1047.2017.00838

1 引言

城市街道既是绿化设施与建筑空间交融的开敞地带,也是居民与植被景观发生视觉接触的公共场所[1]。街道绿色空间作为生态系统中的核心组成部分,在景观功能、生态功能、意向功能等方面起不可或缺的积极作用,其景观视觉价值的重要性也逐渐为人们所关注[2-3]。研究表明,不同的绿化面积和质量会带给人们不同的生理和心理感受[4]。作为构成街道绿色景观的主体可视化要素,行道树对提 升街道景致的吸引力与行人的步行体验有重要贡献[5]。良好的街景体验空间不仅体现了城市居民对居住环境的审美需求,还能带来感官上的愉悦,有利于维护身心健康[6-7]
传统城市绿化景观的评价研究多采用“绿地率”、“人均绿地面积”等指标,这些指标有利于从总体上把握城市绿地的数量特征,但无法从行人视角考量城市绿地资源享用的公平性与布局的合理性。“绿视率”理论最初由日本学者青木阳和野隆造提出,为衡量公共绿化的视觉效果提供了一种新视角。绿视率被定义为绿化面积在行人正常视野面积中所占的比例,反映行人对周围绿色环境的感知程度[8]。城市居住区绿视率的调查方法以实地拍摄照片为主,通过计算照片中绿色区域所占全图的比例获得[9-11]。但人工选点方式限制了采样数量,且拍摄方向不易把控,导致多区域间的调查结果无法相互对比,难以开展大范围的绿视率评价。国外有学者利用谷歌街景在街道侧竖立面信息展现上的优势,并结合图像分类技术,评估行人视角下对街道绿量的感知程度,在减少人力耗费的同时提升了操作效率[12-13]。但基于光谱特征的图像分类方法精度较低,算法适应性差。此外,无论是实地拍照还是街景图像下载,都会因镜头焦距和拍摄朝向等因素造成街道场景被“重复拍摄”或是“遗漏拍摄”,使多区域间的调查结果无法相互对比,从而影响最终结果的准确性[14]
“绿量”是指单位面积上绿色植物茎叶所占据的空间体积,而准确描述人感知行道树绿量的难点在于对视野范围内树冠真实场景的三维构建。激光雷达(LiDAR)作为一种快速捕捉地物形态的高精度立体扫描技术,使基于几何结构的树冠精细建模成为可能。本文提出一种“绿视量”指数,即计算在街道某位置处行人视角下所能捕获到的行道树绿色面积总和,指示街道场景下行道树绿量的可视化程度以及空间分布差异。通过研究匈牙利塞克什白堡市中心城区街道的绿视量,并根据行道树分布与绿视量计算结果的相关关系,对二者间存在的不一致性做了系统分析,分析结果进一步验证了绿视量指数的可靠性与实用性。

2 研究区与数据源

塞克什白堡市位于布达佩斯西南,费耶尔州首府。截止至2016年,该市人口已达100 570。本文选取该市的中心主城区作为研究区。研究区位于47°11′23″~47°11′57″N,18°24′23″~18°25′11″E,总面积1 km2。该区域地面绿化规模在一定程度上已接近饱和,绿化面积达27.83%,建筑面积占比28.39%。根据实地调研报告,行道树种类主要以梧桐(47.8%)、欧洲七叶树(19.4%)、花楸属(15.8%)为主,且树冠形态多为近似椭球体。
研究所用数据由德国TopoSys公司提供,其中航空影像由携带4个通道的推扫式相机获得,包括红、绿、蓝、近红外波段。与航拍传感器同时空工作的还有激光雷达扫描器,以保证二者数据在采集时的高时空匹配度。LiDAR原始点云数据每平方米4个激光点,经重采样后空间分辨率1 m,高程分辨率0.25 m。通过分离高程值较大的首次脉冲和高程值较小的末次脉冲数据,获得数字表面模型(DSM)与数字地形模型(DTM)。航空影像以处理后的DSM和DTM数据为基准,经过影像裁剪、几何校正、空间采样等预处理操作得到图像分辨率为1 m的研究区影像,确保图幅大小与地物位置同LiDAR栅格数据空间对应。

3 绿视量指数计算

绿视量的计算流程共分为4个步骤:① 基于机载LiDAR数据和航空影像提取树冠结构参数,还原行道树绿量主体真实形态;② 基于高分辨率遥感底图绘制路网,并随机布设若干采样点作为观察者的视线位置;③ 提取建筑物三维信息作为视域分析的视线障碍物,并应用视域分析法确定目视可及的行道树位置;④ 基于对行人的目视姿态估计及其与行道树的位置关系,计算绿视量。

3.1 树冠三维结构信息提取

树冠结构信息的提取主要包括:树冠高度模型构建、树顶位置提取和冠层三维结构反演。首先基于航空影像的红色和近红外波段计算得到NDVI,利用最大类间差算法(OTSU)确定NDVI最佳分割阈值,提取植被信息(图1(a))[15]。将植被二值掩膜图像叠加至数字高度模型,获得树冠高度模型(图1(b)),其中数字高度模型为DSM和DTM的作差结果。采用基于活动窗口的局部最大值搜索法,从树冠高度模型中提取单株立木的树顶位置及其高度[16]图1(c))。
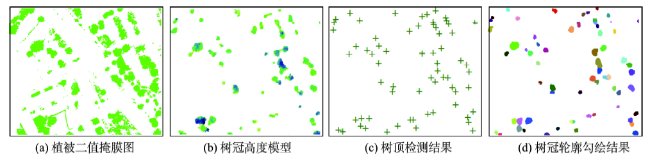
Fig. 1 Treetop extraction and canopy delineation results

图1 树顶与树冠轮廓边界提取结果

为获得冠层高度、冠径等结构参数,需要在树冠高度模型和树顶检测结果基础上进行树冠投影边界识别,分离单体树木并确定各自树冠的边界位置,本文应用辐条轮法检测树冠边界[17]。辐条轮算法通过构建一系列以树顶为中心的辐射线段,并逐一比较位于辐射线段上的像元和树顶像元的亮度差与全局亮度标准差的关系,从而确定边界所在位置。具体计算公式为:
| I ( p ) - I ( C i ) | σ W p , n , m ( 0 i 4 n ) (1)
式中: I ( p ) 为树顶点 p 的亮度值; I ( C i ) 表示截断点 C i 的亮度; σ ( W p , n , m ) 表示位于以树顶点 p 为中心、半径长 m n 条辐射线段上全部像素的亮度值标准差。通过逆时针依次连接各截断点,最终形成封闭多边形,实现单体树冠轮廓识别(图1(d))。
根据椭球树冠的几何结构关系,冠径和冠长作为重要的计算输入参数,分别由树冠面积与冠长率推算得出。对于冠半径的计算,假设冠部区域近似于圆形,则冠部半径可以通过圆的面积公式确定。对沿冠层边界点的高度取平均值,并从树顶高度减去平均树冠高度,得到冠长值。

3.2 路网与采样点布置

矢量路网地图基于高分辨率航空影像的人工数字化绘制生成,研究区内道路全长18 624 m。考虑到行人位于十字路口、道路转弯处相较于直道位置更容易发生视野变化,故将道路划分为折道与直道2种类型,并分别采取不同采样点布置策略。对于交叉路口和转折角度大于30°的位置,均布置采样点;对于直线型道路,以平均50 m的间隔随机生成采样点,即道路沿线相邻采样点的最短距离为50 m,确保因道路两侧地物分布变化而产生的视野变化可被捕捉。随机采样点的生成借助ArcGIS软件实现。研究区共布设360个采样点,这些采样点将作为观察点开展绿视量计算,其值代表行人位于街道不同位置时行道树的绿量可视程度。

3.3 建筑物提取与视域分析

行道树的配置数量决定了人们感知绿色植被的机会,但可见的行道树数量将直接影响行人的绿视量程度。对于等量的行道树配置,行人会因建筑物的遮挡而造成视线受阻,建筑物体积越大、数量越多、邻街分布越密集,对于行道树绿视量的影响也就越大。与此同时,建筑物对视线的阻碍程度也会随观察者位置的迁移而发生变化,空间分布相近的建筑物对于不同观察位置的视线阻碍能力不同,行道树的可视程度也随之改变。
鉴于行人行走在道路上的视野范围容易受周边地形的影响,而决定行道树是否可见的首要视线遮挡物是其邻域分布的建筑物。本文基于已生成的数字高度模型与植被掩膜图像,构建建筑物高度模型。首先使用高程阈值从经过植被掩膜后的图像提取建筑物,得到粗略的建筑物提取结果。但因粗略提取结果中存在大量的椒盐斑点(这些斑点显然不是建筑物),导致建筑物的轮廓不清,故采用中值滤波消除边界“锯齿现象”,得到边缘整齐清晰的建筑物轮廓。最终得到的建筑物高度模型包含单个独立建筑物的位置、面积、高度信息(图2)。通过均匀随机选取检验样本对建筑物分布图做精度验证,得到建筑物信息的提取精度为95.8%。
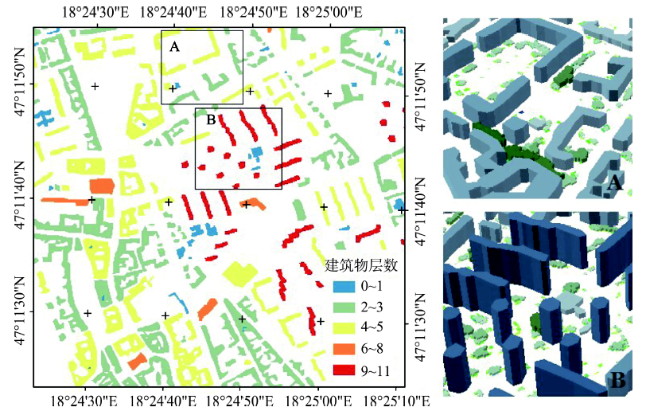
Fig. 2 Building extraction and 3D modelling results

图2 建筑物信息提取结果与三维建模示意图

为了分析行道树对于观察点的可见性,本文应用视域分析法[18],通过比较行道树与建筑物在观察点视线连线处的高度关系,从而建立已知观察点与树冠多点间的可视性关系。构建视域分析模型的输入参数包括:采样点分布图、树冠高度模型和建筑物高度模型。对每一个观察点构造其与邻域树顶点的视线,根据输入的树冠高度模型和建筑物高度模型,比较行道树与建筑物在观察点视线连线处的高度关系,判断视线的连通情况,建立已知观察点与树冠多点间的可视性关系,最终标记出各观察点对应的未被遮挡的行道树。本文中的视域分析借助ArcGIS 中的可见性分析工具实现。

3.4 行道树绿视量计算

行道树绿视量的计算基于对冠层椭球体形态的还原,通过对采样点与可见行道树的空间位置关系做几何运算,实现由“椭球体”冠层至“椭圆面”绿视量的视觉场景转换。图3显示了观察者与行道树的空间几何关系示意图。行道树绿视量具体计算方法如式(2)-(4)所示。
S = kπa a 2 b 2 a 2 co s 2 θ + b 2 si n 2 θ (2)
θ = arctan ( h t - b - h i ) d (3)
k = 1 90 ° arctan a h t - b - h i 2 + d 2 (4)
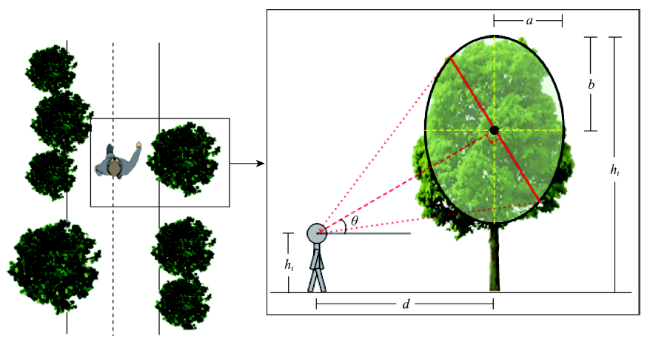
Fig. 3 Spatial and geometric relationship between the viewer and the tree canopy

图3 观察者与行道树的空间几何关系示意图

式中:S为单棵行道树在行人视角下冠层的侧视面积;abht分别为冠径、冠高半长和树顶高度,由树冠的三维结构决定; θ 为视线和水平线之间的夹角,即仰角;hi为视线的高程,设为视线均高1.7 m; d为观察者和行道树间的水平距离,基于航空影像提取获得;k为缩放系数,由于视角的大小决定了物体在视网膜上成像的大小,根据水平视角的冠径长度与视点到观察点距离的长度关系,对计算面积做缩放处理,取值范围是0-1,表示距离远近对绿视量造成的影响。
通过计算采样点目视可见范围内的全部行道树的绿视量之和,获得该位置处最终的绿视量计算结果。

4 结果与分析

4.1 绿视量结果评价与空间分析

街景数据不仅具有水平360°和垂直180°的全景视角范围,还展示了与人们感知街道绿量视角相似的侧视影像,因此本文以谷歌街景图片作为参考数据,采用空间抽样统计的方式验证不同位置处的绿视量计算结果。
抽样点的选取以道路为单位,以每隔两点抽取一点的方式获得验证点。全区共抽取85个随机点,每个验证点位置的街景图像通过调用谷歌地图API服务获得。采集数据时设置水平视角(FOV)为90°,选取东、南、西、北4个朝向(Heading)的影像便可覆盖全部水平视野范围。根据行道树位于行人视野的可视范围,垂直视角设为30°,以最大限度地模拟行人的感知行道树的视野范围。基于手动方式勾绘影像中树冠的竖立面轮廓,并统计树冠覆盖区内的像素数目,各个验证点的绿视量参考值即为4个方向所拍摄图像上绿色像元的总和。
检验结果显示,绿视量计算值与参考值间的相关系数R2为0.895(图4),说明行人绿视量可通过视觉场景建模生成,且计算结果精度较高,符合实际情况。
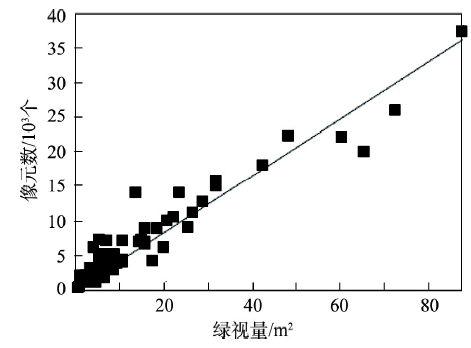
Fig. 4 A scatter plot of the calculated Green View Index vs the reference values

图4 绿视量指数精度验证结果散点图

图5展示了研究区绿视量计算结果的频数分布直方图和绿视量小于5 m2(黄色)和大于70 m2(绿色)的对应采样点位置。统计结果显示,研究区内44.72%的采样点绿视量小于15 m2,这些点集中分布在西南部区域。仅存在少数绿视量大于70 m2的样本点位于西北部地区,这意味着这些地区的行人相比于西南地区更可能享受到行道树所带来的绿色视觉体验。图6显示了研究区道路沿线360个样本点的绿视量分布图。红色实心圆点显示了样本点所在位置,圆点的大小表示绿视量的绝对数量关系。
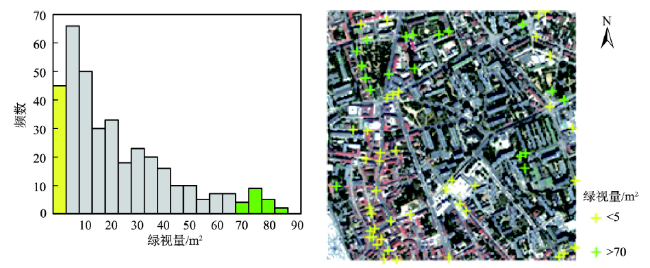
Fig. 5 Histogram of the calculation results with highlighted sample sites referring to their location

图5 绿视量计算结果频数分布直方图与对应采样点位置分布图

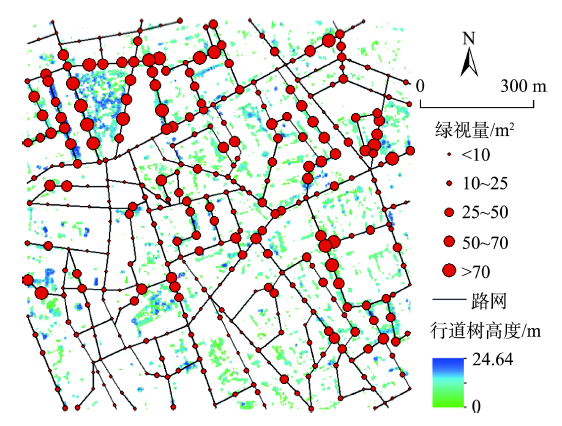
Fig. 6 Results of Green View Index calculation

图6 行道树绿视量计算结果

4.2 街道绿视量影响因子分析

对比图6中绿视量计算结果与行道树高度分布情况可以看出,不同等级的绿视量计算结果与行道树分布特征存在一定的空间匹配性,但在行道树高且密度大的区域周围仍存在较低的绿视量值。为了进一步分析研究区内行道树分布情况对绿视量的影响,本文定义4个描述行道树分布状况的指标:行道树数量(TTN)、树冠投影面积(TCA)、基于距离归一化的行道树高度加权平均值(ATH)、基于距离归一化的树冠侧视面积加权平均值(APA):并分别统计了各种指标在不同空间范围内与绿视量计算结果的相关性(表1)。
Tab. 1 Statistical analysis between Green View Index and canopy coverage variables

表1 绿视量计算结果与行道树分布状况相关性统计

空间范围 绿视量—TTN 绿视量—TCA 绿视量—ATH 绿视量—APA
可视区域 0.567 0.672 0.658 0.764
50 m缓冲区 0.391 0.443 0.401 0.589
100 m缓冲区 0.142 0.287 0.213 0.326
本文所提出的绿视量计算方法与传统度量指数的最大区别在于:传统手段通常将城市植被处理成平面斑块,而本文所提方法度量了行人侧视视角下行道树的可视面积。从表1中绿视量与TTN、TCA的统计结果可以看出,绿视量与行道树数量和树冠投影面积存在一定相关性,即观察点附近存在的行道树绝对数量越多、分布面积越大,行人在视觉上捕获行道树的机会随之增加。但这种关系并非绝对,研究区内仍存在一些拥有高绿视量的观察点周围树冠分布面积较低,分析原因是由于不同树种的冠径和冠高比例非固定量,从而导致了相同树冠面积因冠高不同,使得侧视视角下绿量的可视性呈现差异。上述结果表明,仅依靠植被二维分布信息不足以反映行人感知街道绿化的真实程度,而基于树冠三维形态结构还原的绿视量指数则更能捕获行人在侧视视角下的绿量可视度差异。同时,该指数还进一步考虑了行人仰视姿态对于绿量可视性的影响,行人与树冠的高度差异导致树冠的下边缘部分更容易被行人的视线捕捉。通过最大限度地还原行道树树冠在行人视野中的真实场景,绿视量指数的度量内容更贴近实际的行人目视感知。
除了行人视角的转换,造成绿视量与行道树分布的内部差异性的另一因素是建筑物对行人视线的遮挡。在检查研究区内绿视量值较低的观察点时,发现一些观察点周围不乏一定数量的行道树分布,对照建筑物分布图,显示这些位置大多被建筑群包围。这说明尽管行道树分布数量充足,但如果受建筑物遮挡而未出现在行人行进的视野中,仍会导致绿视量维持在较低水平,也解释了表1中绿视量与各指数的相关性随着缓冲区的扩大而降低的原因。上述分析表明,由于行人视野范围易受道路两旁分布的建筑物的约束,本文所提计算方法在视域分析阶段剔除不可见行道树,比构建缓冲区的传统方法更合理。
行道树距离观察点越远,不仅会造成视线遮挡的概率增大,反映在人眼成像效果上还会产生“近大远小”的透视感。表3中绿视量与ATH、APA的统计结果显示,经距离加权平均后的行道树高度与目视面积与绿视量的相关性更大。这说明行道树侧视面积越大,且距离行人越近,对绿量可视性效果的影响就越显著。绿视量指数基于成像原理,更客观地还原了目视效果差异,反映出行道树分布不均对绿视量造成的影响。

5 结论

本文从行人感知视角出发,提出了一种衡量城市行道树的绿量可视性的绿视量指数。该指数基于视觉场景分析,充分利用机载LiDAR数据在还原地物三维场景上的优势,最大程度地模拟了道路两侧的行道树绿色景观在行人视野中所占的面积,将真实物理场景从空间结构量化的角度去分析,使城市绿化的视觉质量具备量化可比性。
研究结果表明,在复杂城市街道景观中,除了行道树的分布面积和数量,建筑物分布、观察点与行道树的相对位置等因素也会直接影响行人对街道绿化状况的视觉感受。本方法综合考虑了行人仰视视角、建筑物对视线的遮挡,以及距离远近对观察点处绿量可视性的影响,相较于传统绿视率度量方法的优势在于:① 除路网地图和采样点布置仍需人工给定,其余全部计算过程均以自动化处理方式实现,所有输入参量可通过高分辨率航空影像和机载LiDAR数据获取,研究方法不仅能够自动提取城市行道树、建筑物,而且还能充分利用多源数据信息,实现绿视量的高精度计算,取代了传统手动提取拍摄照片绿色区域的繁琐步骤;② 基于计算机的自动解译方法不受人力和数据条件的约束,允许用户以更小的空间抽样尺度计算场景内任意位置的绿视量;③ 绿视量计算方法对可见行道树的识别完整率高,更能凸显不同树冠形态和目视距离对绿量可视性的影响,计算结果内部差异性大,可分性好;④ 有效规避了传统绿视率计算过程中“照片拍摄覆盖不全”和“街景数据重复覆盖”等问题,减少了数据源的引入误差,提升了计算结果的准确性与一致性,可用作多区域间的对比评价。
基于多源遥感的城市绿视量指数能客观地度量行人在道路场景下实际捕获到的行道树绿色可视量,以及这种目视接触概率的空间分布特征。作为一种精度高、易理解、可操作性强的度量手段,绿视量指数在准确判断城市行道树配置数量的同时,还能协助认知城市绿地服务水平不足的区域,从行人角度为街道绿化的合理布局和空间结构优化提供依据;同时,作为衡量人对城市居住环境感知的重要参量,街道绿视量计算使城市绿地视觉价值得到定量化表达,可为城市绿地规划设计、居住区视觉生态设计等工作提供科学依据。

The authors have declared that no competing interests exist.

[1]
Koohsari M J, Karakiewicz J A, Kaczynski A T.Public open space and walking: the role of proximity, perceptual qualities of the surrounding built environment, and street configuration[J]. Environment and Behavior, 2013,45(6):706-736.ABSTRACT This study examined how proximity and attractiveness of public open spaces (POSs), perceptions of the surrounding built environment, and street configuration were associated with walking to and within POSs. Residents from three neighborhoods in Melbourne (N = 335) completed a questionnaire about walking and perceptions of their neighborhood, and geographic information systems and space syntax measures were used to assess proximity of POSs and street configuration. Proximity and attractiveness of POSs were not associated with POS-related walking. However, several perceptual qualities of the built environment, including safety from crime and traffic and aesthetics, were associated with greater walking. As well, persons living in areas with the most integrated street configurations reported less POS-related walking. Neighborhood perceptions and street configuration are key urban design issues to consider in promoting residents use of POS for walking.

DOI

[2]
Ulrich R S.Human responses to vegetation and landscapes[J]. Landscape and urban planning, 1986,13:29-44.The rapidly expanding research record concerning aesthetic, emotional and physiological response to visual landscapes is summarized, with emphasis on aesthetic preferences for views containing trees and other vegetation. The survey is set within a conceptual perspective suggesting that affective responses such as aesthetic preference are central to a landscape observer's thoughts, conscious experience and behavior. Substantial progress has been made in developing models that relate aesthetic responses to specific visual properties of environments. When aesthetic preferences are compared for urban and unspectacular natural views, American and European adult groups evidence a strong tendency to prefer nature. However, liking for urban scenes usually increases when trees and other vegetation are present. Views of nature, compared to most urban scenes lacking natural elements such as trees, appear to have more positive influences on emotional and physiological states. The benefits of visual encounters with vegetation may be greatest for individuals experiencing stress or anxiety. Recent research demonstrates that responses to trees and other vegetation can be linked directly to health, and in turn related to economic benefits of visual quality.

DOI

[3]
Lin Y H, Tsai C C, Sullivan W C, et al.Does awareness effect the restorative function and perception of street trees?[J]. Frontiers in psychology, 2014,5:906.Urban streetscapes are outdoor areas in which the general public can appreciate green landscapes and engage in outdoor activities along the street. This study tested the extent to which the degree of awareness of urban street trees impacts attention restoration and perceived restorativeness. We manipulated the degree of awareness of street trees. Participants were placed into four groups and shown different images: (a) streetscapes with absolutely no trees; (b) streetscapes with flashes of trees in which participants had minimal awareness of the content; (c) streetscapes with trees; and (d) streetscapes with trees to which participants were told to pay attention. We compared the performance of 138 individuals on measures of attention and their evaluations of perceived restorativeness. Two main findings emerged. First, streetscapes with trees improved the performance of participants on attentional tests even without their awareness of the trees. Second, participants who had raised awareness of street trees performed best on the attentional test and rated the streetscapes as being more restorative. These findings enhance our knowledge about the role of an individual awareness of restorative elements and have implications for designers and individuals who are at risk of attentional fatigue.

DOI PMID

[4]
Camacho-Cervantes M, Schondube J E, Castillo A, et al.How do people perceive urban trees? Assessing likes and dislikes in relation to the trees of a city[J]. Urban ecosystems, 2014,17(3):761-773.Cities are systems that include natural and human-created components. When a city grows without proper planning, it tends to have low environmental quality. If improving environmental quality is intended, people opinion should be taken into account for a better acceptance of urban management decisions. In this study, we assessed people perception of trees by conducting a survey with a controlled sample of citizens from the city of Morelia (west-central Mexico). Citizens liked both native and exotic tree species and rejected mainly exotic ones. Preference for trees were related to tree attributes; such as size. Trees that dropped leaves or tended to fall were not liked. The most-mentioned tree-related benefits were oxygen supply and shade; the most mentioned tree-related damages were accidents and infrastructure damage. The majority of respondents preferred trees near houses to increase tree density. Also, most respondents preferred trees in green areas as well as close to their houses, as they consider that trees provide oxygen. The majority of the respondents thought more trees were needed in the city. In general, our results show that although people perceive that trees in urban areas can cause damages, they often show more interest for the benefits related to trees and consider there should be more trees in cities. We strongly suggest the development of studies that broaden our knowledge of citizen preferences in relation to urban vegetation, and that further policy making takes their perception into account when considering creating new urban green areas, regardless of their type or size.

DOI

[5]
Todorova A, Asakawa S, Aikoh T.Preferences for and attitudes towards street flowers and trees in Sapporo, Japan[J]. Landscape and Urban Planning, 2004,69(4):403-416.The benefits of street vegetation, in particular the importance of trees, for urban dwellers have been given wide attention. There is, however, a lack of research on flowers as an element of street vegetation. This paper explores preferences for various street-planting models, particularly those with different compositions of flowers, with or without trees. Eighty-one residents of Sapporo evaluated 59 photomontage simulations and answered a questionnaire concerning their attitudes to street flowers. Results revealed trees to be the factor with the greatest influence on preference. Among possible elements for the space beneath trees from a choice including soil, grass, hedge and flowers, flowers were the most favoured. In particular, low and ordered compositions of brightly coloured flowers were the most preferred. Tall flowers were not found to be either attractive or appropriate for streetscapes in this case study. A factor analysis of the variables related to attitudes towards street flowers revealed the following five factors: “psychological benefits and aesthetic value”, “natural–environmental”, “practical concerns”, “effort to maintain” and “non-aesthetic”. The highest rated items were all related to the aesthetic and psychological benefits of street flowers. Flowers were the most preferred element beneath street trees and were seen as not only contributing to the aesthetic quality of a street but as also having a positive influence on psychological well-being.

DOI

[6]
Jackson L E.The relationship of urban design to human health and condition[J]. Landscape and urban planning, 2003,64(4):191-200.Solutions are discussed at the personal and professional level, emphasizing cross-disciplinary collaboration in urban planning and design, and the participation of residents in shaping their living environment. At the parcel scale, greenery and access to it visually and physically are the principal keys to health. These elements must be incorporated into relatively high-density neighborhood designs that include public buildings, open space, mixed land use, and pedestrian walkways to increase physical exercise and enhance civic life. Finally, neighborhoods must be embedded in existing urban infrastructure to provide larger cultural and business opportunities and reduce reliance on the automobile. Further research is recommended to strengthen the associations between design and health. Increased communication on this subject is also necessary between design and health practitioners and their clients and colleagues.

DOI

[7]
Hoehner C M, Ramirez L K B, Elliott M B, et al. Perceived and objective environmental measures and physical activity among urban adults[J]. American journal of preventive medicine, 2005,28(2):105-116.These findings indicate that physical activities for transportation or recreational are associated with different perceived and objective environmental characteristics. Modifications to these features may change the physical activity behavior of residents exposed to them.

DOI PMID

[8]
邓小军,王洪刚.绿化率,绿地率,绿视率[J].新建筑,2002(6):75-76.

[ Deng X J, Wang H G.Green ratio,. green space ratio, green looking ratio[J]. New Architecture, 2002,6:75-76. ]

[9]
吴立蕾,王云.城市道路绿视率及其影响因素:以张家港市西城区道路绿地为例[J].上海交通大学学报:农业科学版,2009,27(3):267-271.介绍了"道路绿视率"指标的源起、发展及研究意义,并针对影响城市道路绿视率指标的因素作了理论研究,以张家港市西城区城市道路绿地为例,通过实地调查研究和数理统计分析,进一步探讨各影响因素与城市道路绿视率指标之间相关性,为城市道路绿地的视绿设计提供科学依据。

DOI

[ Wu L L, Wang Y.The green looking ratio of urban roads and its major factors: example as Zhangjiagang City[J]. J Shanghai Jiaotong Univ Agric Sci, 2009, 27(3): 267-271. ]

[10]
吴正旺,马欣,杨鑫.高密度城市居住区的“绿视率”调查——以北京为例[J].华中建筑,2014,32(2):85-89.以北京为例分析了我国城市居住区规划建设的高密度趋势,介绍了"绿视率"理论的主要内容及基本观点。以北京市西三四环间的恩济里、定慧里、铁路小区等7个居住区为例,系统地阐述了利用绿视率理论进行居住区视觉生态调查的主要内容、程序和方法,包括调查对象分类、采样点布置、照片的获取与修正、绿视率计算等方面。针对当前我国大力提倡的绿色居住区建设,进一步从开放空间、步行系统、植物布置及群落结构等方面对本次绿视率调查的结果进行了分析,提出高密度城市居住区视觉生态设计的总体布局、道路设计以及植物布置与构成等若干导则。

DOI

[ Wu Z W, Ma X, Yang X.Survey of the green seeing rate of the high density city residential areas: A case study of Beijing[J]. Urban Planning·Gardens Landscape, 2014,32(2):85-89. ]

[11]
赵庆,唐洪辉,魏丹,等.基于绿视率的城市绿道空间绿量可视性特征[J].浙江农林大学学报,2016,33(2):288-294.lt;p>为了解城市绿道植物空间绿量可视性特征,通过构建绿视率计量方法,以广东省立绿道1号线为例进行调查分析,探索了基于绿视率的城市绿道空间绿量可视性特征。结果表明:①省立绿道1号线沿线4个区域总的绿视率均值为31.06%,其中天河区(38.19%)>海珠区(35.97%)>越秀区(26.76%)>荔湾区(26.67%)。②天河区绿道与荔湾区、越秀区绿道绿视率存在显著差异(<em>P</em><0.05),表明天河区绿道空间绿量可视性优于荔湾区和越秀区;虽然海珠区绿道绿视率较荔湾区和越秀区高,但通过方差分析多重比较来看,3个区的绿道绿视率没无显著差异(<em>P</em>>0.05),表明荔湾区、越秀区、海珠区绿道的空间绿量可视性较相似。③越秀区和天河区绿道绿视率较为集中地分布在24%~40%区间,说明越秀区和天河区各自区域绿道内部的绿视率数值较为稳定,其空间绿量可视性效果差异不大,给人感觉一种持续、稳定的绿色空间;而荔湾区和海珠区绿道绿视率的分散在10%~50%,说明荔湾区和海珠区各自区域绿道内部的绿视率数值不稳定,其空间绿量可视性效果差异较大,给人一种间断、具有冲击力的绿色空间。基于绿视率的空间绿量可视性可用于评价城市森林建设的视觉效果。图4表4参21</p>

DOI

[ Zhao Q, Tang H H, Wei D, et al.Spatial visibility of green areas of urban greenway using the green appearance percentage[J]. Journal of Zhejiang A & F University, 2016,33(2):288-294. ]

[12]
Yang J, Zhao L, Mcbride J, et al.Can you see green? Assessing the visibility of urban forests in cities[J]. Landscape and Urban Planning, 2009,91(2):97-104.The Green View index was developed to evaluate the visibility of urban forests. It was estimated through a combination of field surveys and photography interpretation and tested in Berkeley, California. The results showed that the overall Green View value in Berkeley was 24.79%. It has a strong correlation ( R 2 =0.86) with the canopy cover of tree/shrubs, which was 31.49%. Besides the absolute amount of canopy cover, Green View is also influenced by the distribution pattern of trees. The ANOVA analysis indicated that the size of trees, the distance between trees and viewers, the existence of vegetation other than trees and shrubs all had a significant impact on values of Green View. The study shows that the use of large-size trees is important for creating a view with more greenery in a city. Green View can be used to evaluate the visual impact of various planning and management practices on urban forests.

DOI

[13]
Li X, Zhang C, Li W, Ricard R, et al.Assessing street-level urban greenery using Google Street View and a modified green view index[J]. Urban Forestry & Urban Greening, 2015,14(3):675-685.We explored Google Street View (GSV) as a street-level, urban greenery assessment tool. Street-level greenery has long played a critical role in the visual quality of urban landscapes. This living landscape element can and should be assessed for the quality of visual impact with the GSV information, and the assessed street-level greenery information could be incorporated into urban landscape planning and management. Information on street-level views of urban greenery assessment, however, is rare or nonexistent. Planners and managers ability to plan and manage urban landscapes effectively and efficiently is, therefore, limited. GSV is one tool that might provide street-level, profile views of urban landscape and greenery, yet no research on GSV for urban planning seems available in literature. We modified an existing Green View Index (GVI) formula and conducted a case study assessment of street greenery using GSV images in the area of East Village, Manhattan District, New York City. We found that GSV to be well suited for assessing street-level greenery. We suggest further that the modified GVI may be a relatively objective measurement of street-level greenery, and that GSV in combination with GVI may be well suited in guiding urban landscape planning and management.

DOI

[14]
Brown P L, Doley D, Kennan R J.Estimating tree crown dimensions using digital analysis of vertical photographs. Agric[J]. Forest Meteorol, 2000,100:199-212.The aim of this study was to develop a relatively rapid, simple and repeatable method to characterize the crown architecture of Queensland maple ( Flindersia brayleyana F. Muell . ) by vertical hemispherical photography. Calibration scales were developed to provide horizontal planes of measurement at heights from 15 to 40m above the camera. Hemispherical images of tree crowns were merged with the specific calibration scale appropriate for the mid-height of the crown in order to adjust for image distortion during measurement. Merged images were analyzed by three procedures to yield measurements of crown diameter and projected area. The most precise measurement of projected crown dimensions was assumed to be provided by a complete analysis of a digital image of the crown, after removal of the trunk image. Crown diameters estimated by tape measurements on the ground were relatively imprecise ( R 2 =0.54). Crowns classified as symmetrical were described much more precisely ( R 2 =0.72) than those classified as asymmetrical ( R 2 =0.37). The precision of estimates of crown dimensions by tape did not alter significantly over the range of crown sizes sampled (2 10m diameter in trees 15 40m tall). This novel image analysis method can yield relatively precise and accurate measurements on the relatively shallow crowns of tall trees, often found in rainforests, regardless of the degree of asymmetry in crown shapes. However, the method is slower to apply than conventional tape techniques and additional equipment is required. The principal advantage of the photographic technique is the opportunity for precise measurements of changes in crown size and foliage projected area over time.

DOI

[15]
李小江. 基于多源遥感数据的城市绿度空间指数研究[D].北京:中国科学院大学,2013.

[ Li X J.Study on city greenness spatial index based on multi-source remote sensing data[D]. Beijing: University of Chinese Academy of Sciences, 2013. ]

[16]
Popescu S C, Wynne R H, Scrivani J A.Fusion of small-footprint lidar and multispectral data to estimate plot-level volume and biomass in deciduous and pine forests in Virginia, USA[J]. Forest Science, 2004,50(4):551-565.The principal study objective was to explore the feasibility of using small-footprint lidar data and multispectral imagery to estimate forest volume and biomass on small (0.017-ha) plots. In addition, the spatial dependency of residuals between ground-measured and lidar-estimated variables was investigated. The lidar data set was acquired over deciduous and pine stands in the southeastern United States. Individual trees were identified on the lidar-derived canopy height model by local maximum focal filtering with both square and circular windows of variable size. The size of the dynamically varying window was based on the height of the canopy and the taxonomic group as derived from coregistered multispectral optical data. Lidar-measured parameters at an individual tree level (height, crown diameter) were used with regression models and cross validation to estimate plot-level field inventory data, including volume, biomass, basal area, and diameter at breast height (dbh). Maximum values for estimating biomass were 0.32 for deciduous trees (RMSE 44 Mg/ha) and 0.82 for pines (RMSE 29 Mg/ha). When estimating volume, maximum values for deciduous trees were 0.39 (RMSE 52.84 m/ha) and 0.83 for pines (RMSE 47.9 m/ha). Calculation of Moran's coefficient for each regression model revealed a lack of significant autocorellation of the residuals at 0.05 level. Both model fit and prediction for volume and biomass models for deciduous and pine plots indicated that the circular window shape is more appropriate to locate individual trees with lidar. Using the fused data set, lidar and optical imagery, as opposed to using lidar data alone, always improved biomass and volume estimates for pines and in some cases for deciduous plots as well. FOR. SCI. 50(4):551-565.

DOI

[17]
Liu J, Shen J, Zhao R, et al.Extraction of individual tree crowns from airborne LiDAR data in human settlements[J]. Mathematical and Computer Modelling, 2013,58(3):524-535.Extraction of individual tree crowns is meaningful for many applications. In this paper, a new method is proposed to extract individual trees from airborne LiDAR point clouds in human settlements. In the process of extraction, an improved slope-based filter is employed to separate the non-ground measurements from the ground measurements, the surface growing algorithm is utilized to segment the point clouds into segments, multiple echo information is used to distinguish the tree points from other types of non-ground measurements, and the spoke wheel algorithm is employed to get the accurate edges of each tree at last. Two datasets are employed to test the above method. Experiments show that our approach is capable of extracting more than 85% trees from the point clouds with accuracy higher than 95%, which suggests the promising applications.

DOI

[18]
Kim Y H, Rana S, Wise S.Exploring multiple viewshed analysis using terrain features and optimisation techniques[J]. Computers & Geosciences, 2004,30(9):1019-1032.The calculation of viewsheds is a routine operation in geographic information systems and is used in a wide range of applications. Many of these involve the siting of features, such as radio masts, which are part of a network and yet the selection of sites is normally done separately for each feature. The selection of a series of locations which collectively maximise the visual coverage of an area is a combinatorial problem and as such cannot be directly solved except for trivial cases. In this paper, two strategies for tackling this problem are explored. The first is to restrict the search to key topographic points in the landscape such as peaks, pits and passes. The second is to use heuristics which have been applied to other maximal coverage spatial problems such as location llocation. The results show that the use of these two strategies results in a reduction of the computing time necessary by two orders of magnitude, but at the cost of a loss of 10% in the area viewed. Three different heuristics were used, of which Simulated Annealing produced the best results. However the improvement over a much simpler fast-descent swap heuristic was very slight, but at the cost of greatly increased running times.

DOI

Outlines

/