Orginal Article

Rapid Mapping of Winter Wheat in Henan Province

  • WANG Jiuzhong , 1 ,
  • TIAN Haifeng , 2, 3, * ,
  • WU Mingquan 2 ,
  • WANG Li 2 ,
  • Wang Changyao 2
Expand
  • 1. Beijing Forestry University, Beijing 100083, China
  • 2. Institute of Remote Sensing and Digital Earth, Chinese Academy of Science, Beijing 100101, China
  • 3. University of Chinese Academy Sciences, Beijing 100049, China
*Corresponding author: TIAN Haifeng, E-mail:

Received date: 2017-03-07

  Request revised date: 2017-04-14

  Online published: 2017-06-20

Copyright

《地球信息科学学报》编辑部 所有

Abstract

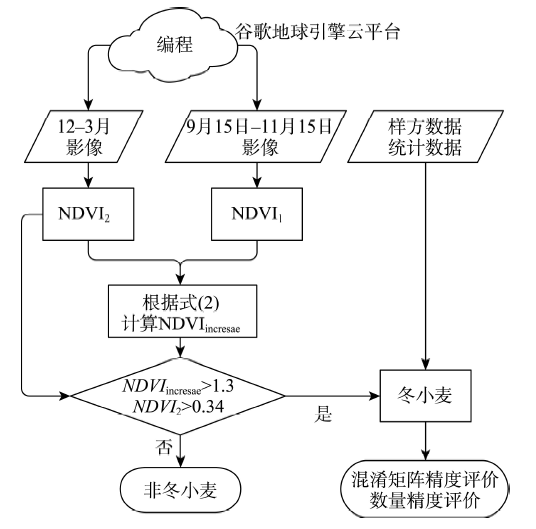
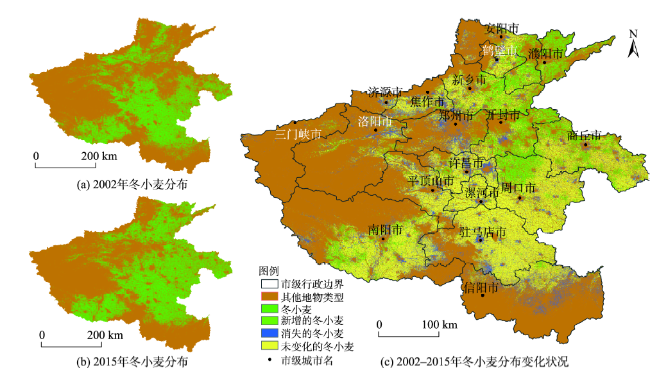
At present, there are several problems in mapping winter wheat using remote sensing technology at regional scale. These problems can be the differences in phenology of winter wheat, complex ground environment and data-processing, redundant remotely sensed data, difficulty of choosing appropriate samples and low accuracy. In order to solve these problems, a novel method was proposed and tested in Henan province. 2296 scenes of Landsat images in 2002 and 2015 were processed using Google Earth Engine. Google Earth Engine is the most advanced cloud-based geospatial processing platform in the world. It combines Google-scale storage and processing power in order to make substantial progress on global challenges involving large geospatial datasets. A novel method called Normalized Difference Vegetation Index (NDVI)-remodel-amplification was proposed to construct a universal model for mapping winter wheat at regional scale. The steps of the method is as follows: Landsat images from September 15 to November 15 were chosen to compute NDVI. Then, we selected the minimum NDVI as the first sequence of NDVI (recorded as NDVI1) at the pixel scale. In the same way, Landsat images from December 1st to March 31st were chosen to compute NDVI. Then, we selected the maximum NDVI as the second sequence NDVI (recorded as NDVI2) at the pixel scale. Then, amplification between NDVI1 and NDVI2 was computed and recorded as NDVIincrease. A pixel would be regarded as winter wheat if its NDVIincrease value is more than 1.3 and its NDVI2 value is more than 0.34. The results showed that winter wheat is mainly located in the middle-eastern plains and in Nanyang basin of Henan province with the characteristics of concentrated and contiguous distribution. The planting area of winter wheat in 2015 and 2002 was 56 055.79 km2 and 47 296.11 km2, respectively, with an accuracy of 97% based on statistical data. From 2002 to 2015, there was a significant change in the distribution of winter wheat in Henan Province The trend of overall sown area was increasing. Compared with that in 2002, the area of winter wheat in 2015 increased by 8759.69 km2 or 18.52%. Comparing with conditional winter wheat mapping method, this proposed method is based on Google Earth Engine showing a great improvement in both of data-processing and mapping efficiency.

Cite this article

WANG Jiuzhong , TIAN Haifeng , WU Mingquan , WANG Li , Wang Changyao . Rapid Mapping of Winter Wheat in Henan Province[J]. Journal of Geo-information Science, 2017 , 19(6) : 846 -853 . DOI: 10.3724/SP.J.1047.2017.00846
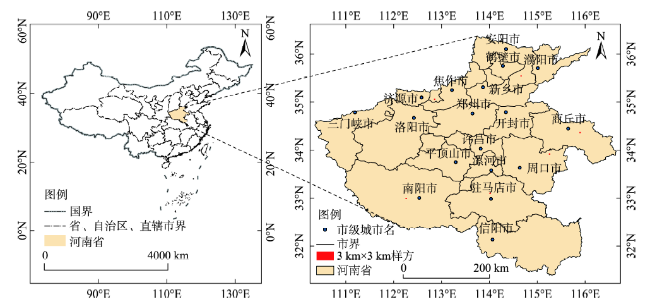
1 引言

冬小麦是中国重要的粮食作物之一,及时掌握其种植面积是开展冬小麦长势监测和估产工作的重要环节,可为国家相关经济决策、社会政策制定提供数据依据[1-2]。相比传统农业统计调查方法,通过遥感手段获取冬小麦种植面积具有成本低、速度快、质量可靠等优势,逐渐成为农业统计调查的重要科学方法[3-6]
目前关于省域尺度上冬小麦遥感监测的研究,主要采用中低空间分辨率的MODIS[7-11]或FY[12]卫星遥感数据,方法主要依据时间序列NDVI(Normalized Difference Vegetation Index)[13]或EVI(Enhance Vegetation Index)[8]等植被指数进行冬小麦识别,部分区域也可采用冬小麦越冬-返青期的单一时相识别冬小麦[14]。中低空间分辨率影像具有较高的时间分辨率和较宽的幅宽,有利于构建精细的时间序列植被指数以及降低影像数据处理复杂度。但是,对于准确识别省域尺度上的冬小麦种植面积,这类方法主要存在以下问题:① MODIS或FY卫星遥感影像的空间分辨率最高为250 m,会造成影像上存在大量的冬小麦与其他地物的混合像元,限制了冬小麦种植面积遥感识别的精度[8,13,15];② 大区域尺度上的物候存在一定的区域差异[8,16],造成冬小麦时间序列植被指数曲线存在区域异质性,采用单一的时间序列植被指数样本曲线难以准确识别整个研究区的冬小麦,分子区域构建样本曲线存在工作难度大、不便开展业务化运行等问题;③ 构建时间序列植被指数曲线的时间跨度一般为冬小麦播种至收割的整个生长期,该方法获取冬小麦种植面积的时效性差[16];④ 依据单时相影像识别冬小麦的方法要求研究区内没有常绿林种植,该方法具有地域局限性。采用中高空间分辨率影像数据(如Landsat)可以有效提高冬小麦的识别精度[14,17-19],但这类数据的时间分辨率和幅宽难以满足大区域尺度冬小麦遥感监测的要求[20]。较窄的幅宽意味完全覆盖研究区需要多景影像,极大地增加了影像数据传统处理的复杂度,增加数据处理难度,对计算机软硬件提出了新的要求。同时,这些影像的成像时间不一致,无论是采用时间序列植被指数方 法[7],还是机器学习等方法[9],均增加了冬小麦遥感识别的不确定性和难度。中国高分一号卫星宽视场角传感器影像(GF1-WFV)在幅宽和时间分辨率上相对Landsat影像有了一定程度的改进,有利于大范围的遥感监测应用[21],但依然面临大尺度遥感应用的难题,目前尚未检索到利用GF1-WFV影像在省域尺度或更大尺度上的冬小麦遥感监测研究。基于GF1-WFV影像的冬小麦遥感监测主要集中在县域或更小尺度上[1-2,22]。GF1-WFV影像需做辐射定标、大气校正、几何精校正、拼接等预处理[1],特别是几何精校正工作量大,限制了GF1-WFV影像在大区域尺度上的应用。
以谷歌地球引擎(Google Earth Engine,https://developers.google.com/earth-engine/)为代表的遥感云平台,存储了Landsat、MODIS、Sentinel等国际上主要卫星遥感平台的完备数据,具有强大的数据存储和管理能力以及数据处理能力,为大范围遥感技术应用提供了技术手段。目前国外已经开展了基于该平台的遥感制图研究[23],涉及水稻遥感制图[24]、城市面积变化遥感监测[25-26]、湿地动态监测[27]等领域,但尚未检索到国内基于该平台开展的遥感制图研究。
为解决大区域尺度上冬小麦快速遥感制图面临的问题与难题,本研究以河南省为研究区,基于Google Earth Engine云平台,利用Landsat遥感影像,构建NDVI重构增幅模型进行冬小麦大区域遥感快速制图研究。

2 谷歌地球引擎介绍

谷歌地球引擎是世界上最先进的、专门处理卫星图像和其他地球观测数据的云端运算平台,由谷歌、卡内基梅隆大学、美国地质调查局联合开发。该平台存储了公开可用的全球尺度上的近40年的遥感影像(Landsat、MODIS、Sentinel等)和其他数据的PB级存档,并且数据不断更新,优化了用于地理空间数据并行处理的Google计算基础架构。谷歌地球引擎的各项主要功能通过JavaScript和Python中提供的应用编程接口(Application Programming Interface,API)实现,该API支持复杂的地理空间分析,包括叠加、地图代数、数组运算、影像处理、分类、变化检测、时间序列分析、影像拼接、栅格矢量转换、基于矢量的图像统计提取等,算法可以不断被添加、增强和更新。通过API,用户可以自由地编写更复杂的分析,并创造性地重组现有算法,通过图表导出结果报告。计算方式上采用即时分布式并行化计算模型,即在Google数据中心的许多计算机上的许多CPU上同时运行,极大地提高了运算效率。其他具体介绍见谷歌地球引擎官方网站(https://developers.google.com/earth-engine/)。谷歌地球引擎云平台这种结合大数据和先进技术的特点使其具有以下优势:
(1)前所未有的速度。在顶级的台式计算机上,可能需要几天或几周的时间才能完成的影像计算与分析,在谷歌地球引擎云平台上几个小时就可以完成。
(2)易于使用和降低成本。通过任何Web浏览器可以轻松访问数据,具备科学算法和超强计算能力的在线云平台可以显著降低地理空间数据分析的成本和复杂性。
(3)全球尺度。谷歌地球引擎具备全球尺度的空间计算分析能力。

3 研究区概况

河南省位于中国中东部、黄河中下游,全省介于北纬31°23′~36°22′、东经110°21′~116°39′之间,如图1所示。河南省地势特征总体为西高东低,横跨暖温带半湿润半干旱气候和亚热带湿润半湿润气候,全年无霜期从北往南为189-240 d,全省年均日照1489-1848 h,年平均气温12.8~15.5 ℃,年平均降水量约530~900 mm。河南省有中国第一农业大省、第一粮食生产大省之称,是中国冬小麦主产区之一,冬小麦播种面积及产量居全国各省市首位(http://www.moa.gov.cn/)。据农业部公布的农时农事信息(http://www.moa.gov.cn/),河南省冬小麦一般10月播种,11月出苗分蘖,12-1月分蘖越冬,2-3月越冬返青,4月拔节抽穗,5月开花乳熟,6月成熟收获。冬小麦的越冬特性为遥感监测冬小麦提供了有利条件,10月至次年3月冬小麦的NDVI值呈现由低至高的过程,其他非越冬植被则与之相反,因此10月至次年3月是遥感监测冬小麦的关键期。
Fig. 1 Location of the study area

图1 研究区位置

4 研究数据及处理

4.1 Landsat遥感影像及处理

美国Landsat系列卫星由美国宇航局和美国地质调查局共同管理。自1972年起,Landsat系列卫星陆续发射了8颗(第6颗发射失败),目前Landsat-7和Landsat-8在运行工作,但Landsat-7自2013年开始出现故障,导致影像存在条带状损失,其他卫星已停止工作。本文以空间分辨率为30 m的Landsat-8、Landsat-7和Landsat-5卫星影像为数据源,提取河南省2015年和2002年冬小麦种植分布状况。Landsat-5/7/8的时间分辨率为16 d,受云雨天气影响,仅1年关键期内的遥感影像不能够完全覆盖全省,同时由于相近年份的冬小麦种植区域变化不大,因此将筛选影像的时间向前后推1-2年,即选取2013-2016年相应时间段内的影像作为2015年冬小麦遥感监测的数据源,选取1999-2004年相应时间段内的影像作为2002年冬小麦遥感监测的数据源(2002年前后高质量的影像少)。
谷歌地球引擎云平台具有强大的处理遥感大数据的能力,利用该平台完成Landsat影像的辐射定标、几何校正、去除云影响、NDVI计算、影像拼接、影像下载等工作。

4.2 土地利用数据及统计数据

在河南省均匀选择6个约3 km×3 km(图1)、空间分辨率为0.5 m的Google earth影像样方(其中2个样方的成像时间为2015年3月28日,其余4个样方的成像时间分别为2016年5月16日、10月4日、11月13日、12月22日),通过人工目视解译获得 6个样方耕地地块信息,然后结合农户走访调查数据确定种植冬小麦的地块,以获得冬小麦实际种植分布图,用于分类结果的精度评价。从农业部种植业司统计数据(http://www.zzys.moa.gov.cn/)下载河南省冬小麦种植面积数据,用于冬小麦提取结果的数量精度评价。

5 研究方法

利用谷歌地球引擎云平台对2015年和2002年前后年份冬小麦识别关键期内的2296景Landsat遥感影像进行辐射定标、几何校正、去除云影响、NDVI计算、影像拼接、影像下载等处理,采用NDVI重构增幅算法建立冬小麦大区域遥感快速制图的通用模型,实现2002年和2015年的河南省冬小麦制图。具体技术路线如图2所示。
Fig. 2 Technology roadmap

图2 技术路线图

5.1 NDVI重构增幅算法

采用时间序列NDVI进行农作物遥感识别是常用的一种有效方法[28]。NDVI的计算公式为[29]
NDVI = ρ nir - ρ red ρ nir + ρ red (1)
式中: ρ nir ρ red 分别表示遥感影像中近红外波段、红色波段的反射率。
虽然时间序列NDVI在农作物遥感识别中十分有效,但针对冬小麦而言这种方法存在上述提及的一系列问题。NDVI重构增幅算法打破了NDVI正常时间序列,最大限度地汲取NDVI时间序列所携带的有用信息,摒弃冗余信息,同时降低NDVI时间序列长度,以构建在冬小麦生长早期获得其种植面积的通用模型,有效地解决目前大区域尺度上冬小麦遥感识别中存在的冬小麦物候不一致、地表环境复杂、数据处理复杂、遥感数据冗余、分类样本选择困难、分类精度低等问题。
本算法以像元为基本单元,在每个像元位置上筛选9月15日至11月15日NDVI的最小值,得到一幅9月15日至11月15日的最小NDVI图像,将其作为NDVI第一序列(记为NDVI1);在每个像元位置上筛选12月1日至次年3月31日NDVI的最大值,得到一幅12月1日至次年3月31日的最大NDVI图像,作为NDVI第二序列(记为NDVI2),即将正常的NDVI时间序列重构为NDVI1和NDVI2。具体Landsat影像数量为:2013-2015年9月15日至11月15日317景;2013-2016年12月1日至次年3月31日693景;1999-2003年的9月15日至11月15日410景;1999-2004年的12月1日至次年3月31日876景。
9月15日至11月15日是冬小麦的播种出苗 期[7],这一时期冬小麦的NDVI值在其整个生长期中几乎是最小的,这是冬小麦NDVI时间序列中的第一个主要特征。这一时期的常绿林以及部分落叶林的叶片呈绿色,NDVI值较冬小麦种植地块的NDVI值高,因此NDVI1能够有效地将这部分植被与冬小麦区分开。12月1日至次年3月31日是冬小麦越冬返青期[7],这一时期冬小麦NDVI值不断增加,因此NDVI2不仅能够有效区分冬小麦与建筑用地、裸土、草地等,还能够有效识别NDVI1未能识别的落叶林。
随着冬小麦不断生长,影像中冬小麦会对相邻的非冬小麦地物的光谱产生影响,导致其NDVI呈不断增加的趋势。为解决这一问题,本文提出了NDVI增长幅度(即增幅,记为NDVIincrease)这一概念,计算公式如下:
NDV I increse = NDV I 2 - NDV I 1 NDV I 1 (2)
通过237个采样点与Google Earth影像的对照实验证明,自冬小麦播种至次年3月31日之前,冬小麦NDVI的增长幅度在1.3之上(即NDVIincrease大于1.3),NDVI2在0.34之上,据此构建冬小麦识别的决策树模型以实现冬小麦的提取。
采用前后推1-2年获取遥感数据的方法存在一定局限性,为了验证本文方法对某一年冬小麦种植面积识别的可靠性,增加遥感数据丰富的小区域研究。具体研究区域为图1中的商丘市,以2015年的冬小麦为研究对象,以2014年9月15至2015年3月31日的Landsat遥感影像为数据基础开展小区域实验研究。

5.2 精度验证方法

采用混淆矩阵精度和数量精度2种方式对分类结果进行精度评价。混淆矩阵精度评价方法是通过人工目视解译获得6个样方(均匀分布在河南省的6个约3 km×3 km、空间分辨率为0.5 m的Google earth影像样方)的冬小麦真实分布的矢量数据,然后将矢量数据转成栅格数据以与分类结果构建精度评价混淆矩阵。为了与30 m空间分辨率分类结果数据匹配,在矢量转栅格的过程中,采用最大面积法将人工解译数据重采样为30 m。以2015年和2002年农业部种植业司统计数据为真值完成数量精度评价;同时,统计样方内的冬小麦面积,完成样方内的数量精度评价。

6 结果与分析

6.1 分类结果与精度评价

分类结果表明,河南省2015年和2002年冬小麦种植面积分别为56 055.79 km2和47 296.11 km2图3(a)、(b)),冬小麦主要分布在河南省中东部平原和南阳盆地,具有分布集中连片的特征。农业部种植业司公布的河南省2015年和2002年冬小麦种植面积分别为54 256 km2和48 557 km2。与该数据相比,本文的数量精度分别为96.68%和97.40%。
Fig. 3 The distribution of winter wheat and its change in Henan province from 2002 to 2015

图3 河南省2002-2015年冬小麦种植分布及其变化状况

利用基于Google Earth影像人工解译的冬小麦数据进行混淆矩阵精度评价,结果表明:6个样方平均总体精度为93.16%,kappa系数为0.81,以样方内冬小麦面积为真值的数量精度为97.37%(鉴于篇幅,图4仅给出了样方1的精度评价过程及结果)。本文方法的数量精度比前人大区域冬小麦识别的数量精度高5%~15%[5,8-9],相同数据源的情况下与前人小区域尺度上(县域尺度)冬小麦识别的数量精度相当[14,20]。分析图4(d)可知,本文的冬小麦错分现象(即将其他地物识别为冬小麦)主要存在于农村道路网上,实地调研发现农村道路(含道旁沟渠)的宽度一般在15 m以下,空间分辨率为30 m的Landsat影像对这类线状地物的识别能力较差,易将其错分为冬小麦;冬小麦的漏分现象主要分布在村落周边,村落边界不规则,镶嵌在村落周边的冬小麦种植地块难以被识别。
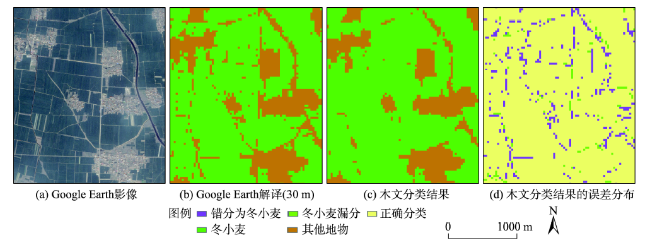
Fig. 4 Accuracy analysis of winter wheat

图4 冬小麦精度分析

以商丘市为例的小区域研究结果表明,采用2014年9月15至2015年3月31日的Landsat遥感影像和本文方法获取2015年商丘市冬小麦种植面积为5966.18 km2图5),与河南省统计年鉴(http://www.ha.stats.gov.cn/hntj/lib/tjnj/2016/indexch.htm)公布的2015年商丘市冬小麦种植面积(5827.70 km2)相比,数量精度为97.62%。这说明本文方法在数据源充足的情况下,采用当年数据获取当年冬小麦种植面积是可行的、准确的、科学的。
Fig. 5 The distribution of winter wheat in ShangQiu in 2015

图5 商丘市2015年冬小麦种植分布

6.2 冬小麦分布变化监测

2002-2015年,河南省冬小麦种植分布存在明显变化,图3(c)具体表明了河南2015省年冬小麦种植分布较2002年的变化状况。河南省2015年较2002年新增冬小麦播种面积18 269.97 km2,占2002年播种面积的38.63%,主要集中分布在周口北部、开封大部、商丘西北部、新乡安阳东部及其以东地区,这与当地大力改造盐碱地有很大关系。2015年比2002年消失的冬小麦面积达9510.28 km2,占2002年播种面积的20.11%,主要分散分布在城市周边以及淮河干流以南地区。随着社会经济飞速发展,城市用地不断扩张,侵占农用地是冬小麦在城市周边消失的主要原因;淮河干流以南地区冬小麦消失与当地种植结构改变有关。总体上,河南省冬小麦种植面积呈增加趋势,2015年比2002年增加8759.69 km2,增幅为18.52%。

7 结论与讨论

谷歌地球引擎云平台有效地解决了遥感大数据处理复杂的问题。本文提出的NDVI重构增幅算法可以有效实现省级冬小麦面积提取,提取的河南省2015年和2002年冬小麦种植面积分别为 56 055.79 km2和47 296.11 km2,与统计数据相比,精度分别为96.68%和97.40%。与传统基于普通计算机的冬小麦制图方法相比,该方法具有数据处理效率高、制图速度快等特点。然而,该方法只利用了Landsat一种遥感数据源,当遥感监测某一年的冬小麦种植分布情况时,存在数据源不能全覆盖研究区的问题,开展多源遥感数据去云算法研究以及利用多源遥感数据时空融合方法融合多源遥感数据是解决该问题的关键,是未来研究的重点之一[30-32]。油菜、大蒜等作物也有越冬习性,河南省的油菜、大蒜种植面积相对冬小麦种植面积而言是极少的,可以忽略这2种作物对冬小麦遥感识别的影响,但对于有大面积种植油菜、大蒜的区域而言,则需要考虑这种影响。如何将油菜、大蒜与冬小麦区分开,是本文模型优化的一个重要方向。

The authors have declared that no competing interests exist.

[1]
王利民,刘佳,杨福刚,等.基于GF-1卫星遥感的冬小麦面积早期识别[J].农业工程学报,2015,31(11):194-201.GF-1号卫星是中国高分卫星系列首颗卫星,自2013年04月26日发射以来,提供了大量的2 m/8 m/16 m空间分辨率的卫星数据,成为中国农业遥感监测的主要数据源之一。该文以GF-1卫星携带的16 m空间分辨率的宽视场(wide field view,WFV)传感器为主要数据源,采用2013年10月2日、10月17日、11月7日和12月5日4个时相的数据,以多尺度分割后的对象为基本分类单元,采用分层决策树分类的方法对冬小麦面积进行提取,并利用地面样方数据对分类结果进行了精度验证。结果表明,北京市顺义区冬小麦面积7095 hm2,分类总体精度达到96.7%,制图精度为90.0%,其他未分类类别精度为97.3%,Kappa系数为0.8。研究区内冬小麦的播种时间可以分为10月1-5日早播、10月6-10日中播、10月11-15日中晚播、10月16-20日晚播等4个时间段,不同播期对应着归一化植被指数(normalized difference vegetation index,NDVI)不同的变化规律,是分层的基础,结合波段反射率、波段反射率和、波段反射率比值等参数的变化规律,通过分层可以有效的剔除草坪、桃树等容易同冬小麦混淆的地物类型,GF-1/WFV 提供的多时相遥感数据能够可靠的反映冬小麦发育变化的规律,是冬小麦面积准确提取的基础,在农作物面积遥感监测业务运行中具有较大的开发应用潜力。

DOI

[ Wang L M, Liu J, Yang F G, et al.Early recognition of winter wheat area based on GF-1 satellite[J]. Transactions of the Chinese Society of Agricultural Engineering, 2015,31(11):194-201. ]

[2]
马尚杰,易湘生,游炯,等.基于GF-1影像的冬小麦种植面积核算及直补政策实施评价[J].农业工程学报,2016,32(18):169-174.粮食直接补贴政策的实施,对于促进粮食生产和农民增收、推动农业农村发展发挥了积极的作用。补贴资金发放的精准程度在一定程度上影响着财政资金的支农效率。该文拟研究基于卫星数据进行粮食直补政策落实效果评价的可行性。以安徽省濉溪县为研究区,采用GF-1卫星16 m多光谱影像,在扣除线状地物、小地物的基础上,精准核算冬小麦种植面积。以乡镇为单位,比较统计发放面积与遥感核算面积,完成基于GF-1卫星数据的粮食补贴政策落实效果评价。结果表明:1)全县范围内,冬小麦直补发放统计面积与遥感核算面积较为吻合。直补发放统计面积为1239.17 km2,遥感核算面积为1227.37 km2,相对误差仅为0.96%;2)在乡镇尺度上,11个乡镇和1个开发区中共5个乡镇直补发放统计面积与遥感核算面积的相对误差<10%,8个乡镇<13%。相对误差最大的开发区、濉溪镇2个乡镇,以工商业用地为主,冬小麦种植面积少,地块零碎,遥感解译难度大。整体上,直补发放统计面积与遥感核算面积的 Nash-Sutcliffe 系数(Nash-Sutcliffe coefficient,ENS)为0.90,决定系数为0.93,两者相关程度较高。研究可为改进完善粮食补贴政策提供参考提供依据。

DOI

[ Ma S J, Yi X S, You J, et al.Winter wheat cultivated area estimation and implementation evaluation of grain direct subsidy policy based on GF-1 imagery[J]. Transactions of the Chinese Society of Agricultural Engineering, 2016,32(18):169-174. ]

[3]
Ma Y, Wang S, Zhang L, et al.Monitoring winter wheat growth in North China by combining a crop model and remote sensing data[J]. International Journal of Applied Earth Observation and Geoinformation, 2008,10(4SI):426-437.Both of crop growth simulation models and remote sensing method have a high potential in crop growth monitoring and yield prediction. However, crop models have limitations in regional application and remote sensing in describing the growth process. Therefore, many researchers try to combine those two approaches for estimating the regional crop yields. In this paper, the WOFOST model was adjusted and regionalized for winter wheat in North China and coupled through the LAI to the SAIL鈥揚ROSPECT model in order to simulate soil adjusted vegetation index (SAVI). Using the optimization software (FSEOPT), the crop model was then re-initialized by minimizing the differences between simulated and synthesized SAVI from remote sensing data to monitor winter wheat growth at the potential production level. Initial conditions, which strongly impact phenological development and growth, and which are hardly known at the regional scale (such as emergence date or biomass at turn-green stage), were chosen to be re-initialized. It was shown that re-initializing emergence date by using remote sensing data brought simulated anthesis and maturity date closer to measured values than without remote sensing data. Also the re-initialization of regional biomass weight at turn-green stage led that the spatial distribution of simulated weight of storage organ was more consistent to official yields. This approach has some potential to aid in scaling local simulation of crop phenological development and growth to the regional scale but requires further validation.

DOI

[4]
Jain M, Srivastava A K, Balwinder-Singh, et al.Mapping smallholder wheat yields and sowing dates using micro-satellite data[J]. Remote Sensing, 2016,8(10):1-18.Remote sensing offers a low-cost method for developing spatially continuous crop production statistics across large areas and through time. Nevertheless, it has been difficult to characterize the production of individual smallholder farms, given that the land-holding size in most areas of South Asia (<2 ha) is smaller than the spatial resolution of most freely available satellite imagery, like Landsat and MODIS. In addition, existing methods to map yield require field-level data to develop and parameterize predictive algorithms that translate satellite vegetation indices to yield, yet these data are costly or difficult to obtain in many smallholder systems. To overcome these challenges, this study explores two issues. First, we employ new high spatial (2 m) and temporal (bi-weekly) resolution micro-satellite SkySat data to map sowing dates and yields of smallholder wheat fields in Bihar, India in the 2014–2015 and 2015–2016 growing seasons. Second, we compare how well we predict sowing date and yield when using ground data, like crop cuts and self-reports, versus using crop models, which require no on-the-ground data, to develop and parameterize prediction models. Overall, sow dates were predicted well (R2 = 0.41 in 2014–2015 and R2 = 0.62 in 2015–2016), particularly when using models that were parameterized using self-report sow dates collected close to the time of planting and when using imagery that spanned the entire growing season. We were also able to map yields fairly well (R2 = 0.27 in 2014–2015 and R2 = 0.33 in 2015–2016), with crop cut parameterized models resulting in the highest accuracies. While less accurate, we were able to capture the large range in sow dates and yields across farms when using models parameterized with crop model data and these estimates were able to detect known relationships between management factors (e.g., sow date, fertilizer, and irrigation) and yield. While these results are specific to our study site in India, it is likely that the methods employed and the lessons learned are applicable to smallholder systems more generally across the globe. This is of particular interest given that similar high spatio-temporal resolution micro-satellite data will become increasingly available in the coming years.

DOI

[5]
黄青,李丹丹,陈仲新,等.基于MODIS数据的冬小麦种植面积快速提取与长势监测[J].农业机械学报,2012,43(7):163-167.利用MODIS-NDVI数据,以中国冬小麦主产区为例,探讨了 基于遥感影像全覆盖的大尺度冬小麦种植面积遥感综合自动识别及长势监测的方法.通过分析冬小麦的种植结构、物候历特征及其生物学特性和时序NDVI曲线特 征,确定了冬小麦信息提取的NDVI阈值,建立了冬小麦面积提取模型,并最终获取了2010-2011年中国农情遥感监测中冬小麦长势监测所需的空间分布 数据,与多年平均统计数据比较,总体精度达到81%以上.基于提取的冬小麦面积信息空间分布数据,利用MODIS-NDVI差值模型,对冬小麦2011年 的长势进行监测.结果表明,与近5年平均状况对比,2011年冬小麦在其整个生育期内长势基本与常年持平,但时空分布差异较大.

DOI

[ Huang Q, Li D D, Chen Z X, et al.Monitoring of planting area and growth condition of winter wheat in China based on MODIS data[J]. Transactions of the Chinese Society for Agricultural Machinery, 2012,43(7):163-167. ]

[6]
权文婷,王钊.冬小麦种植面积遥感提取方法研究[J].国土资源遥感,2013,25(4):8-15.提取冬小麦种植面积是开展冬小麦长势监测和估产工作的重要环节, 如何提高其提取精度是国内外研究的热点.针对不同空间分辨率的遥感图像,采取不同的遥感解译模型,得到更高的信息提取精度,是利用遥感方法提取冬小麦种植 面积的关键.在对国内、外调研的基础上,将冬小麦种植面积遥感提取研究方法归纳为目视解译与计算机自动分类、面向像元分类、基于地块分类、遥感解译模型分 类和基于纹理特征分类等5类.综述评价了主要的冬小麦种植面积遥感提取研究方法,讨论了目前冬小麦种植面积遥感提取存在的问题及未来发展方向.关注地形复 杂、耕地破碎度较高及种植结构复杂地区的冬小麦种植面积提取,遥感数据、GIS和气象数据等相结合、多源多时相遥感数据相结合、地面光谱测量数据与高光谱 图像数据相结合,以及验证数据的改变等,是提高冬小麦种植面积遥感提取精度的研究方向.

DOI

[ Quan W T, Wang Z.Researches on the extraction of winter wheat planting area using remote sensing method[J]. Remote Sensing for Land and Resources, 2013,25(4):8-15. ]

[7]
王学,李秀彬,谈明洪,等.华北平原2001-2011年冬小麦播种面积变化遥感监测[J].农业工程学报,2015,38(8):190-199.为及时、准确地获取华北平原冬小麦时空分布信息,构建多源遥感监测系统,基于MODIS EVI时间序列数据和两景TM影像,建立华北平原冬小麦时序波谱曲线库,并结合农作物物候历制订统一规则,在此基础上,重建华北平原2001-2011年冬小麦播种面积时空变化过程。结果表明:1)多源遥感监测系统提取华北平原2001-2011年冬小麦信息,在栅格尺度上获得了稳定的较高分类精度,平均为76.36%;在县域行政单元尺度上,2011年的冬小麦遥感监测面积与统计数据的耦合度也较高(决定系数为0.89,均方根误差为1.29×10⁴ hm2);2)华北平原2001-2011年的冬小麦播种面积呈持续上升趋势,2011年比2001年增加了156.05×10⁴ hm2(14.96%);3)冬小麦播种面积大致呈"南增北减"的时空变化格局:平原中南部的鲁西南平原、胶莱平原、豫东平原和皖北平原冬小麦种植面积扩张趋势显著;而北部的京津冀地区冬小麦面积明显收缩。该研究旨在为华北平原调整农业种植结构、制订粮食安全策略及优化水资源管理提供数据支持,也可为大范围、长时间尺度的作物播种面积时空变化遥感监测提供方法借鉴。

DOI

[ Wang X, Li X B, Tan M H, et al.Remote sensing monitoring of changes in winter wheat area in North China Plain from 2001 to 2011[J]. Transactions of the Chinese Society of Agricultural Engineering, 2015,38(8):190-199. ]

[8]
张霞,帅通,杨杭,等.基于MODIS EVI图像时间序列的冬小麦面积提取[J]. 农业工程学报, 2010,26(S1):220-224.植被指数的时间序列能够很好的反映植被在时间维上的生长变化,这为地表植被的分类以及作物面积的提取提供了思路。将TM数据作为过渡数据,利用地面测量数据间接对MODIS EVI数据进行了样本提取和验证,并结合冬小麦物候信息,将冬小麦植被指数时间曲线参量化为生长速率、衰减速率和峰值与休眠期比值,建立了华北平原冬小麦的面积提取模型。经验证,兖州地区MODIS数据和TM数据提取的冬小麦面积一致性为89.13%,整个华北地区选取13县市的MODIS提取面积与官方统计数据比对,表明有12县市的提取误差小于20%,误差主要源于MODIS的空间分辨率较粗而华北平原的地块较为细碎。

DOI

[ Zhang X, Shuai T, Yang H, et al.Winter wheat planting area extraction based on MODIS EVI image time series[J]. Transactions of the Chinese Society of Agricultural Engineering, 2010,26(S1):220-224. ]

[9]
许文波,张国平,范锦龙,等.利用MODIS遥感数据监测冬小麦种植面积[J].农业工程学报,2007,23(12):144-149.冬小麦是中国最主要的粮食作物之一,利用遥感技术进行冬小麦种植面积监测是粮食安全的核心内容之一。美国1999年发射的TERRA卫星上携带的中分辨率成像光谱仪(MODIS)具有独特的光谱、时相和空间分辨率,为大范围的冬小麦种植面积监测提供了可靠的数据源。但中国耕地破碎,即使是250 m分辨率的MODIS数据,采用传统的信息提取方法依然无法取得高的精度。因此结合多源遥感数据和GIS数据,建立了基于TERRA/MODIS数据的冬小麦种植面积遥感监测体系结构。首先利用IKONOS米级高分辨率遥感影像提取试验样区的地块图,用以指导野外采样工作;其次,在采样工作基础上,利用LANDSAT进行区域冬小麦种植面积提取;最后利用2002年TERRA/MODIS时间序列数据的混合像元线性分解模型进行河南省冬小麦种植面积的遥感监测,监测结果与国家统计数据相比,相对误差为5.25%,精度能满足农情监测的需要。研究结果为中国冬小麦种植面积遥感监测提供了一种业务化工作方法。

DOI

[ Xu W B, Zhang G P, Fan J L, et al.Remote sensing monitoring of w inter wheat areas using MODIS data[J]. Transactions of the Chinese Society of Agricultural Engineering, 2007,23(12):144-149. ]

[10]
Ren J, Chen Z, Zhou Q, et al.Regional yield estimation for winter wheat with MODIS-NDVI data in Shandong, China[J]. International Journal of Applied Earth Observation and Geoinformation, 2008,10(4SI):403-413.The significance of crop yield estimation is well known in agricultural management and policy development at regional and national levels. The primary objective of this study was to test the suitability of the method, depending on predicted crop production, to estimate crop yield with a MODIS-NDVI-based model on a regional scale. In this paper, MODIS-NDVI data, with a 25002m resolution, was used to estimate the winter wheat ( Triticum aestivum L.) yield in one of the main winter-wheat-growing regions. Our study region is located in Jining, Shandong Province. In order to improve the quality of remote sensing data and the accuracy of yield prediction, especially to eliminate the cloud-contaminated data and abnormal data in the MODIS-NDVI series, the Savitzky–Golay filter was applied to smooth the 10-day NDVI data. The spatial accumulation of NDVI at the county level was used to test its relationship with winter wheat production in the study area. A linear regressive relationship between the spatial accumulation of NDVI and the production of winter wheat was established using a stepwise regression method. The average yield was derived from predicted production divided by the growing acreage of winter wheat on a county level. Finally, the results were validated by the ground survey data, and the errors were compared with the errors of agro-climate models. The results showed that the relative errors of the predicted yield using MODIS-NDVI are between 614.62% and 5.40% and that whole RMSE was 214.1602kg02ha 611 lower than the RMSE (233.3502kg02ha 611 ) of agro-climate models in this study region. A good predicted yield data of winter wheat could be got about 40 days ahead of harvest time, i.e. at the booting-heading stage of winter wheat. The method suggested in this paper was good for predicting regional winter wheat production and yield estimation.

DOI

[11]
Upadhyay P, Ghosh S K, Kumar A.Temporal MODIS data for identification of wheat crop using noise clustering soft classification approach[J]. Geocarto International, 2016,31(3):278-295.ABSTRACT In this study, temporal MODIS-Terra MOD13Q1 data have been used for identification of wheat crop uniquely, using the Noise Clustering (NC) soft classification approach. This research also optimizes the selection of date combination and vegetation index for classification of wheat crop. First, a separability analysis is used to optimize the date combination for each case of number of dates and vegetation index. Then these scenes have undergone for NC soft classification. The resolution parameter (未) was optimized for the NC classifier and found to be a value of 1.6 104 for wheat crop identification. Classified outputs were analyzed by Receiver Operating Characteristics (ROC) analysis for sub-pixel detection. Highest area under the ROC curve was found for SAVI corresponding to the three different phenological stages datasets. From this study, the datasets corresponding to the Sowing, Flowering and Maturity phenological stages of wheat crop were found more suitable to identify it uniquely.

DOI

[12]
樊香所,许文波,范锦龙.FY-3250m分辨率数据的华北平原冬小麦提取[J].遥感学报,2015,19(4):586-593.冬小麦是中国最主要的粮食作物之一,利用遥感技术提取冬小麦种植 区是遥感应用研究的一个重要方向.2008年以来发射的系列风云三号(FY-3)卫星均携带着中分辨率光谱成像仪(MERSI),该传感器有5个250 m分辨率的波段,波段范围包括可见光、近红外和热红外,观测数据包含丰富的地表信息,为大范围冬小麦种植区提取提供了新的数据源.首先,选取生长季前期多 幅高质量的MERSI数据,采用分层提取的方法,对于不同的层次选用与待提取类别最为敏感的特征波段来构建相应的决策树,从而将每一幅影像中冬小麦种植区 提取出来,然后,将多幅数据融合为一幅生长季内的冬小麦种植区图.最后,使用野外实地调查的数据进行精度验证,面积提取精度为90.8%.结果表明,在春 季返青后,即可做出当季冬小麦种植分布图,为农情监测提供及时的信息支撑.

DOI

[ Fan X S, Xu W B, Fan J L.Mapping winter wheat growing areas in the North China Plain with FY-3 250 m resolution data[J]. Journal of Remote Sensing, 2015,19(4):586-593. ]

[13]
李乐,张锦水,朱文泉,等.地块支持下MODIS-NDVI时间序列冬小麦种植面积测量研究[J].光谱学与光谱分析,2011,31(5):1379-1383.在大尺度冬小麦种植面积测量中,MODIS(moderate resolution imaging spectrometer)数据对绝大部分地区可实现全覆盖数据保障,具有很好的时间序列特征,在探测植物季相节律进行作物估产与动态监测上得到很好的应用,但因受到空间分辨率的限制,其测量结果的可靠性受到较大质疑。地块数据具有明确的位置特征和明显的边界信息,在一定程度上降低了光谱差异和混合像元的复杂程度,在遥感影像上具有很强的相似光谱特征,较像元识别更有优势。以北京市通州为试验区,充分结合冬小麦生长季特征,首次尝试MODIS-NDVI空间地块化,建立其与中分辨率TM耕地地块识别结果的定量关系,进行地块支持下的MO-DIS-NDVI时间序列冬小麦种植面积测量。研究结果表明,当样本量达到15%以上时,MODIS和TM提取结果区域精度一致性稳定达到96%以上。该方法证明,地块数据可有效改善MODIS-NDVI时序数据遥感识别中,因空间分辨率低引起的误差。实现有碎云影响和无全覆盖中分辨影像时,利用部分中分辨影像样本结合低分辨率全覆盖影像实现大尺度的冬小麦种植面积测量,同时,为其他品种农作物种植面积测量进行先期的实验研究。

DOI

[ Li L, Zhang J S, Zhu W Q, et al.Winter wheat area estimation with MODIS-NDVI time series based on parcel[J]. Spectroscopy and Spectral Analysis, 2011,31(5):1379-1383. ]

[14]
田海峰,王力,牛铮.基于OLI影像的县域冬小麦种植面积提取[J].河南农业科学,2015,44(6):156-160.

[ Tian H F, Wang L, Niu Z.Study on planting area extraction of winter wheat based on OLI images at county level[J]. Journal of Henan Agricultural Sciences, 2015,44(6):156-160.]

[15]
李颖,陈秀万,段红伟,等.多源多时相遥感数据在冬小麦识别中的应用研究[J].地理与地理信息科学,2010,26(4):47-49.当前基于多时相遥感数据进行作物识别时往往只用到了单一的数据 源,未能充分利用作物的时相特征和光谱特征.该文以胶东半岛为例,在冬小麦识别研究中采用一种基于多源多时相遥感数据的方法,利用MODIS NDVI产品和TM数据将冬小麦的时相特征识别与光谱特征识别充分结合.首先,基于4个时相的MODIS NDVI产品影像生成冬小麦掩膜,将冬小麦与其他作物区分开;然后将冬小麦掩膜应用于TM影像,并通过TM光谱识别的方法提取冬小麦,冬小麦识别精度达 92.39%.

[ Li Y, Chen X W, Duan H W, et al.Application of multi-source and multi-temporal remote sensing data in winter wheat identification[J]. Geography and Geo-Information Science, 2010,26(4):47-49. ]

[16]
张霞,焦全军,张兵,等.利用MODIS_EVI图像时间序列提取作物种植模式初探[J].农业工程学报,2008,24(5):161-165.

[ Zhang X, Jiao Q J, Zhang Bing, et al.Preliminary study on cropping pattern mapping using MODIS_EVI image time series[J]. Transactions of the Chinese Society of Agricultural Engineering, 2008,24(5):161-165. ]

[17]
Liu J, Pattey E, Jego G.Assessment of vegetation indices for regional crop green LAI estimation from Landsat images over multiple growing seasons[J]. Remote Sensing of Environment, 2012,123:347-358.There is an increasing need to monitor the dynamics of green LAI of field crops through the growing season. A simple approach is to use a regression model to estimate crop LAI from a vegetation index derived from optical remote sensing data. However, variations of interference factors in the signal path could induce variations in spectral reflectance, leading to uncertainty in LAI estimation. A semi-empirical equation was implemented to estimate green LAI of field crops from Landsat-5/7 data using a few vegetation indices, including the normalized difference vegetation index (NDVI), the optimized soil adjusted vegetation index (OSAVI), the two band enhanced vegetation index (EVI2) and the modified triangular vegetation index (MTVI2). Data were collected during several growing seasons, from 1999 to 2006, over corn, soybean, and spring wheat fields in an experimental farm in Ottawa (ON, Canada). LAI estimated for corn, soybean and wheat from Landsat data using the vegetation indices was compared to ground LAI. Except for NDVI, comparable results were obtained from the other three vegetation indices, with a coefficient of determination above 0.83 and a root mean square error (RMSE) not more than 0.60. The performance of NDVI was less satisfactory (RMSE > 0.66). The uncertainties in LAI estimation induced by variations in soil reflectance, leaf optical properties, canopy structure, and atmospheric conditions were assessed through a global sensitivity analyses using the PROSPECT leaf model coupled to the SAIL canopy model along with the 6S atmospheric transmission model. The sensitivity analyses show that different indices are affected differently by the various interference factors. Comparatively, NDVI is the most influenced by leaf chlorophyll but the least affected by leaf inclination, OSAVI and the narrow band MTVI2 are more efficient in reducing soil effects, and EVI2 has a better performance in reducing aerosol perturbation. At high LAI, the uncertainty of NDVI is the smallest, but the uncertainty propagated to LAI estimation is the largest due to saturation. In this case, vegetation indices that are less prone to saturation should be considered, such as EVI2 and MTVI2. When MTVI2 is used on multispectral data, its ability to reduce soil and leaf chlorophyll perturbation is similar to EVI2 but weaker than when it is used on hyperspectral data. These results show that vegetation indices can be used in a simple regression model to generate baseline green LAI product for seasonal crop growth monitoring, however it is important to be aware of the sources of uncertainty and their relative amplitudes when using the product.

DOI

[18]
Edlinger J, Conrad C, Lamers J P A, et al. Reconstructing the spatio-temporal development of irrigation systems in Uzbekistan using Landsat time series[J]. Remote Sensing, 2012,4(12):3972-3994.The expansion of irrigated agriculture during the Soviet Union (SU) era made Central Asia a leading cotton production region in the world. However, the successor states of the SU in Central Asia face on-going environmental damages and soil degradation that are endangering the sustainability of agricultural production. With Landsat MSS and TM data from 1972/73, 1977, 1987, 1998, and 2000 the expansion and densification of the irrigated cropland could be reconstructed in the Kashkadarya Province of Uzbekistan, Central Asia. Classification trees were generated by interpreting multitemporal normalized difference vegetation index data and crop phenological knowledge. Assessments based on image-derived validation samples showed good accuracy. Official statistics were found to be of limited use for analyzing the plausibility of the results, because they hardly represent the area that is cropped in the very dry study region. The cropping area increased from 134,800 ha in 1972/73 to 470,000 ha in 2009. Overlaying a historical soil map illustrated that initially sierozems were preferred for irrigated agriculture, but later the less favorable solonchaks and solonetzs were also explored, illustrating the strategy of agricultural expansion in the Aral Sea Basin. Winter wheat cultivation doubled between 1987 and 1998 to approximately 211,000 ha demonstrating its growing relevance for modern Uzbekistan. The spatial-temporal approach used enhances the understanding of natural conditions before irrigation is employed and supports decision-making for investments in irrigation infrastructure and land cultivation throughout the Landsat era.

DOI

[19]
Lyle G, Lewis M, Ostendorf B.Testing the temporal ability of Landsat imagery and precision agriculture technology to provide high resolution historical estimates of wheat yield at the farm scale[J]. Remote Sensing, 2013,5(4):1549-1567.The long term archiving of both Landsat imagery and wheat yield mapping datasets sensed by precision agriculture technology has the potential through the development of statistical relationships to predict high resolution estimates of wheat yield over large areas for multiple seasons. Quantifying past yield performance over different growing seasons can inform agricultural management decisions ranging from fertilizer applications at the sub-paddock scale to changes in land use at a landscape scale. However, an understanding of the magnitude of prediction errors is needed. In this study, we examine the predictive wheat yield relationships developed from Normalised Difference Vegetation Index (NDVI) acquired Landsat imagery and combine-mounted yield monitors for three Western Australian farms over different growing seasons. We further analysed their predictive capability when these relationships are used to extrapolate yield from one farm to another. Over all seasons, the best predictions were achieved with imagery acquired in September. Of the five seasons reviewed, three showed very reasonable prediction accuracies, with the low and high rainfall years providing good predictions. Medium rainfall years showed the greatest variation in prediction accuracy with marginal to poor predictions resulting from narrow ranges of measured wheat yield and NDVI values. These results demonstrate the potential benefit of fusing together two high resolution datasets to create robust wheat yield prediction models over different growing seasons, the outputs of which can be used to inform agricultural decision making.

DOI

[20]
张建国,李宪文,吴延磊.面向对象的冬小麦种植面积遥感估算研究[J].农业工程学报,2008,24(5):156-160.种植面积的遥感估算是冬小麦遥感估产的重要基础性工作之一。该文主要的研究内容是基于Landsat ETM+遥感影像,利用面向对象的分类方法提取山东省桓台县冬小麦种植面积。以山东省桓台县为例,选择LandsatETM+L1G遥感影像,通过影像分割和基于知识的面向对象的分类方法准确地提取研究区冬小麦面积。以乡镇为单位将其结果同统计年鉴数据对比分析,误差最大的是果里镇,误差在95hm^2,整个研究区的提取误差是-111hm^2,能够满足实际应用的需求。

DOI

[ Zhang J G, Li X W, Wu Y L.Object oriented estimation of winter wheat planting area using remote sensing data[J]. Transactions of the Chinese Society of Agricultural Engineering, 2008,24(1):156-160. ]

[21]
王来刚,贾玉秋,李冰,等.基于GF-1与Landsat-8多光谱遥感影像的玉米LAI反演比较[J].农业工程学报,2015,31(9):173-179.近年来,中国遥感事业已取得长足进步,高分一号(GF-1)卫星首次实现了中国自主研发的高分辨率对地观测。为探讨国产GF-1卫星影像在农业遥感长势监测中的适应性,以许昌地区为研究对象,选取同期Landsat-8卫星影像,结合地面采样数据LAI,从传感器光谱响应特征、经验回归模型监测精度以及LAI空间一致性等3方面进行2类遥感数据的对比评价。结果表明,GF-1影像近红外、红、蓝波段光谱响应与 Landsat-8有差异,与绿波段光谱响应非常吻合,各波段光谱反射率与Landsat-8影像同类光谱间均存在显著线性关系。通过各波段组合多种归一化植被指数,采用经验回归模型反演LAI发现,GF-1影像反演的最优模型为NDVI的指数模型,R2为0.848,Landsat-8影像反演的最优模型为蓝红组合的归一化植被指数(blue-red NDVI,BRNDVI)的指数模型,R2为0.687,2类影像反演LAI与地面实测值均呈现较为一致的线性关系。由许昌地区玉米LAI值空间分布可见,GF-1影像反演的玉米LAI值与Landsat-8影像反演值过渡趋势一致,在许昌西部种植结构复杂地区,GF-1影像以其空间分辨率优势更能凸显 LAI 分布差异。通过该文研究表明, GF-1卫星的高时间分辨率以及高空间分辨率特征能够代替传统中分辨率数据成为农业遥感长势监测中的重要数据源,该数据在农业遥感其他领域的应用是今后研究的重点。

DOI

[ Wang L G, Jia Y Q, Li B, et al.Comparison between GF-1 images and Landsat-8 images in monitoring maize LAI[J]. Transactions of the Chinese Society of Agricultural Engineering, 2015,31(9):173-179. ]

[22]
黄健熙,贾世灵,武洪峰,等.基于GF-1 WFV影像的作物面积提取方法研究[J].农业机械学报,2015(S1):253-259.黑龙江省是我国粮食生产大省,及时有效地获取黑龙江省的农作物种植面积对后续研究的开展具有重要意义。以黑龙江省五九七农场为例,利用2014年8月30日GF-1卫星16 m空间分辨率影像,通过计算不同特征波段,构建了多特征水稻、玉米种植区识别方法。首先计算影像归一化差分植被指数(NDVI),并将原影像进行主成分变换,以此为基础建立包含多特征的数据集。然后利用不同地物类型之间在各特征波段的差异,基于CART算法构建决策树,分别提取研究区内的水稻和玉米。精度评价结果表明,分类的总体精度达到96.15%,Kappa系数为0.94。水稻的制图精度为98.41%,用户精度为97.64%;玉米的制图精度为95.38%,用户精度为97.89%。其中总体精度和Kappa系数较最大似然法分类结果分别提高了5.28%和0.08。所提研究方法可为其他地区农作物高分数据作物类型制图提供借鉴。

[ Huang J X, Jia S L, Wu H F, et al.Extraction method of crop planted area based on GF-1 WFV image[J]. Transactions of the Chinese Society for Agricultural Machinery, 2015,S1:253-259. ]

[23]
Padarian J, Minasny B, McBratney A B. Using Google's cloud-based platform for digital soil mapping[J]. Computers & GeoSciences, 2015,83:80-88.A digital soil mapping exercise over a large extent and at a high resolution is a computationally expensive procedure. It may take days or weeks to obtain the final maps and to visually evaluate the prediction models when using a desktop workstation. To increase the speed of time-consuming procedures, the use of supercomputers is a common practice. Google TM has developed a product specifically designed for mapping purposes (Earth Engine), allowing users to take advantage of its computing power and the mobility of a cloud-based solution. In this work, we explore the feasibility of using this platform for digital soil mapping by presenting two soil mapping examples over the contiguous United States. We also discuss the advantages and limitations of this platform at its current development stage, and potential improvements towards a fully functional cloud-based soil mapping platform.

DOI

[24]
Dong J, Xiao X, Menarguez M A, et al.Mapping paddy rice planting area in northeastern Asia with Landsat 8 images, phenology-based algorithm and Google Earth Engine[J]. Remote sensing of environment, 2016,185:142-154.Area and spatial distribution information of paddy rice are important for understanding of food security, water use, greenhouse gas emission, and disease transmission. Due to climatic warming and increasing food demand, paddy rice has been expanding rapidly in high latitude areas in the last decade, particularly in northeastern (NE) Asia. Current knowledge about paddy rice fields in these cold regions is limited. The phenology- and pixel-based paddy rice mapping (PPPM) algorithm, which identifies the flooding signals in the rice transplanting phase, has been effectively applied in tropical areas, but has not been tested at large scale of cold regions yet. Despite the effects from more snow/ice, paddy rice mapping in high latitude areas is assumed to be more encouraging due to less clouds, lower cropping intensity, and more observations from Landsat sidelaps. Moreover, the enhanced temporal and geographic coverage from Landsat 8 provides an opportunity to acquire phenology information and map paddy rice. This study evaluated the potential of Landsat 8 images on annual paddy rice mapping in NE Asia which was dominated by single cropping system, including Japan, North Korea, South Korea, and NE China. The cloud computing approach was used to process all the available Landsat 8 imagery in 2014 (143 path/rows, ~ 3290 scenes) with the Google Earth Engine (GEE) platform. The results indicated that the Landsat 8, GEE, and improved PPPM algorithm can effectively support the yearly mapping of paddy rice in NE Asia. The resultant paddy rice map has a high accuracy with the producer (user) accuracy of 73% (92%), based on the validation using very high resolution images and intensive field photos. Geographic characteristics of paddy rice distribution were analyzed from aspects of country, elevation, latitude, and climate. The resultant 30-m paddy rice map is expected to provide unprecedented details about the area, spatial distribution, and landscape pattern of paddy rice fields in NE Asia, which will contribute to food security assessment, water resource management, estimation of greenhouse gas emissions, and disease control.

DOI PMID

[25]
Goldblatt R, You W, Hanson G, et al.Detecting the boundaries of urban areas in India: A dataset for Pixel-Based image classification in Google Earth engine[J]. Remote Sensing, 2016,8(8):634.Urbanization often occurs in an unplanned and uneven manner, resulting in profound changes in patterns of land cover and land use. Understanding these changes is fundamental for devising environmentally responsible approaches to economic development in the rapidly urbanizing countries of the emerging world. One indicator of urbanization is built-up land cover that can be detected and quantified at scale using satellite imagery and cloud-based computational platforms. This process requires reliable and comprehensive ground-truth data for supervised classification and for validation of classification products. We present a new dataset for India, consisting of 21,030 polygons from across the country that were manually classified as “built-up” or “not built-up,” which we use for supervised image classification and detection of urban areas. As a large and geographically diverse country that has been undergoing an urban transition, India represents an ideal context to develop and test approaches for the detection of features related to urbanization. We perform the analysis in Google Earth Engine (GEE) using three types of classifiers, based on imagery from Landsat 7 and Landsat 8 as inputs. The methodology produces high-quality maps of built-up areas across space and time. Although the dataset can facilitate supervised image classification in any platform, we highlight its potential use in GEE for temporal large-scale analysis of the urbanization process. Our methodology can easily be applied to other countries and regions.

DOI

[26]
Patel N N, Angiuli E, Gamba P, et al.Multitemporal settlement and population mapping from Landsat using Google Earth Engine[J]. International Journal of Applied Earth Observation and Geoinformation, 2015,35(B):199-208.As countries become increasingly urbanized, understanding how urban areas are changing within the landscape becomes increasingly important. Urbanized areas are often the strongest indicators of human interaction with the environment, and understanding how urban areas develop through remotely sensed data allows for more sustainable practices. The Google Earth Engine (GEE) leverages cloud computing services to provide analysis capabilities on over 40 years of Landsat data. As a remote sensing platform, its ability to analyze global data rapidly lends itself to being an invaluable tool for studying the growth of urban areas. Here we present (i) An approach for the automated extraction of urban areas from Landsat imagery using GEE, validated using higher resolution images, (ii) a novel method of validation of the extracted urban extents using changes in the statistical performance of a high resolution population mapping method. Temporally distinct urban extractions were classified from the GEE catalog of Landsat 5 and 7 data over the Indonesian island of Java by using a Normalized Difference Spectral Vector (NDSV) method. Statistical evaluation of all of the tests was performed, and the value of population mapping methods in validating these urban extents was also examined. Results showed that the automated classification from GEE produced accurate urban extent maps, and that the integration of GEE-derived urban extents also improved the quality of the population mapping outputs.

DOI

[27]
Tang Z, Li Y, Gu Y, et al.Assessing Nebraska playa wetland inundation status during 1985-2015 using Landsat data and Google Earth Engine[J]. Environmental Monitoring and Assessment, 2016,188(12):654.Playa wetlands in Nebraska provide globally important habitats for migratory waterfowl. Inundation condition is an important indicator of playa wetland functionality. However, there is a lack of long-

DOI PMID

[28]
Wei W, Wu W, Li Z, et al.Selecting the optimal NDVI time-series reconstruction technique for crop phenology detection[J]. Intelligent Automation and Soft Computing, 2016,22(2SI):237-247.new scored method has been proposed in this study to evaluate the performances of different NDVI time-series reconstruction techniques. By giving a synthetic score to each of the candidates techniques based on two quantified criteria the optimal one is selected for the purpose of phenology detection. Three widely used techniques including Asymmetric Gaussian function fitting (AG), Double Logistic function fitting (DL) and Savitzky-Golay filtering (SG) are compared using NDVI time-series products from Moderate Resolution Imaging Spectroradiometer (MODIS) on Terra satellite over cropland of Northeast China. The results show that AG approach outperforms the two others in our study area. Cropland NDVI values have been improved obviously after the reconstruction by AG. Spatial patterns of the crop phenology detected from the AG reconstructed NDVI time-series are reasonable. The errors of the derived crop phenology metrics are within an acceptable limit.

DOI

[29]
Ke Y, Im J, Lee J, et al.Characteristics of Landsat 8 OLI-derived NDVI by comparison with multiple satellite sensors and in-situ observations[J]. Remote Sensing of Environment, 2015,164:298-313.Vegetation indices are important remotely sensed metrics for ecosystem monitoring and land surface process assessment, among which Normalized Difference Vegetation Index (NDVI) has been most widely used. The newly launched Landsat 8 Operational Land Imager (OLI) sensor, together with its predecessor Landsat 7 Enhanced Thematic Mapper Plus (ETM02+), provides continuous earth observations with an 8-day interval. The design improvements of the new sensor, including narrower near-infrared waveband, higher signal-to-noise ratio (SNR), and greater radiometric sensitivity highlight the need for investigating the land surface observation properties, especially its consistency with data from its predecessors and other satellite sensors. This study aims to evaluate the characteristics of Landsat 8 OLI-derived NDVI against Landsat 7 ETM02+ by cross-comparison and by comparing with Moderate Resolution Imaging Spectroradiometer (MODIS) and Geostationary Ocean Color Imager (GOCI)-derived NDVIs as well as in-situ NDVI measurements. Simulations of Top of Atmosphere (TOA) reflectance and surface reflectance of broadleaf trees and water were conducted for Landsat 8 OLI, Landsat 7 ETM02+, and MODIS in order to evaluate the impact of band pass difference on NDVI calculation. Four consecutive pairs of Landsat 8 OLI and Landsat 7 ETM02+ data over China and Korea were examined, and NDVIs derived from TOA reflectance and surface reflectance by three atmospheric correction methods were evaluated. Both simulations and comparisons showed that NDVIs derived from atmospherically-corrected surface reflectance had good consistency, while the simulation showed that the agreement varied with atmospheric characteristics. The four pairs of Landsat 8 OLI and Landsat 7 ETM02+ NDVI had a mean bias error within ±020.05, and R 2 from 0.84 to 0.98. Vegetated land cover types were found to have better NDVI agreement than non-vegetated land cover types. Especially, Landsat 8 OLI consistently generated lower NDVI values in water area than Landsat 7 ETM02+, which resulted from higher aerosol optical thickness in atmosphere. Landsat 8 OLI-derived NDVI showed better agreement with MODIS and GOCI NDVI than Landsat 7 ETM02+, mainly on vegetated surfaces. Both Landsat 8 OLI and Landsat 7 ETM02+ surface reflectance-derived NDVI agreed well with in-situ light emitting diode (LED) NDVI measurements at a homogeneous deciduous forest site. Landsat 8 OLI was also found to produce higher spatial variability of NDVIs than Landsat 7 ETM02+ at vegetated and urban areas, but lower variability on water area. The overall good agreement between Landsat 8 OLI NDVI and Landsat 7 ETM02+, MODIS and GOCI NDVIs as well as in-situ measurements ensures that it is reliable to integrate the new sensor observations with those from the multiple satellite sensors, given that the same atmospheric correction methods are applied. Furthermore, the greater NDVI contrast between vegetated areas and water areas, and the higher spatial variability of Landsat 8 OLI NDVI indicated that the new sensor has better capability in land surface process monitoring, such as land cover mapping, spatiotemporal dynamics of vegetation growth, and drought assessment.

DOI

[30]
Wu M, Wu C, Huang W, et al.An improved high spatial and temporal data fusion approach for combining Landsat and MODIS data to generate daily synthetic Landsat imagery[J]. Information Fusion, 2016,31:14-25.Because of low temporal resolution and cloud influence, many remote-sensing applications lack high spatial resolution remote-sensing data. To address this problem, this study introduced an improved spatial and temporal data fusion approach (ISTDFA) to generate daily synthetic Landsat imagery. This algorithm was designed to avoid the weaknesses of the spatial and temporal data fusion approach (STDFA) method, including the sensor difference and spatial variability. A weighted linear mixed model was used to adjust the spatial variability of surface reflectance. A linear-regression method was used to remove the influence of differences in sensor systems. This method was tested and validated in three study areas located in Xinjiang and Anhui province, China. The other two methods, the STDFA and the Enhanced Spatial and Temporal Adaptive Reflectance Fusion Model (ESTARFM), were also applied and compared in those three study areas. The results showed that the ISTDFA algorithm can generate daily synthetic Landsat imagery accurately, with correlation coefficientrequal to 0.9857 and root mean square error (RMSE) equal to 0.0195, which is superior to the STDFA method. The ISTDFA method had higher accuracy than ESTARFM in areas greater than 200 200 MODIS pixels while the ESTARFM method had higher accuracy than the ISTDFA method in small areas. The correlation coefficientrhad a negative power relation with ratio of land-cover change pixels. A land-cover change of 20.25% pixels can lead to a reduced correlation coefficientrof 0.295 in the blue band. The accuracy of the ISTDFA method indicated a logarithmic relationship with the size of the applied area, so it is recommended for use in large-scale areas.

DOI

[31]
Wu M, Zhang X, Huang W, et al.Reconstruction of daily 30 m data from HJ CCD, GF-1 WFV, Landsat, and MODIS data for crop monitoring[J]. Remote Sensing, 2015,7(12):16293-16314.With the recent launch of new satellites and the developments of spatiotemporal data fusion methods, we are entering an era of high spatiotemporal resolution remote-sensing analysis. This study proposed a method to reconstruct daily 30 m remote-sensing data for monitoring crop types and phenology in two study areas located in Xinjiang Province, China. First, the Spatial and Temporal Data Fusion Approach (STDFA) was used to reconstruct the time series high spatiotemporal resolution data from the Huanjing satellite charge coupled device (HJ CCD), Gaofen satellite no. 1 wide field-of-view camera (GF-1 WFV), Landsat, and Moderate Resolution Imaging Spectroradiometer (MODIS) data. Then, the reconstructed time series were applied to extract crop phenology using a Hybrid Piecewise Logistic Model (HPLM). In addition, the onset date of greenness increase (OGI) and greenness decrease (OGD) were also calculated using the simulated phenology. Finally, crop types were mapped using the phenology information. The results show that the reconstructed high spatiotemporal data had a high quality with a proportion of good observations (PGQ) higher than 0.95 and the HPLM approach can simulate time series Normalized Different Vegetation Index (NDVI) very well with R2 ranging from 0.635 to 0.952 in Luntai and 0.719 to 0.991 in Bole, respectively. The reconstructed high spatiotemporal data were able to extract crop phenology in single crop fields, which provided a very detailed pattern relative to that from time series MODIS data. Moreover, the crop types can be classified using the reconstructed time series high spatiotemporal data with overall accuracy equal to 0.91 in Luntai and 0.95 in Bole, which is 0.028 and 0.046 higher than those obtained by using multi-temporal Landsat NDVI data.

DOI

[32]
Wu M, Niu Z, Wang C, et al.Use of MODIS and Landsat time series data to generate high-resolution temporal synthetic Landsat data using a spatial and temporal reflectance fusion model[J]. Journal of Applied Remote Sensing, 2012,6:1-8.Abstract Due to cloud coverage and obstruction, it is difficult to obtain useful images during the critical periods of monitoring vegetation using medium-resolution spatial satellites such as Landsat and Satellite Pour l'Observation de la Terre (SPOT), especially in pluvial regions. Although high temporal resolution sensors, such as the Advanced Very High Resolution Radiometer (AVHRR) and Moderate Resolution Imaging Spectroradiometer (MODIS), can provide high-frequency data, the coarse ground resolutions of these sensors make them unsuitable to quantify the vegetation growth processes at fine scales. This paper introduces a new data fusion model for blending observations of high temporal resolution sensors (e. g., MODIS) and moderate spatial resolution satellites (e. g., Landsat) to produce synthetic imagery with both high-spatial and temporal resolutions. By detecting temporal change information from MODIS daily surface reflectance images, our algorithm produced high-resolution temporal synthetic Landsat data based on a Landsat-7 Enhanced Thematic Mapper Plus (ETM+) image at the beginning time (T-1). The algorithm was then tested over a 185 x 185 km(2) area located in East China. The results showed that the algorithm can produce high-resolution temporal synthetic Landsat data that were similar to the actual observations with a high correlation coefficient (r) of 0.98 between synthetic imageries and the actual observations. (C) 2012 Society of Photo-Optical Instrumentation Engineers (SPIE). [DOI: 10.1117/1.JRS.6.063507]

DOI

Outlines

/