Orginal Article

A Realization Method of Navigation Electronic Map for Ground Station based on OpenStreetMap and 90 m SRTM

  • SONG Xiaohu ,
  • ZHU Jihong , *
Expand
  • State Key Laboratory of Artificial Intelligence, Computer Science and Technology, Tsinghua University, Beijing 100084, China
*Corresponding author: ZHU Jihong, E-mail:

Received date: 2016-12-09

  Request revised date: 2017-04-27

  Online published: 2017-07-10

Copyright

《地球信息科学学报》编辑部 所有

Abstract

Navigation electronic map is the only platform for operators to monitor unmanned vehicles. It is also an important information source for route planning as well as auto decision making. A navigation electronic map which covers wide territory and of high precision can provide more details and is an indispensable guarantee for a ground station task. Nowadays, the implementations of navigation electronic maps for unmanned vehicles are mainly based on secondary development on both online and offline map server platforms. These implementations may bring inevitable drawbacks. For one thing, map data and corresponding software such as MapX are very expensive. Even so, the map data always lacks flexibility for personal extensions such as altitude. Besides, the installation and configuration increases much difficulty for the ground station software developers. Finally, online platforms always rely on stable and high-speed Internet network environment, which is not always satisfied. With the development of free and open source geographic data and tools, individuals can easily modify and even construct their own map servers based on their individual needs. In this paper, we provide a new method to implement a navigation electronic map based on a widely crowd sourced map, which is called OpenStreetMap. Firstly, we set up a background tile service using raw OSM data. Then, we render 90 m SRTM data to a bunch of hill-shading and color coding raster files and define the rendering formats and layers in the configure file of the service style for each raster hill-shading and color coding file. Finally, we implement a client module in ground station to request tiles from the background service and present the map in the user interface. The navigation electronic map we implement covers all 0-18 zoom levels of the whole China and it provides 0-13 zoom levels of vivid topographic information and free of Internet limit. Besides, this navigation map we implement can also render other DEM sources and any other raster-format files, such as population, vegetation, precipitation and so on.

Cite this article

SONG Xiaohu , ZHU Jihong . A Realization Method of Navigation Electronic Map for Ground Station based on OpenStreetMap and 90 m SRTM[J]. Journal of Geo-information Science, 2017 , 19(7) : 901 -908 . DOI: 10.3724/SP.J.1047.2017.00901
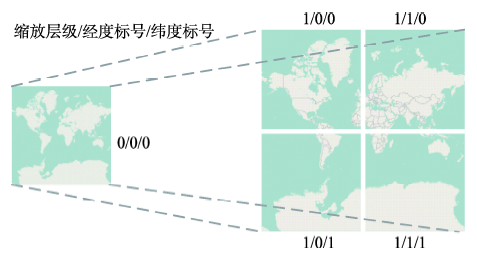
1 引言

地面导航是无人驾驶装备地面站的重要功能之一。在导航电子地图中实时准确地显示无人驾驶装备的航迹以及姿态等信息,能帮助地面站操作员判断无人驾驶装备的当前状态,也是操作员给出相关操作指令的重要依据。因此,覆盖地域范围广,信息类型丰富的导航电子地图是无人驾驶装备能够有效完成任务的重要保证。
当前导航电子地图的实现主要基于2种方式:①借助第三方的软件,如MapX、MapInfo等,通过购买特定格式的地图源数据,然后根据这些软件提供的类库进行二次开发[1];②通过Google Earth等在线地图服务提供的API进行二次开发[2]。这2种方式均有各自的缺陷:第①种方式增加了开发成本,数据量一般也较小;第②种方式依赖于快速稳定的网络环境,从而增加了任务失败的风险。
对其他数据类型,尤其是高程数据支持不足也是这2种实现方式的另一大弊端。目前,在无人装备地面站导航地图中整合多种类型的信息是地面站的发展趋势。早在2004年,有学者提出将虚拟现实技术应用在军用无人机地面站导航地图中的构想,他们认为一个三维的虚拟战场环境能够减少地面指挥员从多个导航地图界面中抽取分析有效信息的时间[3]。国内外学者尝试将高程数据处理成三维数据,并成功地将其应用到导航电子地图中[4-5],但是地图范围较小,还处在理论实验阶段。现有的2种实现方式均依赖对应的类库或框架,支持的地图信息种类固定,允许用户添加的自定义图层或样式类型较少,因此很难将高程等其他类型信息整合到导航地图中。
近年来,众包与自发地理信息的兴起和普及已经成为当前地球空间信息学重要的特征之一[6]。在此背景下,人人都是地理信息的提供者,开放的地理数据和开源易用的数据处理软件也使得普通用户设计实现符合个人需求的个性化地图成为可能[7-9]。本文即利用众包与自发地理信息最典型的代表OpenStreetMap以及公开开放的90 m SRTM数据,实现了应用于无人装备地面站的导航电子地图,并成功应用于某型无人机仿真系统中。由于OpenStreetMap数据全部开源,覆盖全球大部分区域,因此开发成本小、数据量大,并且不依赖互联网;同时,本文通过对90 m SRTM数据进行处理,以及对OpenStreetMap的渲染样式进行配置,使得OpenStreetMap支持高程数据的显示,从而克服了现有2种实现方式的缺陷。

2 数据源

2.1 OpenStreetMap

OpenStreetMap(简称OSM)是一个存储海量XML数据的数据库(在本文中简称原始OSM数据),只要注册账号,任何人均可以对其后台数据库进行编辑,从而被称为世界的维基地图[10]。尽管众源地图的编辑过程难以监控管理,但通过近年来的完善和修订,OpenStreetMap的质量已经得到众多学者的认可[11]
原始OSM数据使用点(Nodes)、线(Lines)、关系(Relations)以及标签(Tags)来表示地图中的道路、建筑等元素[10],因此OpenStreetMap可以满足普通电子地图的需求,当前也开始逐渐应用于导航和定位等领域[12-13],但是原始OSM数据对高程信息支持不够,一般不包括人文、经济等信息,因此仅使用原始OSM数据并不能满足地形图或其他不同类型专题地图的需求。
原始OSM数据不能直接显示为电子地图,需要经过引擎渲染得到瓦片(一般为栅格图片),然后按照需求呈现给用户。与百度地图和谷歌地图类似,OpenStreetMap同样使用墨卡托投影(Mercator Projection)[10]。这些瓦片按照放大缩小的层级以及投影的位置坐标存储在瓦片金字塔(Tile Pyramid)的结构中。瓦片金字塔结构的每个层级都有一张或多张瓦片;层级越高,瓦片数量越多,每张瓦片表示的范围也越小,绘制的信息越详细。经纬度标号相邻的瓦片连接在一起即可组成表示一定区域范围的地图。瓦片金字塔的结构使得一定的缩放层级下,每张瓦片和某个特定的经纬度范围存在一一对应的关系[14],本文中导航电子地图的实现即应用了该性质。
图1所示,5张瓦片均为使用OSM数据渲染的256×256的PNG格式图片,最左边的数字表示缩放层级,中间和右边的数字分别表示经度标号和纬度标号。左边瓦片的缩放层级为0,用来表示墨卡托坐标系下整个世界的全貌;右边瓦片的缩放层级为1,在该层级需要使用4张瓦片来表示整个世界的全貌,每张瓦片表示的范围比左边瓦片要小,但包含的信息更为详细。
Fig. 1 General view of the tile pyramid

图1 瓦片金字塔示意图

2.2 90 m SRTM

OpenStreetMap应用于无人驾驶装备地面站最大的问题在于其本身对高程信息支持不够,由于OpenStreetMap数据主要由参与者通过支持GPS 功能的设备获得,而通过GPS获取的高程和经纬度相比精度较差,误差较大,因此在原始OSM数据中很少保存采集的高程数据[15]。由于Mapnik样式文件支持用户添加自定义图层,为了将高程信息显示在OpenStreetMap地图中,一般将第三方的高程数据处理成OpenStreetMap渲染引擎能够处理的格式,然后将其与原始的OSM数据一同渲染成瓦片[16-17]
本文利用90 m SRTM高程数据和原始OSM数据搭建了能够提供高程信息的地图服务后台。SRTM全称航天飞机雷达地形测绘任务,其数据是一种典型的栅格类型高程数据 [18]。按照分辨率,SRTM数据可以分为30 m SRTM数据和90 m SRTM数据。目前,中国境内的90 m SRTM数据可以免费获取。

3 无人装备地面站导航电子地图技术实现

3.1 框架概述

本文实现的地面站导航电子地图主要包括瓦片服务后台和地图客户端模块2部分,如图2所示。
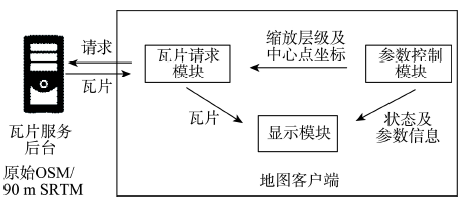
Fig. 2 Implementation framework of the navigation electronic map

图2 导航电子地图实现框架

瓦片服务后台可以将原始OSM数据和90 m SRTM数据渲染成瓦片,并通过HTTP协议向地图客户端提供服务。
地图客户端实现分为参数控制模块、瓦片请求模块以及显示模块3部分。其中,参数控制模块负责监听用户的操作或收到的数据,保存并更新飞行状态信息;瓦片请求模块通过接收控制模块的参数计算生成瓦片需求列表,并向瓦片服务后台请求瓦片;显示模块负责将请求返回的瓦片以及飞行状态信息绘制在地图面板上。

3.2 OpenStreetMap瓦片服务后台框架

瓦片服务后台集存储原始数据,处理瓦片请求,管理及渲染瓦片于一体,渲染引擎大都使用Mapnik工具包[19]图3为瓦片服务后台框架图。
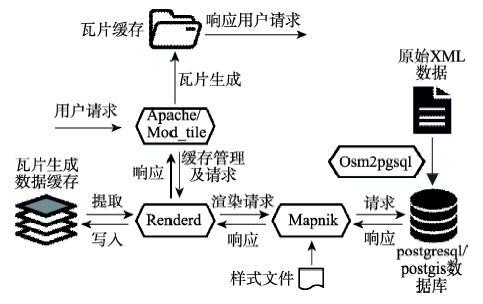
Fig. 3 Framework of the tile server background

图3 瓦片服务后台框架

其中,postgresql/postgis用于存储原始OSM数据。osm2pgsql工具用于将原始OSM数据导入postgresql/postgis数据库。Mod_tile和Renderd用来处理用户的请求,并管理渲染的瓦片。Mapnik是整个瓦片服务后台的渲染核心,通过样式配置文件定义了数据的来源以及每种数据渲染的样式。
本文利用Mapnik渲染生成的瓦片为PNG格式,像素大小为256×256的图片,每张瓦片的存储格式如下:zoom/x/y.png。其中zoom表示目录,对应缩放的层级,一般大小从0到18;x表示zoom下的子目录,对应瓦片的经度;y表示x目录下的png文件,对应瓦片的纬度。因此,每个瓦片都包含3个重要的参数,缩放层级、经度标号和纬度标号。在缩放层级为z的目录中,经度标号范围从0~2z-1,表示从西经180°到东经180°的范围;纬度标号范围从0~2z-1,在墨卡托坐标系下表示从北纬85.0511°到南纬85.0511°的范围;因此整个层级为z的目录中所包含的瓦片数量为2z×2z
通过HTTP协议,可以根据URI/zoom/x/y.png的网络路径向瓦片服务后台请求某个瓦片,其中URI表示服务器中存储瓦片文件的地址。

3.3 瓦片服务后台的90 m SRTM高程数据渲染

地形地貌可以表示为等高线(Elevation Contour Lines)、地形颜色渐变(Color Coding)以及地形阴影(Hill Shading)等[20-21]。其中等高线可以通过矢量格式保存,占用空间小,读取速度快,并且可以提供较为具体的数值,但等高线的读取判断不够直观。地形颜色渐变可以通过不同的颜色表示海拔,地形晕染不能表示海拔高度,而是通过不同的灰度值来描述地形的起伏,将地形颜色渐变层和地形晕染层进行叠加即可立体化地表示地形地貌。
单个90 m SRTM文件通过格式转换即可处理成地形颜色渐变和地形阴影栅格文件,再经过坐标转换即可投影到墨卡托坐标系。但这样会存在2个问题:(1)经过坐标转换会使相邻文件之间出现由于计算精度误差导致的重叠或空缺;(2)较低的层级下每个栅格文件的细节得不到充分表达,但由于渲染的栅格文件数量太多会导致后台服务效率过低。为了解决这些问题,在坐标转换前先将所有90 m SRTM数据文件虚拟为一个整体,经过重新采样以及坐标转换之后再将其分割,最后进行颜色渐变和晕染格式的处理。具体流程如图4所示。
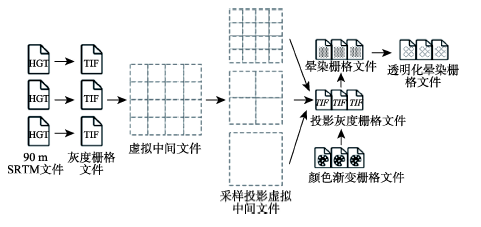
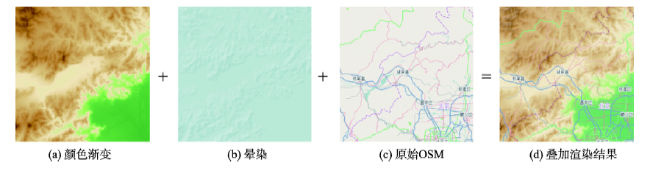
Fig. 4 Processing flow of color coding and hill-shading raster files

图4 颜色渐变和晕染栅格文件处理流程

通过配置Mapnik的样式文件,可以将透明化处理的晕染栅格文件与颜色渐变栅格文件以及原始的OSM数据层叠加,即可显示出起伏变化的立体地形地貌图效果(图5)。
Fig. 5 General view of the background tile rendering

图5 后台瓦片渲染示意图

图5中4张瓦片均表示第8层级,经度编号为210,纬度编号为96的北京同一区域。从前3张瓦片左至右分别为颜色渐变、透明化处理的晕染以及原始的OSM数据渲染瓦片,最后一张瓦片由前3张瓦片叠加而成,也即瓦片服务后台最终渲染的效果。
在较高的缩放层级下,90 m SRTM高程数据已经不能满足其精度要求,因此本文中在第0-13个缩放层级中显示地形图背景,而在第14-18个层级只显示原始的OSM数据。最终导航电子地图的渲染流程如图6所示。
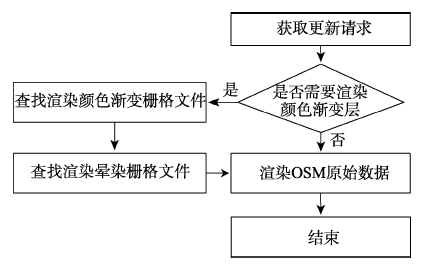
Fig. 6 Rendering process of the tile server background

图6 瓦片服务后台的渲染流程

3.4 地面站软件中地图客户端模块的实现

地图客户端模块需要具备如下3个功能。首先,能够根据地图参数,使用HTTP协议根据瓦片列表从后台获取瓦片并显示成电子地图;其次,可以在电子地图上绘制航迹、飞行器当前的位置等状态信息;最后,能够对用户的操作或接收的数据进行响应,并对地图进行更新。其中从后台获取瓦片并进行绘制是地图客户端模块的关键。
文献[14]给出了特定缩放级别下经纬度和瓦片标号的换算公式[14]。本文中需要使用的变量如表1所示。本文显示地图的面板大小不变,面板的中心设定为无人驾驶装备回传的经纬度坐标。瓦片绘制的示意图如图7所示。其中深灰色区域表示显示面板,中心点用红色圆圈表示;粗虚线围成的浅灰色区域表示瓦片序列,由虚线围成的正方形表示每张瓦片,中间的浅蓝色瓦片即为中心点所在的瓦片。在一次瓦片获取过程中,首先根据显示面板中心点所表示经纬度坐标计算出所在瓦片的经纬度标号cen_xcen_y,以及偏移off_xoff_y[14]。然后根据显示面板的宽度和高度可以确定瓦片序列的经纬度标号范围(即left_xright_xup_ydown_y)以及每个瓦片在地图面板中的显示位置。
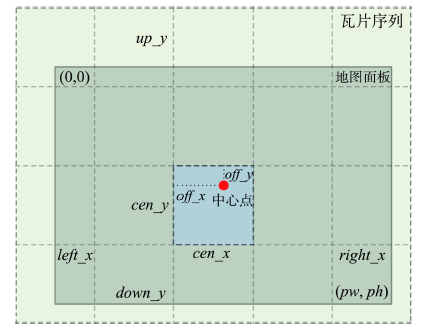
Tab. 1 Variables used in the map client module

表1 地图客户端模块中所使用的变量

变量 描述
lon 地图中心点的经度
lat 地图中心点的纬度
z 当前缩放层级
fx 地图中心点所在瓦片经度标号计算值
fy 地图中心点所在瓦片纬度标号计算值
cen_x 地图中心点所在瓦片的经度标号
cen_y 地图中心点所在瓦片的纬度标号
off_x 地图中心点经度坐标在所在瓦片的偏移
off_y 地图中心点纬度坐标在所在瓦片的偏移
w 瓦片的宽度,即256
h 瓦片的高度,即256
pw 窗口的宽度
ph 窗口的高度
left_x 地图面板最左侧瓦片的经度标号
right_x 地图面板最右侧瓦片的经度标号
up_y 地图面板最上方瓦片的经度标号
down_y 地图面板最下方瓦片的经度标号
Fig. 7 General view of the tile plotting in the map client module

图7 地图客户端瓦片绘制示意图

瓦片经纬度标号范围的计算如式(1)-(4)所示。
left _ x = ( 1 2 × pw - off _ x ) / w (1)
rig h t _ x = ( 1 2 × pw - ( w - off _ x ) ) / w (2)
up _ y = ( 1 2 × p h - off _ y ) / h (3)
down _ y = ( 1 2 × p h - ( h - off _ y ) ) / h (4)
通过地图中心所在瓦片的偏移可以确定所有瓦片的显示位置。假设某张瓦片的经纬度标号为xy,那么该瓦片左上角顶点在地图面板的显示坐标(coord_x, coord_y),如式(5)和(6)所示。
coord _ x = 1 2 × pw - off _ x + x - cen _ x × w (5)
coord _ y = 1 2 × p h - off _ y + y - cen _ y × h (6)
在地图面板上绘制完所有的瓦片之后,还需绘制飞行航迹,当前的时间、经度和纬度等飞行状态数据,从而形成一个完整的绘制周期,具体流程如图8所示。
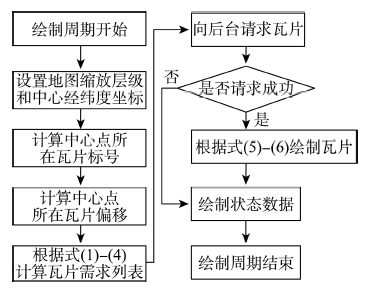
Fig. 8 A plotting period of the map client module

图8 地图客户端模块绘制周期

4 应用实验与结果分析

本文使用可以覆盖全中国的原始OSM数据,大小为249 M;能够覆盖中国的90 m SRTM数据,共1899个文件,大小为5.1 G左右。对90 m SRTM数据进行3种采样,将其分辨率处理为5760、720和90 m,并分别在0-4、5-9以及10-13的缩放层级下进行显示。表2是最终处理的栅格文件信息,“C”表示颜色渐变栅格文件,“S”表示地形阴影文件。如表2所示,栅格文件所占的空间远远大于同样的地域范围下矢量的原始OSM数据。
Tab. 2 Information of the raster files after processing

表2 处理后的栅格文件信息

5760 m C 5760 m S 720 m C 720 m S 90 m C 90 m S
文件数量/个 2 2 63 63 3300 3300
大小 3.3 M 4.4 M 221.2 M 295.5 M 13.2 G 2.94 G
将地面站软件所在的主机和瓦片后台主机部署在同一网段,地图客户端模块即可通过HTTP请求获取瓦片,并显示导航地图。本文中,部署了两台地面站软件和一台瓦片服务后台主机,网络配置如图9所示。
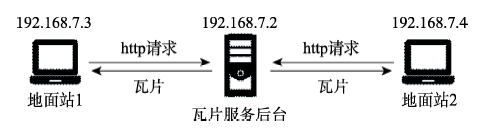
Fig. 9 Ground station software requesting tile services from the backstage supporter

图9 地面站软件向后台请求瓦片服务

本文实现了无人机地面站并成功用于无人机动力学仿真系统,如图10所示。在该仿真系统中,动力学模型软件可以对地面站软件给出控制指令,并将仿真的状态数据返回地面站,地面站数据可以根据状态数据实时更新地图,并绘制航迹以及其他状态信息。
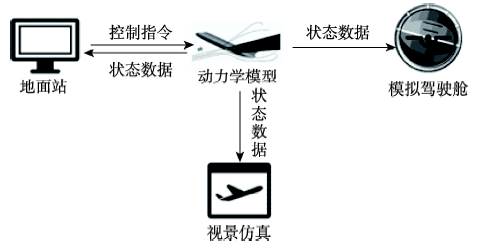
Fig. 10 A simulation system of the UAV flight dynamics

图10 某型无人机动力学仿真系统

图11是地面站软件中导航地图的显示效果,其中图11(a)为第4缩放层级下未收到任何动力学仿真数据时的地图,图11(b)为第9缩放层级下完成某次航迹装订仿真任务时的地图,绿色线表示本次任务过程中根据接收到的9567个航路点绘制的航迹。
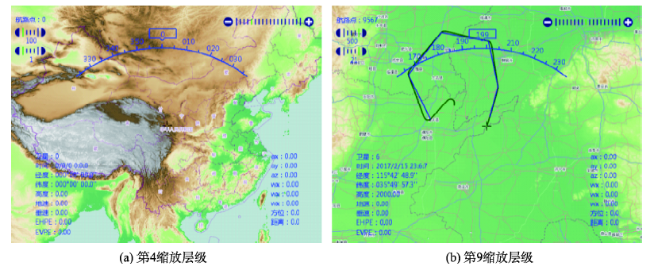
Fig. 11 The display effect of a map panel at different zoom levels

图11 不同缩放层级下的导航地图显示效果

5 结论

OpenStreetMap作为一种完全免费开放并可自由编辑的地图服务,在国内外被广泛应用于科学研究和项目开发。本文使用原始OSM以及90 m SRTM数据搭建了能够立体显示地形地貌的瓦片服务后台。通过实现地图客户端模块,成功将瓦片服务后台应用到无人驾驶装备的地面站导航电子地图中。该方法可不依赖网络使利用规模适中的数据显示范围广、内容详细的导航地图成为可能。使用本文中显示高程数据的方法,也可以将栅格格式的植被、人口等数据显示在地图中,从而使应用于无人装备的地面站导航地图能够提供更多类型的信息。
本文提出的导航电子地图设计方法还有如下不足:①相比于美国、日本以及大部分欧洲国家,中国部分的原始OSM数据量并不大,数据的完善程度和更新速度还有一定的差距,对精度要求较高的任务场景可能需要多源数据进行验证。② 本文所采用的90 m SRTM在缩放层级较低或适中的情况下尚可通过不同采样进行快速显示,而较高缩放层级下精度已不能满足要求,这极大地限制了地面站软件所能提供的高程支持。

The authors have declared that no competing interests exist.

[1]
李兴岷,邓红德,门雅彬.某型无人机地面站导航台的设计与实现[J].计算机测量与控制,2014,22(2):563-565.为了给地面站操纵人员提供无人机当前所处的位置及飞行参数信息,对无人机进行导航,使无人机能够安全稳定地飞行,文章参考人机界面开发原则设计实现了无人机地面站导航台;导航台以Labwindows/cVI为软件基础开发平台并采用MapX组件技术,实现了无人机航迹规划、飞行位置实时跟踪及飞行航迹显示等功能;经半实物仿真实验测试,结果表明导航台的设计达到了系统功能要求,能够高效、正确地完成各项导航任务。

DOI

[ Li X M, Deng H D, Men Y B.Design and implementation of navigation station for UAV ground control station[J]. Computer Measurement & Control, 2014,22(2):563-565. ]

[2]
Chadil N, Russameesawang A, Keeratiwintakorn P.Real-time tracking management system using GPS, GPRS and Google Earth[C]. 2008 5th International Conference on Electrical Engineering/Electronics, Computer, Telecommunications and Information Technology, 2008:393-396.

[3]
Walter B E, Knutzon J S, Sannier A V, et al.Virtual UAV Ground Control Station[C]. AIAA 3rd “Unmanned Unlimited” Technical Conference, Workshop and Exhibit, Chicago, Illinois, 2004.

[4]
Swartzentruber L, Jung L F, Winer E H.Three-dimensional multi-objective UAV Path planner using terrain information[C]. Proceedings of 17th Annual AIAA Structures, Structural Dynamics, and Materials Conference. British Columbia, Palm Springs, California, 2009.

[5]
刘洋,刘慧霞,韩泉泉.三维GIS下无人机地面站导航监控软件设计[J].火力与指挥控制,2013,38(11):121-124.

[ Liu Y, Liu H X, Han Q Q.Design of 3D GIS navigation surveillance and control software for UAV’s groud control station[J]. Fire Control & Command Control, 2013,38(11):121-124. ]

[6]
李德仁. 展望大数据时代的地球空间信息学[J].测绘学报,2016,45(4):379-384.20世纪90年代,随着全球信息化和互联网的推进,地球空间信息学应运而生,推动了数字地球和数字城市的建设。21世纪以来,随着全球信息化与工业化的高度集成发展,出现了物联网和云计算,人类进入了大数据时代。本文论述大数据时代地球空间信息学的特点(无所不在、多维动态、互联网+网络化、全自动与实时化、从感知到认知、众包与自发地理信息、面向服务)和必须解决的主要关键技术问题(全球空天地一体化的非线性地球参考框架构建技术、星基导航增强技术、天地一体化网络通信技术、多源成像数据在轨处理技术、天基信息智能终端服务技术、天基资源调度与网络安全、基于载荷的多功能卫星平台设计与研制)。本文最后给出大数据时代地球空间信息学的新定义,即地球空间信息学是用各种手段和集成各种方法对地球及地球上的实体目标(physical objects)和人类活动(human activities)进行时空数据采集、信息提取、网络管理、知识发现、空间感知认知和智能位置服务的一门多学科交叉的科学和技术。从这个新定义出发,地球空间信息学将在构建智慧地球和智慧城市的大数据时代面临更多的发展机遇和艰巨的任务,必将为人类社会的进步和可持续发展作出更大的贡献。

DOI

[ Li D R.Towards geo-spatial information science in big data era[J]. Acta Geodaetica et Cartographica Sinica, 2016,45(4):379-384. ]

[7]
李志林,刘启亮,高培超.地图信息论:从狭义到广义的发展回顾[J].测绘学报,2016,45(7):757-767.

[ Li Z L, Liu Q L, Gao P C.Entropy-based cartographic communication models: evolution from special to general cartographic information theory[J]. Acta Geodaetica et Cartographica Sinica, 2016,45(7):757-767. ]

[8]
郑束蕾. 个性化地图的认知机理研究[J].测绘学报,2016,45(8):1008.正如今,地图的用户需求、数据来源、设计方法、显示介质、服务程度等都在呼唤个性化。生物信息技术中的眼动追踪方法能够为揭示地图认知过程实时地提供定性和定量依据,从而对地图认知与设计研究提供参考。但目前国内还未见对个性化地图认知的眼动研究。本文主要采用眼动试验方法,辅以问卷调查和统计分析,对个性化地图认知的理论框架、构成因素、评估方法、作用机制、个体差异等进行研究,具体内容如下:

DOI

[ Zheng S L.Research on personalized map cognition mechanism[J]. Acta Geodaetica et Cartographica Sinica, 2016,45(8):1008. ]

[9]
Choosumrong S, Raghavan V, Jeefoo P, et al.Development of service oriented Web-GIS platform for monitoring and evaluation using FOSS4G[J]. International Journal of Geo-informatics, 2016,12(3):67-77.Abstract The usage of mobile devices has proliferated over the last decade. Smart phones now come with advanced technologies like Global Positioning System (GPS), advanced camera and sensors. Nowadays, mobile devices are used for different purposes such as individual tracking, checking current location and also collecting geo referenced information. A-Mobile GIS system offers geospatial functionality on smart phone devices by combining visualization with positioning. Due to these advancements, data can be collected easily in digital formats during field surveys and integrated into a desktop GIS for further processing and analysis. Further, Remote Sensing imagery and digital maps can be used as a reference backdrop for collecting data As the existing GIS data can be easily accessed in the field in both offline and online modes, information from geospatial analysis can be verified and validated. In this study, we discuss the implementation of an Open Source Mobile GIS framework using the client-server model to addresses the present needs of data -assimilation using smart phones. Further, geo-processing services can accessed on mobile devices and the results of geospatial analysis can be visualized in near real time. The proposed platform is generic and can be used to provide location based geospatial services for several application scenarios. The entire system has been implemented using Free and Open Source Software, and Open Geospatial Standards. It provides functionality for spatial data management and manipulation remotely. In this study, we demonstrate the utilization of the system for monitoring and evaluation of scenarios for Emergency Medical Service (EMS) tracking and management of vehicle road trips and for the monitoring and evaluation of mangrove forests. The system is easily customizable for other situations.

[10]
Arsanjani J J, Zipf A, Mooney P, et al. An introduction to openstreetmap in geographic information science: experiences, research, and applications[C]. Lecture Notes in Geo-information and Cartography, Springer International Publishing Switzerland, 2015:1-15.

[11]
Donchyts G, Schellekens J, Winsemius H, et al.A 30 m resolution surface water mask including estimation of positional and thematic differences using Landsat 8, SRTM and OpenStreetMap: A case study in the murray-darling basin, australia[J]. Remote Sensing, 2016,8(5):386-408.Accurate maps of surface water are essential for many environmental applications. Surface water maps can be generated by combining measurements from multiple sources. Precise estimation of surface water using satellite imagery remains a challenging task due to the sensor limitations, complex land cover, topography, and atmospheric conditions. As a complementary dataset, in the case of hilly landscapes, a drainage network can be extracted from high-resolution digital elevation models. Additionally, Volunteered Geographic Information (VGI) initiatives, such as OpenStreetMap, can also be used to produce high-resolution surface water masks. In this study, we derive a high-resolution water mask using Landsat 8 imagery and OpenStreetMap as well as (potential) a drainage network using 30 m SRTM. Our approach to derive a surface water mask from Landsat 8 imagery comprises the use of a lower 15% percentile of Landsat 8 Top of Atmosphere (TOA) reflectance from 2013 to 2015. We introduce a new non-parametric unsupervised method based on the Canny edge filter and Otsu thresholding to detect water in flat areas. For hilly areas, the method is extended with an additional supervised classification step used to refine the water mask. We applied the method across the Murray-Darling basin, Australia. Differences between our new Landsat-based water mask and the OpenStreetMap water mask regarding positional differences along the rivers and overall coverage were analyzed. Our results show that about 50% of the OpenStreetMap linear water features can be confirmed using the water mask extracted from Landsat 8 imagery and the drainage network derived from SRTM. We also show that the observed distances between river features derived from OpenStreetMap and Landsat 8 are mostly smaller than 60 m. The differences between the new water mask and SRTM-based linear features and hilly areas are slightly larger (110 m). The overall agreement between OpenStreetMap and Landsat 8 water masks is about 30%.

DOI

[12]
Hu Y W, Gong J W, Jiang Y, et al.Hybrid map-based navigation method for unmanned ground vehicle in urban scenario[J]. Remote Sensing, 2013,5(8):3662-3680.To reduce the data size of metric map and map matching computational cost in unmanned ground vehicle self-driving navigation in urban scenarios, a metric-topological hybrid map navigation system is proposed in this paper. According to the different positioning accuracy requirements, urban areas are divided into strong constraint (SC) areas, such as roads with lanes, and loose constraint (LC) areas, such as intersections and open areas. As direction of the self-driving vehicle is provided by traffic lanes and global waypoints in the road network, a simple topological map is fit for the navigation in the SC areas. While in the LC areas, the navigation of the self-driving vehicle mainly relies on the positioning information. Simultaneous localization and mapping technology is used to provide a detailed metric map in the LC areas, and a window constraint Markov localization algorithm is introduced to achieve accurate position using laser scanner. Furthermore, the real-time performance of the Markov algorithm is enhanced by using a constraint window to restrict the size of the state space. By registering the metric maps into the road network, a hybrid map of the urban scenario can be constructed. Real unmanned vehicle mapping and navigation tests demonstrated the capabilities of the proposed method.

DOI

[13]
Heid M, Bettadapura A, Ito E, et al.A ground control station for multivehicular control and data visualization[C]. AIAA Science and Technology Forum and Exposition, Kissimmee, Florida, 2015.

[14]
Williams R T.Lambert and Mercator map projections in geology and geophysics[J]. Computers & Geosciences, 1995,21(3):353-364.Lambert and transverse Mercator map projections are used for topographic maps published by the U.S. Geological Survey, for the American State Plane coordinate system, and for the UTM grid system. The properties and mathematical equations for these projections are summarized. Utility computer programs in FORTRAN that accurately calculate latitude and longitude from Lambert or Mercator coordinates, or the inverse, are presented.

DOI

[15]
Jonathan B.OpenStreetMap: Be your own Cartographer[M]. Birmingham: Packet Publishing, 2010: 54-65.

[16]
Knerr T, Brandenburg F J.Merging Elevation Raster Data and OpenStreetMap Vectors for 3D Renders[D]. Passau: Computer Science Department of Informatics and Mathematics, University of Passau, 2013.

[17]
Goetz M, Zipf A.OpenStreetMap in 3D-Detailed insights on the current situation in germany[C]. Proceedings of the AGILE'2012 International Conference on Geographic Information Science, Avignon, 2012.

[18]
Jing C, Shortridge A, Lin S, et al.Comparison and validation of SRTM and ASTER GDEM for a subtropical landscape in Southeastern China[J]. International Journal of Digital Earth, 2014,7(12):969-992.This paper evaluates the quality characteristics of existing versions of 3-arc-second SRTM and 1-arc-second GDEM over Anji County, Zhejiang, China using reference elevations from a high-quality 1:10 k topographic map. Results show that SRTM has higher accuracy (RMSE =12.44 m) than GDEM (RMSE=14.20 m for Version 1, 12.76 m for Version 2); however, unsatisfactory void filling and an overall 1/2 pixel shift exits in SRTM version 4.1. Although spurious elevations over omitted water bodies still persist, GDEM Version 2 demonstrated significant improvement over Version 1. Accuracies of both SRTM and GDEM decrease on steeper slopes. Aspect also influences both the magnitude and the sign of errors. DEM accuracy in non-forested areas is considerably higher than that in forested areas. SRTM version 4.1 and GDEM version 2 possessed actual spatial resolutions of 90 m, despite both of them failed to match their nominal accuracies. SRTM Version 4.1 could be the first choice, while ASTER GDEM Version 2 would be a good alternative for areas where extensive voids exist in SRTM.

DOI

[19]
Amir P, Jeremy M, Steven F, et al.Towards an authoritative OpenStreetMap: Conflating OSM and OS opendata national maps’ road network[J]. ISPRS International Journal of Geo-Information, 2013,2(3):704-728.The quality aspects of OpenStreetMap (OSM), as the global representation of crowd-sourced mapping, have always been of priomary concern to academics. While the methodologies for checking its quality against the national maps have been implemented by a number of studies, there are minimal works on how to practically improve the quality of OSM towards being an authoritative map source. This paper presents a method for conflating road attributes, namely the name and reference code, of OSM with the Open Data provided by Ordnance Survey (the British national mapping agency). The added values in the proposed methodology include the daily updates and serving of the conflated maps via open Web Services. More importantly, the OSM crowd correction is facilitated by frequently highlighting and web-serving the individual differences. There are currently over 5,800 differences in matching road names and references between the two datasets. In addition to describing the conflation methodology, the different geographic distribution patterns of the identified differences are discussed. A negative effect of the road density on the ratio of the mismatched features between the two datasets is observable, evidenced by their different geographical distribution over the map. It is shown that the best correspondence between attributes exists in the very dense areas, followed by the very low density areas, and lastly in the middle to large sized cities.

DOI

[20]
Kennelly P J.Terrain maps displaying hill-shading with curvature[J]. Geomorphology, 2008,102:567-577.Many types of maps can be created by neighborhood operations on a continuous surface such as provided by a digital elevation model. These most commonly include first derivatives slope or aspect, and second derivatives planimetric or profile curvature. Such variables are often used in geomorphic analyses of terrain. First derivatives also provide subtle enhancements to hill-shaded maps. For example, some maps combine oblique and vertical illumination, with the latter reflecting variations in slope. This study illustrates how second derivative maps, in conjunction with hill-shading, can cartographically enhance topographic detail. A simple conic model indicates that image-tone edges where slope or aspect varies by less than 0.5 are visible on curvature maps. Hill-shaded images combined with curvature enhance the continuity of naturally occurring tonal edges, especially in strongly illuminated areas. Variations in planimetric and profile curvature seem to be especially effective at highlighting convergent and divergent drainages and variations in erosion rate between or within sedimentary units, respectively. Shading curvature with consideration given to illumination models can add detail to hill-shaded terrain maps in a manner similar to cognitive models employed by map viewers.

DOI

[21]
韩李涛,范克楠.三维地形颜色渐变渲染的光滑过渡方法研究[J].地球信息科学学报,2015,17(1):31-36.地形颜色渐变渲染是表达地形起伏变化或其他地学要素空间分布变化趋势的常用方法。在三维地学交互分析系统中观察分析三维地学信息时,需要依据观察位置和分析区域的范围大小不停地变化视角和视距。当观察距离很近时,利用包含一定颜色数的色带渲染地形会出现明显的颜色分层现象,不能很好地表达地形颜色的光滑过渡。针对三维地学交互分析系统对地形颜色渐变渲染的操作需求和存在的问题,分析了RGB和HSL两种颜色模型的特点,顾及OpenGL的颜色平滑过渡原理,在RGB颜色空间通过对所有颜色分量进行线性插值实现了地形双色渐变渲染,在HSL颜色空间通过固定饱和度、亮度,对色相进行线性插值实现了地形多色渐变渲染,并通过加入光照计算来增强地形颜色渐变晕渲的三维立体效果。实验结果表明:本文方法能很好地兼容OpenGL的平滑着色,实现三维交互环境下任意距离观察地形均能保持颜色之间光滑渐进过渡,达到更为光滑的地形颜色渐变渲染效果。

DOI

[ Han L T, Fan K N.Research on smooth transition of color rendering for 3D terrain[J]. Journal of Geo-information Science, 2015,17(1):31-36. ]

Outlines

/