
Journal of Geo-information Science >
Spatial Distribution of Land Surface Vegetation-Energy Relationship in Sanya Tropical Rain Forest Regions
Received date: 2017-04-18
Request revised date: 2017-05-25
Online published: 2017-07-10
Copyright
Land surface energy information of remote sensing describes the ecological process of regional ecosystem elements. The distribution and variation trends of land surface energy reflect structure and quality of regional ecosystem element. This study is based on the theory of ecology and aims to provide a scientific basis of preservation and restoration of forests in decision-making, prediction, implementation, verification and other aspects. In this study, we extracted the information about the comprehensive responses and interactive relationship between tropical rain forest and land surface energy in Sanya, using classes of vegetation greenness, land surface energy and the vegetation-energy relationship index to evaluate the quality of forest ecosystem. Vertical and horizontal distributions of tropical rain forest of 30 years (1987-2016) were used to discuss a change of spatial-temporal zonality. The following results are noted: (1) With around 90% of vegetation coverage in the past 30 years, classes of vegetation greenness are mainly composed of high and medium values, and has an increasing trend. (2) The low vegetation greenness and high land surface energy shifts to high vegetation greenness and low land surface energy from coastal area to mountain area. (3) The fluctuation of land surface energy distribution at all levels was less than 10%. Regions with medium energy expanded to low energy areas. (4) Tropical rain forest of high vegetation greenness increases with elevation increasing associated with land surface energy decreasing. (5) The ecological quality of the planted vegetation regions below 200 meters height, declined faster than that of planted vegetation regions above 400 meters height. Compared with planted vegetation regions, tropical rain forest regions have high spatial-temporally stability in both surface energy and vegetation greenness. In general, comprehensive response characteristics of remote sensing and their interactive relationship provide quantitative basis for evaluating the tropical rain forest ecosystems.
Key words: tropical rain forest; remote sensing; NDVI; land surface energy; ecosystems
YAO Wutao , GUAN Yanning , GUO Shan , CAI Danlu , XIAO Han , ZHANG Chunyan . Spatial Distribution of Land Surface Vegetation-Energy Relationship in Sanya Tropical Rain Forest Regions[J]. Journal of Geo-information Science, 2017 , 19(7) : 950 -961 . DOI: 10.3724/SP.J.1047.2017.00950
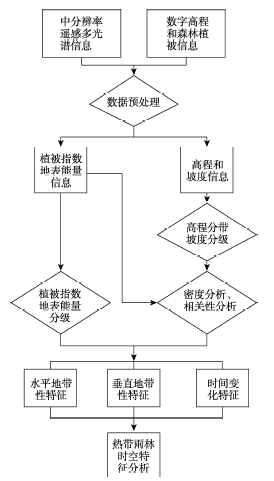
Fig. 1 Research framework and technical processes图1 研究框架与技术流程 |
Tab. 1 Description of elevation zoning表1 高程分带说明 |
| 高程/m | 类型 | 描述 | 面积/km2 |
|---|---|---|---|
| <20 | 山前平原 | 农田植被、人工林等 | 337.6 |
| 20~200 | 人工林 | 人工林、果园等 | 848.3 |
| 200~400 | 季雨林 | 热带常绿季雨林、其他类型天然林、人工林等 | 458.1 |
| 400~800 | 低山雨林 | 热带低山雨林、其他类型天然林等 | 289.4 |
| >800 | 低山与中山雨林 | 热带低山和中山雨林、其他类型天然林等 | 14.1 |
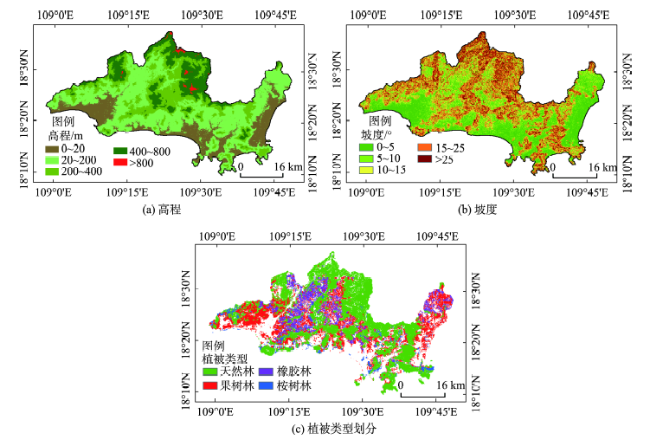
Fig. 2 Geographical setting of elevation, slope and vegetation types in Sanya图2 三亚高程、坡度、和植被类型划分示意图 |
Tab. 2 Description of slope ranges表2 坡度分级说明 |
| 坡度/° | 命名 |
|---|---|
| 0~5 | 平坡 |
| 5~10 | 缓坡 |
| 10~15 | 缓斜坡 |
| 15~20 | 斜坡 |
| >25 | 陡坡 |
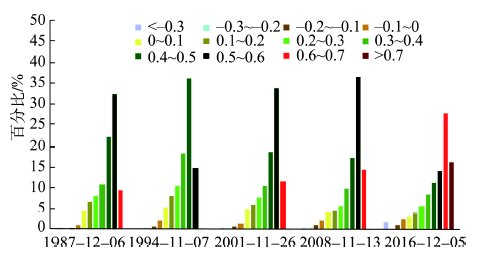
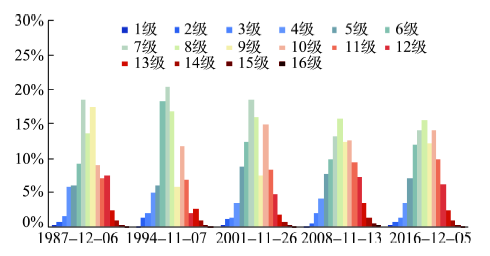
Fig. 3 Statistics of NDVI classes in Sanya图3 三亚植被指数构成分布 |
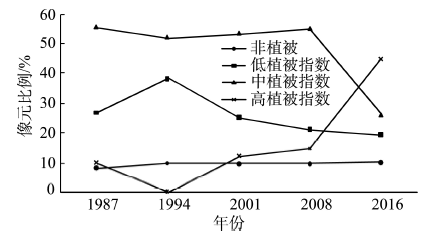
Fig. 4 NDVI changes in Sanya图4 三亚植被指数变化 |
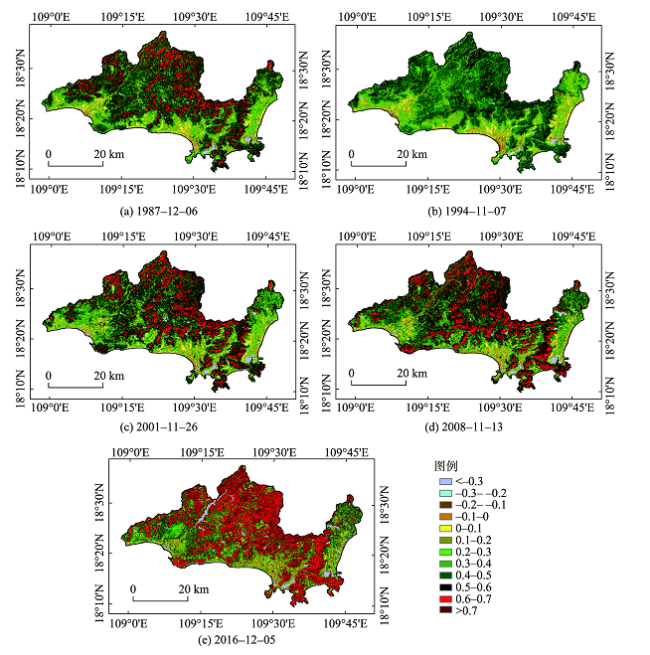
Fig. 5 Geographical setting of NDVI in Sanya图5 三亚植被指数空间分布特征 |
Fig. 6 Land surface energy distribution in Sanya图6 三亚地表能量构成分布 |
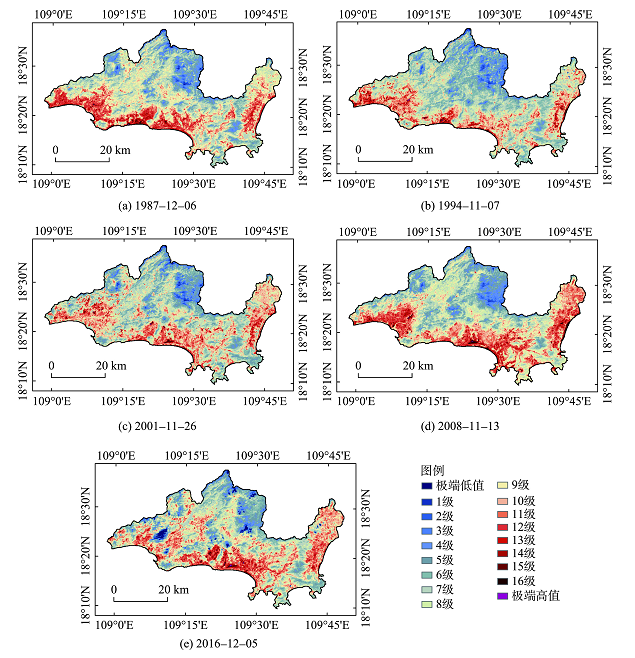
Fig. 8 Geographical setting of land surface energy in Sanya图8 三亚地表能量空间分布特征 |
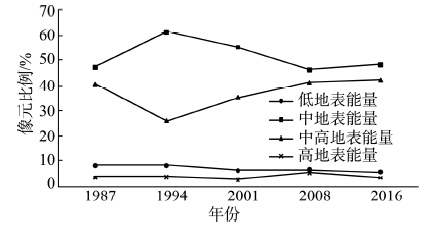
Fig. 7 Land surface energy change in Sanya图7 三亚地表能量变化 |
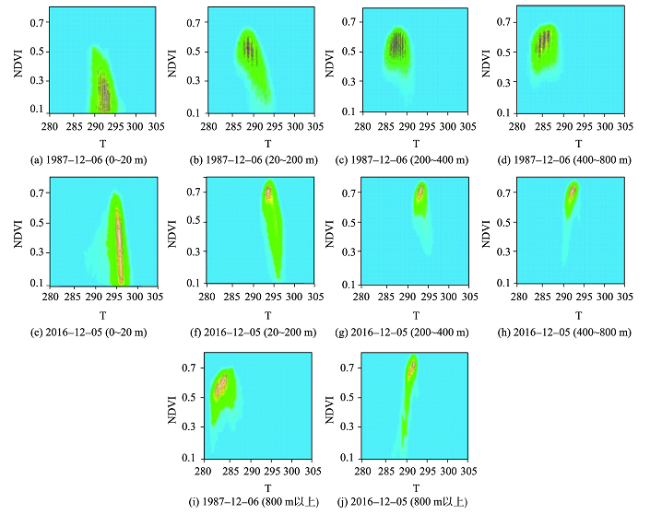
Fig. 9 Density analysis in (NDVI,T)-diagram associated with different elevation zones in Sanya图9 三亚高程带植被-能量三维密度分析 |
Tab. 3 Correlation analysis of the NDVI-T relationship associated with different elevation zones in Sanya表3 三亚高程带植被-能量相关性分析 |
| 高程/m | 1987年 | 1994年 | 2001年 | 2008年 | 2016年 | ||||||||||
|---|---|---|---|---|---|---|---|---|---|---|---|---|---|---|---|
| ∣r∣ | a | b | ∣r∣ | a | b | ∣r∣ | a | b | ∣r∣ | a | b | ∣r∣ | a | b | |
| <20 | 0.30 | -4.26 | 293.77 | 0.32 | -4.74 | 297.90 | 0.32 | -2.97 | 296.04 | 0.27 | -2.55 | 296.80 | 0.12 | -1.44 | 296.16 |
| 20~200 | 0.58 | -8.72 | 294.42 | 0.52 | -6.58 | 297.81 | 0.54 | -5.97 | 296.72 | 0.41 | -5.03 | 296.53 | 0.40 | -3.54 | 297.05 |
| 200~400 | 0.17 | -2.84 | 290.03 | 0.03 | -0.35 | 294.17 | 0.22 | -2.74 | 294.04 | 0.07 | -1.00 | 292.86 | 0.26 | -2.13 | 295.30 |
| 400~800 | 0.11 | 1.90 | 285.50 | 0.06 | 0.88 | 292.66 | 0.12 | 1.88 | 290.00 | 0.15 | 2.53 | 289.17 | 0.37 | 2.93 | 290.80 |
| >800 | 0.18 | 3.14 | 282.51 | 0.16 | 2.20 | 290.60 | 0.36 | 5.32 | 286.32 | 0.28 | 4.65 | 286.49 | 0.75 | 4.85 | 288.40 |
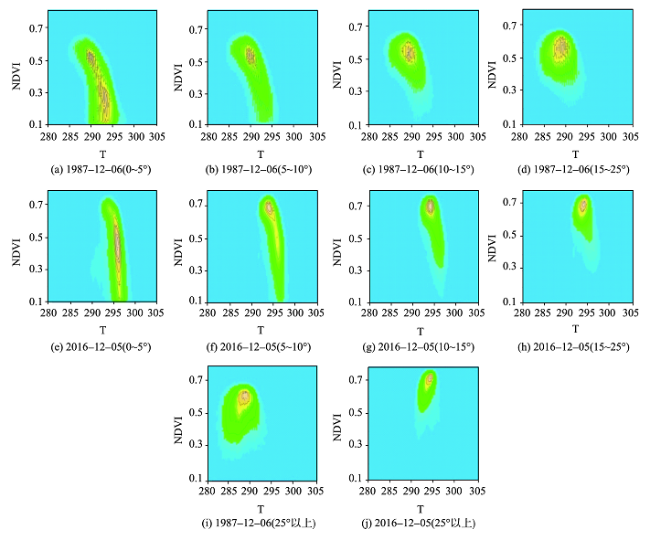
Fig. 10 Density analysis in (NDVI,T)-diagram associated with different slope ranges in Sanya图10 三亚坡度带植被-能量三维密度分析 |
Tab. 4 Correlation analysis of the NDVI-T relationship associated with different slope ranges in Sanya表4 三亚坡度带植被-能量相关性分析 |
| 坡度/° | 1987年 | 1994年 | 2001年 | 2008年 | 2016年 | ||||||||||
|---|---|---|---|---|---|---|---|---|---|---|---|---|---|---|---|
| ∣r∣ | a | b | ∣r∣ | a | b | ∣r∣ | a | b | ∣r∣ | a | b | ∣r∣ | a | b | |
| 0~5 | 0.64 | -9.35 | 294.85 | 0.65 | -8.60 | 298.55 | 0.56 | -5.77 | 296.69 | 0.53 | -6.60 | 297.47 | 0.27 | -2.64 | 296.65 |
| 5~10 | 0.65 | -10.80 | 294.99 | 0.64 | -8.73 | 298.37 | 0.61 | -7.56 | 297.13 | 0.53 | -7.83 | 297.37 | 0.41 | -3.90 | 297.01 |
| 10~15 | 0.44 | -9.14 | 293.69 | 0.42 | -6.71 | 297.31 | 0.50 | -7.73 | 296.90 | 0.38 | -7.12 | 296.58 | 0.34 | -3.59 | 296.45 |
| 15~20 | 0.17 | -4.01 | 290.47 | 0.13 | -2.31 | 295.08 | 0.26 | -4.64 | 294.93 | 0.16 | -3.43 | 294.21 | 0.12 | -1.32 | 294.66 |
| >25 | 0.16 | 3.32 | 285.94 | 0.21 | 3.48 | 292.06 | 0.18 | 3.21 | 290.19 | 0.21 | 4.58 | 289.23 | 0.29 | 3.14 | 291.36 |
The authors have declared that no competing interests exist.
| [1] |
|
| [2] |
|
| [3] |
|
| [4] |
|
| [5] |
|
| [6] |
|
| [7] |
[
|
| [8] |
[
|
| [9] |
[
|
| [10] |
|
| [11] |
|
| [12] |
[
|
| [13] |
[
|
| [14] |
|
| [15] |
[
|
| [16] |
|
| [17] |
[
|
| [18] |
中国科学院《中国自然地理》委员会.中国自然地理:地貌[M].北京:科学出版社,1980.
[ Chinese Academy of Sciences, Chinese natural geography Committee. Physical geography of China: Landforms[M]. Beijing: Science Press, 1980. ]
|
| [19] |
[
|
| [20] |
|
| [21] |
|
| [22] |
[
|
| [23] |
[
|
| [24] |
[
|
| [25] |
[
|
| [26] |
[
|
| [27] |
[
|
/
| 〈 |
|
〉 |