
Journal of Geo-information Science >
Kriging Interpolation Method Optimized by Multi-scale Least Squares Support Vector Machine
Received date: 2016-10-31
Request revised date: 2017-06-20
Online published: 2017-08-20
Copyright
Kriging interpolation method realizes spatial weighted estimation that meets the unbiasedness and optimality according to the position relationship between the estimated location sites and the known sample sites and regionalized variable spatial correlation. Traditional theoretical model shape is fixed and chosen with subjectivity, which can't reflect the changing trend and multi-scale spatial characteristics. The choice of scale and the treatment of scale effects also need to be considered. To solve the problems above, we propose a method of kriging interpolation optimized by multi-scale least squares support vector machine (LS-SVM), which provides a new idea for fitting experimental variogram. Starting from the changing trend of the actual sample data, least squares support vector machine fits experimental variogram and the results conform to the spatial changing trend of data itself. Secondly, the wavelet kernel as the LS-SVM kernel function, parameters can be adjusted according to different parts of the nuclear, which is flexible and variable. Finally, the multi-scale wavelet kernel using wavelet multi-resolution characteristics, can reflect the different details of spatial changes, to avoid the single scale LS-SVM ignoring the spatial details of the problem. Followed that, the experiment includes simulation and application. Experimental simulation mainly verifies scientific validity and accuracy by the optimized interpolation of multi-scale least squares support vector machine. Meanwhile, experimental application research of PM2.5 concentrations of temporal and spatial distribution provides the theoretical basis for city ecological protection and controlling. Final results show that kriging interpolation algorithm optimized by multi-scale least squares support vector machine is superior to the traditional method and single scale optimized kriging interpolation algorithm. It would be better to depict the variation function and reflect the different scales of spatial changes in details to further improve the accuracy of the interpolation to some extent, which is an optional kriging interpolation method.
CHE Lei , WANG Haiqi , FEI Tao , YAN Bin , LIU Yu , GUI Li , CHEN Ran , ZHAI Wenlong . Kriging Interpolation Method Optimized by Multi-scale Least Squares Support Vector Machine[J]. Journal of Geo-information Science, 2017 , 19(8) : 1001 -1010 . DOI: 10.3724/SP.J.1047.2017.01001
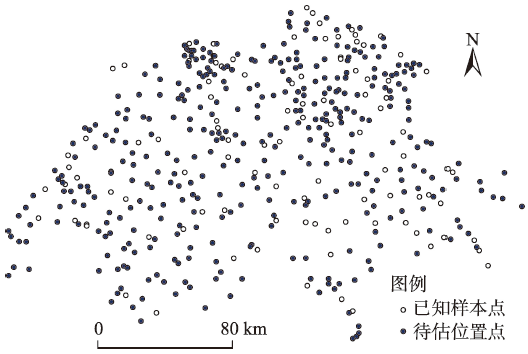
Fig. 1 The distribution diagram of SIC97 data图1 SIC97数据分布示意图 |
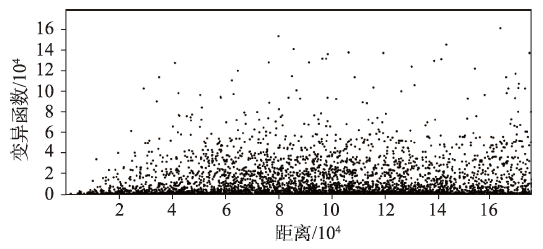
Fig. 2 Variogram cloud before grouping图2 分组前的变异函数云图 |
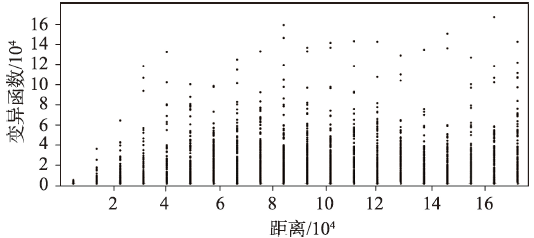
Fig. 3 Variogram cloud after grouping图3 分组前的变异函数云图 |
Tab. 1 Comparisons of Kriging interpolation results based on the theoretical variogram models表1 各理论变异模型拟合后的克里金插值结果对比 |
| 类别 | 球状模型 | 指数模型 | 高斯模型 | 单尺度 LS-SVM(RBF) | 单尺度 LS-SVM (wave) | 二尺度 LS-SVM (wave) |
|---|---|---|---|---|---|---|
| MAE | 39.43 | 40.86 | 110.46 | 39.81 | 39.09 | 38.54 |
| RMSE | 56.21 | 57.33 | 154.82 | 56.78 | 55.97 | 55.70 |
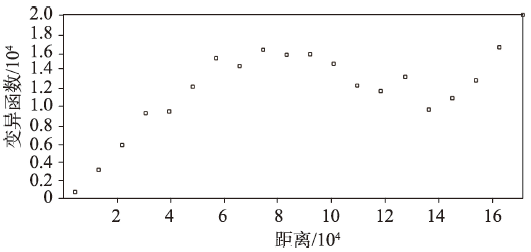
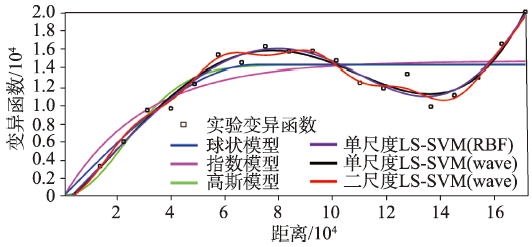
Fig. 4 The fitting experimental variogram values图4 需要拟合的实验变异函数值 |
Fig.5 Variogram fitting curve图5 变异函数拟合曲线 |
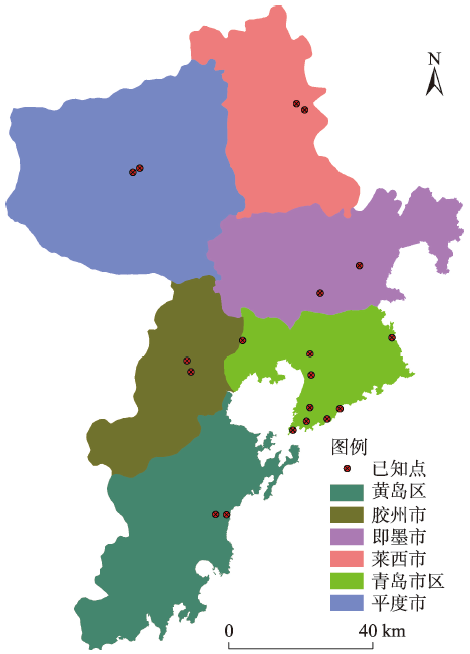
Fig. 6 The map of air quality monitoring sites in Qingdao city图6 青岛市空气质量监测站点分布图 |
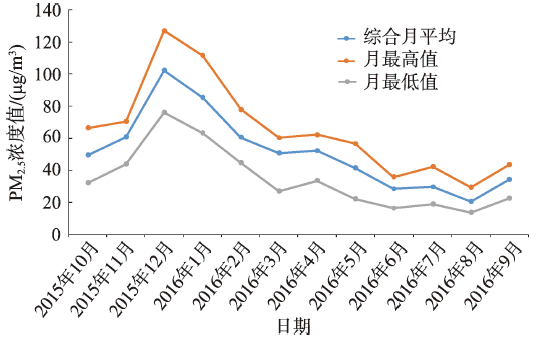
Fig. 7 Monthly PM2.5 concentration values of Qingdao city图7 青岛市各个月份PM2.5浓度值 |
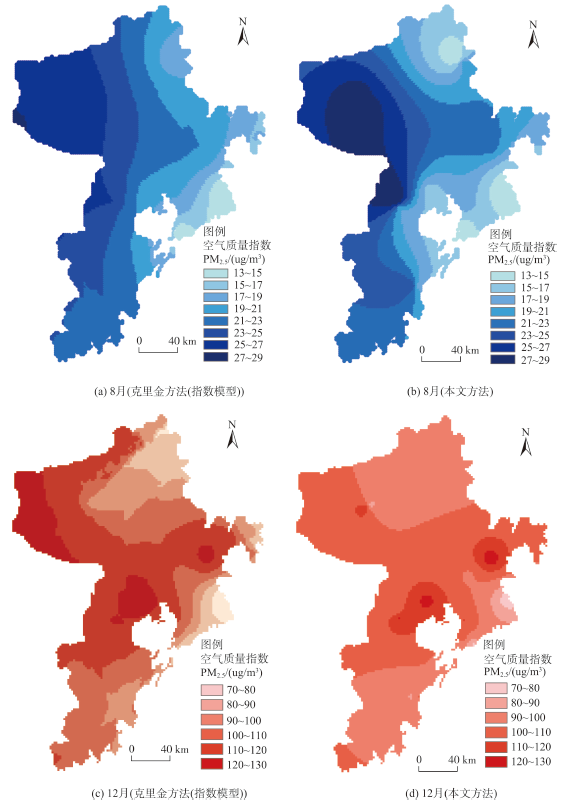
Fig. 8 Results of PM2.5 interpolation methods in Qingdao图8 青岛市PM2.5各插值方法结果分布图 |
Tab.2 The comparison of the interpolation results of each model in December表2 12月各模型插值结果对比 |
| 指标类别 | 高斯模型 | 指数模型 | 球状模型 | 单尺度 LS-SVM(RBF) | 单尺度 LS-SVM (wave) | 二尺度 LS-SVM (wave) |
|---|---|---|---|---|---|---|
| MAE | 14.41 | 12.52 | 12.54 | 12.47 | 12.46 | 12.42 |
| RMSE | 17.66 | 15.73 | 15.77 | 15.57 | 15.57 | 15.31 |
Tab. 3 The comparison of the interpolation results of each model in August表3 8月各模型插值结果对比 |
| 指标类别 | 高斯模型 | 指数模型 | 球状模型 | 单尺度 LS-SVM(RBF) | 单尺度 LS-SVM (wave) | 二尺度 LS-SVM (wave) |
|---|---|---|---|---|---|---|
| MAE | 3.62 | 3.47 | 3.49 | 3.56 | 3.44 | 3.44 |
| RMSE | 4.54 | 4.20 | 4.27 | 4.58 | 4.23 | 4.19 |
The authors have declared that no competing interests exist.
| [1] |
|
| [2] |
[
|
| [3] |
[
|
| [4] |
|
| [5] |
[
|
| [6] |
[ Xu J H. Quantitative geography[M]. Beijing: Higher Education Press, 2006. ]
|
| [7] |
[
|
| [8] |
[
|
| [9] |
[
|
| [10] |
|
| [11] |
[
|
| [12] |
[
|
| [13] |
|
| [14] |
|
| [15] |
|
| [16] |
[
|
| [17] |
[
|
| [18] |
[
|
| [19] |
[
|
| [20] |
[
|
| [21] |
|
| [22] |
|
| [23] |
[ Du Y W, Cheng J G, Wang J, et al. Temporal and spatial distribution of PM2.5 in Qingdao city and analysis of its sources in 2013[J]. Urban Environment & Urban Ecology, 2015,28(2):17-19. ]
|
/
| 〈 |
|
〉 |