
Journal of Geo-information Science >
A Multi-scale Visualization Method for the Trajectory Origin-Destination Data
Received date: 2017-01-05
Request revised date: 2017-05-17
Online published: 2017-08-20
Copyright
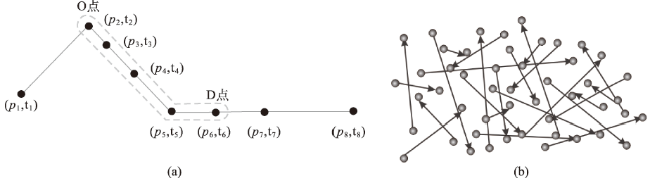
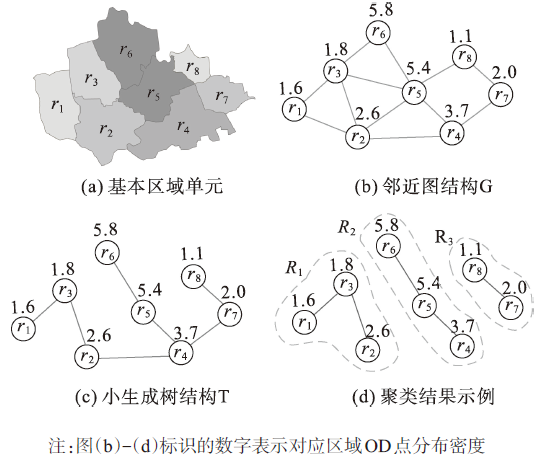
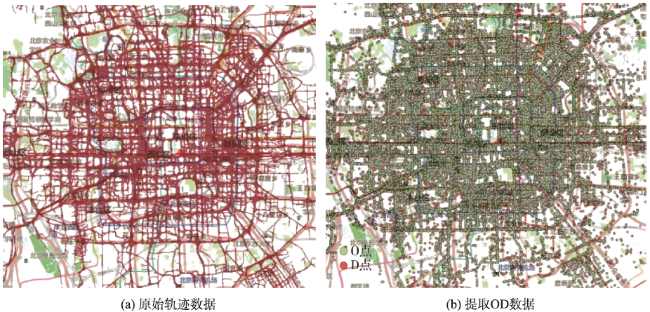
Based on the taxi trajectory data from the city of Beijing, this study proposes a multi-scale visualization approach for trajectory OD (Origin-Destination) data. First, we extract OD points from initial trajectory raw data eliminating invalid points. Then, the distribution space of OD data is subdivided by density analysis and administrative unit aggregation. Finally, we define relevant parameters to summarize inherent OD flow pattern and customize their presentation of multi-scale visualization. In the process above, three regionalization results, which correspond to block level, business district level and district level, are obtained by setting different values of the minimal area of the aggregated region. Therefore, representations at three different scales can be outputted. The experimental results confirmed that our method could effectively achieve the reduction of trajectory big data and reveal mobility pattern, which is helpful for future decision making.
JIN Cheng , CHEN Yuanyuan , YANG Min . A Multi-scale Visualization Method for the Trajectory Origin-Destination Data[J]. Journal of Geo-information Science, 2017 , 19(8) : 1011 -1018 . DOI: 10.3724/SP.J.1047.2017.01011
Fig. 1 Samples of trajectory Origin-Destination data图1 轨迹OD数据示例 |
Tab. 1 The original records of taxi trajectory data表1 出租车轨迹数据原始记录 |
| 字段名称 | 数据说明 | 数据示例 |
|---|---|---|
| V_ID | 车辆标识 | 206400 |
| Longitude | GPS经度/° | 116.4243011 |
| Latitude | GPS纬度/° | 40.0727348 |
| Time | GPS时间 | 20121101095636 |
| Event | 触发事件(0=变空车,1=变载客,3=其它) | 1 |
| SerState | 运营状态(0=空车,1=载客,2=驻车,3=停运,4=其他) | 1 |
| Speed | GPS速度/(km/h) | 43 |
| GPSState | GPS状态(0=无效,1=有效) | 1 |
Fig. 2 Steps of regional units classification图2 区域单元划分原理与步骤 |
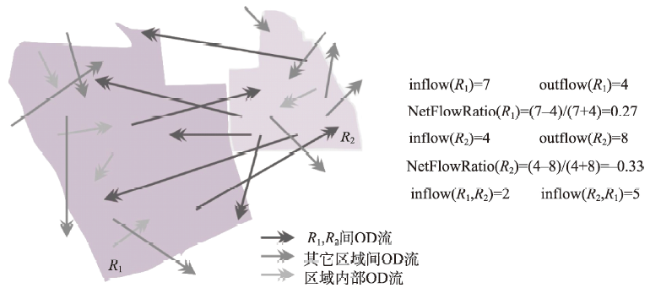
Fig. 3 Statistics of OD flow characteristics图3 OD流向特征统计参量示意图 |
Fig. 4 The original trajectory data and the extracted Origin-Destination points图4 原始出租车轨迹数据和提取的OD数据 |
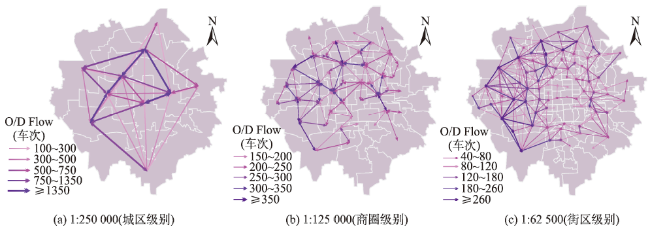
Fig. 5 Results of regional units and flow patterns at different scales图5 不同比例尺下的分区结果及提取的流向关系 |
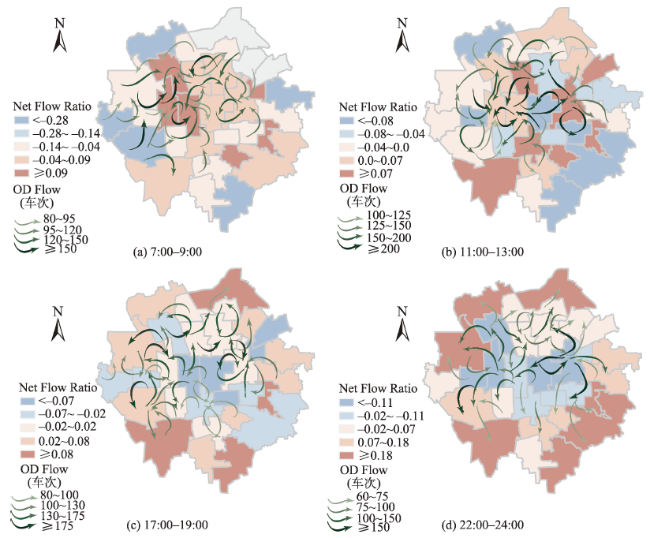
Fig. 6 Visualization of OD flow across different sub-regions图6 OD数据区域间流向关系的符号可视化结果 |
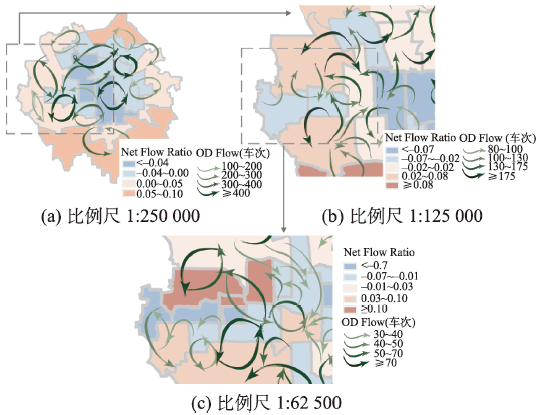
Fig. 7 Visualization of the flow characteristics at different scales图7 OD数据流向信息在不同比例尺下的表达效果 |
The authors have declared that no competing interests exist.
| [1] |
[
|
| [2] |
|
| [3] |
[ Long Y, Zhang Y, Cui C Y. Identifying commuting pattern of Beijing using bus smart card data[J]. Acta Geographica Sinica, 2012,67(10):1339-1352. ]
|
| [4] |
|
| [5] |
|
| [6] |
|
| [7] |
|
| [8] |
|
| [9] |
|
| [10] |
|
| [11] |
|
| [12] |
|
| [13] |
|
| [14] |
|
| [15] |
|
| [16] |
|
| [17] |
|
| [18] |
[
|
| [19] |
|
| [20] |
|
| [21] |
[
|
/
| 〈 |
|
〉 |