
Journal of Geo-information Science >
Study on the Distribution Characteristics and Regional Difference of Commercial Network in Jiangsu Province
Received date: 2017-04-05
Request revised date: 2017-05-04
Online published: 2017-08-20
Copyright
Based on the data of POI (point of interest) in Jiangsu Province and economic and social statistics data, we used the methods of the standard deviation ellipse, nuclear density, the nearest neighbor index, and multiple linear regression to discuss the spatial distribution pattern and agglomeration characteristics of urban commercial outlets at different levels and stages of development. We also revealed the influencing factors of regional differences in the wholesale and retails, residential and catering industries. It was found that the commercial outlets in Jiangsu Province had the distribution trend of moving northwest, indicating a relatively concentrated distribution pattern and the characteristics of agglomerating in the cities south of the Yangtze River and intensive layout in centers of the prefecture-level cities. The spatial distribution patterns of different types of outlets varied from one to another. In the wholesale and retail industries, the spatial clustering characteristics of outlets are the most significant, while the distribution of residential outlets is relatively balanced. The commercial structure of each city is characterized by the number of wholesale and retail outlets and restaurants, as the sales of wholesale and retail take the dominant place. The regional GDP, population size, per capita disposable income of residents, comprehensive accessibility of cities, and proportion of the tertiary industry are the main factors deciding the distribution of outlets. The influence of different factors on the distribution of commercial outlets diverse from each other. The proportion of the tertiary industry and regional GDP of Jiangsu Province have more powerful influence on the distribution of commercial outlets.
CHE Bingqing , JIAN Xiaobin , LU Yuqi . Study on the Distribution Characteristics and Regional Difference of Commercial Network in Jiangsu Province[J]. Journal of Geo-information Science, 2017 , 19(8) : 1060 -1068 . DOI: 10.3724/SP.J.1047.2017.01060
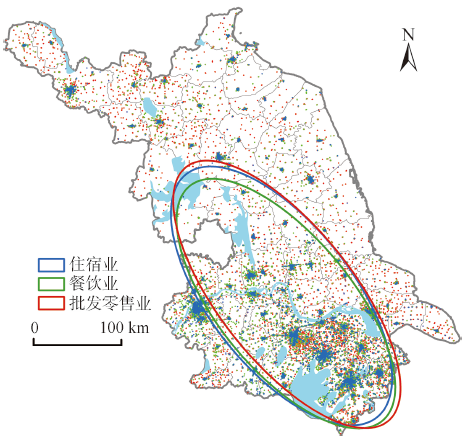
Tab. 1 Results of standard deviation ellipse for the commercial network in Jiangsu Province表1 江苏省商业网点标准差椭圆分析结果 |
| 批发零售业 | 住宿业 | 餐饮业 | |
|---|---|---|---|
| 椭圆面积/km2 | 6 1248.31 | 62 215.18 | 57 131.17 |
| 椭圆x轴方向轴长/km | 217.40 | 207.00 | 203.27 |
| 椭圆y轴方向轴长/km | 89.69 | 95.68 | 89.47 |
| 椭圆x轴的旋转角度/° | 141.41 | 141.76 | 140.43 |
| 扁率 | 127.71 | 111.32 | 113.80 |
Fig. 1 Distribution map of commercial network in Jiangsu Province图1 江苏省商业网点分布图 |
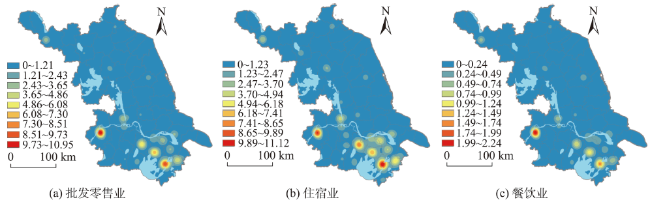
Fig. 2 Nuclear density map of commercial network in Jiangsu Province图2 江苏省商业网点的核密度图 |
Tab. 2 ANN of commercial network in Jiangsu Province表2 江苏省商业网点最近邻分析 |
| 城市 | 业态类型 | ||
|---|---|---|---|
| 批发零售业 | 住宿业 | 餐饮业 | |
| 南京 | 0.1640 | 0.2701 | 0.1699 |
| 无锡 | 0.1601 | 0.2607 | 0.1742 |
| 徐州 | 0.1438 | 0.1992 | 0.1618 |
| 常州 | 0.1501 | 0.2823 | 0.1782 |
| 苏州 | 0.1556 | 0.2546 | 0.1560 |
| 南通 | 0.1416 | 0.2885 | 0.1657 |
| 连云港 | 0.1492 | 0.2543 | 0.1453 |
| 淮安 | 0.1464 | 0.2191 | 0.1486 |
| 盐城 | 0.1134 | 0.2645 | 0.1712 |
| 扬州 | 0.1081 | 0.2629 | 0.1790 |
| 镇江 | 0.1378 | 0.3156 | 0.1728 |
| 泰州 | 0.1507 | 0.2888 | 0.1993 |
| 宿迁 | 0.1304 | 0.2648 | 0.1511 |
Tab. 3 The commercial structure of cities in Jiangsu Province表3 江苏省城市商业业态结构 |
| 城市 | 基于网点数量的业态结构 | 基于销售额的业态结构 |
|---|---|---|
| 南京 | 46.90:8.52:44.58 | 91.35:1.72:6.93 |
| 无锡 | 53.10:7.20:39.69 | 92.46:0.81:6.73 |
| 徐州 | 62.58:6.39:31.03 | 91.86:1.64:6.50 |
| 常州 | 58.74:5.95:35.30 | 91.73:0.74:7.53 |
| 苏州 | 55.07:5.92:39.02 | 90.59:1.11:8.29 |
| 南通 | 64.18:6.11:29.71 | 91.51:0.46:8.03 |
| 连云港 | 55.79:7.69:36.51 | 90.68:1.17:8.15 |
| 淮安 | 59.34:7.99:32.67 | 90.06:1.17:8.78 |
| 盐城 | 58.11:8.05:33.84 | 89.91:1.03:9.05 |
| 扬州 | 57.85:6.06:36.09 | 88.66:1.54:9.80 |
| 镇江 | 55.56:6.50:37.94 | 88.64:0.95:10.40 |
| 泰州 | 56.21:8.34:35.45 | 86.22:1.19:12.60 |
| 宿迁 | 64.44:4.86:30.70 | 87.31:2.42:10.26 |
Tab. 4 The estimates of multiple linear regression model of commercial network in Jiangsu Province表4 江苏省商业网点分布的多元线性回归模型估计结果 |
| 变量 | 批发零售业网点密度 | 住宿业 网点密度 | 餐饮业 网点密度 |
|---|---|---|---|
| GDP | 0.4868 | 0.08460 | 0.59251 |
| POP | 0.4373 | -0.62869 | 0.70054 |
| INC | 1.0155 | 1.37022 | 0.99523 |
| ACC | 0.2292 | 0.70211 | -0.51233 |
| TIR | -0.3764 | 0.09095 | 0.06628 |
| 常数项 | 0.1748 | 0.28289 | 0.26623 |
| 网点数/个 | 83 012 | 9980 | 55 567 |
| F-statistic | 12.99 | 43.45 | 32.05 |
| Adjusted R-squared | 0.8332 | 0.9465 | 0.9282 |
| 同方差性检验 | 0.9832319 | 0.2594104 | 0.4025508 |
The authors have declared that no competing interests exist.
| [1] |
|
| [2] |
[
|
| [3] |
[
|
| [4] |
|
| [5] |
|
| [6] |
|
| [7] |
|
| [8] |
|
| [9] |
|
| [10] |
|
| [11] |
|
| [13] |
|
| [14] |
|
| [15] |
|
| [16] |
|
| [17] |
[
|
| [18] |
[
|
| [19] |
[
|
| [20] |
[
|
| [21] |
[
|
| [22] |
[
|
| [23] |
[
|
| [24] |
[
|
| [25] |
[
|
| [26] |
[
|
| [27] |
[
|
| [28] |
[
|
| [29] |
[
|
| [30] |
[
|
| [31] |
[
|
| [32] |
[
|
| [33] |
[
|
| [34] |
[
|
| [35] |
[
|
| [36] |
[
|
| [37] |
[
|
| [38] |
[
|
| [39] |
[
|
| [40] |
[
|
/
| 〈 |
|
〉 |