
Journal of Geo-information Science >
Analysis and Comparison of SRTM1 DEM and ASTER GDEM V2 Data
Copy editor: 2009. , [ The Geomorphologic Atlas of the People's Republic of China Committee. The geomorphologic atlas of the People's Republic of China1:1$_$000$_$000[M]. Beijing: Science Press , 2009. ]
Received date: 2016-11-18
Request revised date: 2017-01-01
Online published: 2017-08-20
Copyright
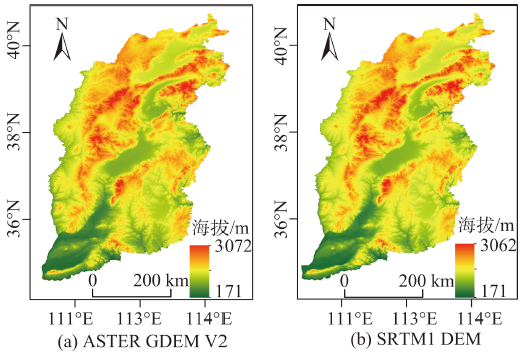
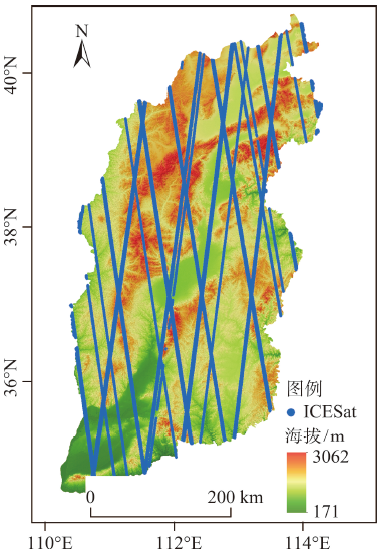
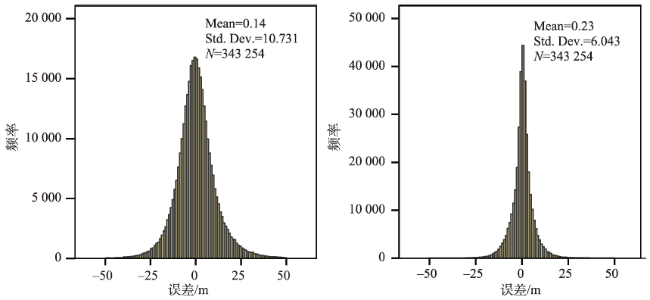
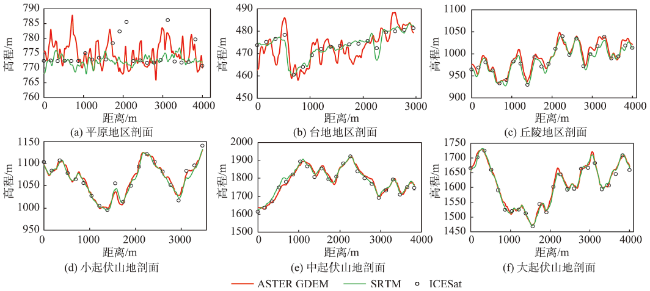
Taking Shanxi Province as the research area, this paper compared the vertical accuracy of SRTM1 DEM and ASTER GDEM V2 data based on ICESat/GLA14 altimetry data. Firstly, error values for these two DEM datasets were acquired by taking ICESat/GLA14 data as the real data, and their error parameters were also calculated, such as mean error (ME), absolute mean error (AME), standard deviation (STD) and root mean square error (RMSE). Then, the error distribution of these two DEM datasets were analysed within the classes of slope, land use type and landform type. Finally, based on topographic profile method, the vertical error differences between these two DEM datasets in topographic types were analysed. The research results showed: (1) The vertical accuracy of SRTM1 DEM data is significantly higher than that of ASTER GDEM V2 data. The RMSE values of SRTM1 DEM and ASTER GDEM V2 are 6.1 m and 10.7 m, respectively. (2) Error analysis based on slope factor showed that the vertical accuracy of these two DEM datasets is affected seriously by the slope, and the error value increases with the increase of the slope value. Error analysis based on land use factor showed that the AME, STD and RMSE values of SRTM1 DEM are the lowest in paddy field, the highest in forestland, and the three error parameters of ASTER GDEM V2 are the lowest in building and the highest in forestland. Error analysis based on landform type factor showed that the AME, STD and RMSE values of SRTM1 DEM and ASTER GDEM V2 data are the lowest in the plain area, and the highest in large fluctuation mountain area. (3) On the selected topographic profiles in plain and terrace areas, the elevation value of ASTER GDEM V2 data have abnormal fluctuations. SRTM1 DEM data is too high for the estimation of valley. Overall, SRTM1 DEM is more accurate than ASTER GDEM V2 for terrain representation, which is basically consistent with ICESat/GLA14.
Key words: vertical accuracy; SRTM1 DEM; ASTER GDEM V2; ICESat/GLA14; Shanxi Province
WU Wenjiao , ZHANG Shifang , ZHAO Shangmin . Analysis and Comparison of SRTM1 DEM and ASTER GDEM V2 Data[J]. Journal of Geo-information Science, 2017 , 19(8) : 1108 -1115 . DOI: 10.3724/SP.J.1047.2017.01108
Fig. 1 SRTM1 DEM and ASTER GDEM V2 data in the study area图1 山西省SRTM1 DEM和ASTER GDEM V2数据 |
Fig. 2 ICESat/GLA14 data in the study area图2 山西省ICESat/GLA14数据分布 |
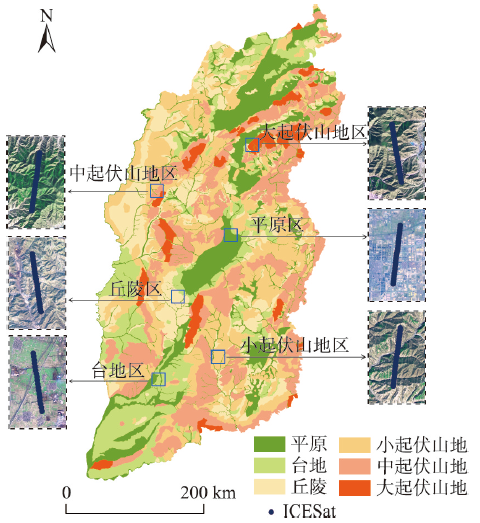
Fig. 3 Landform type and profile location in the study area图3 山西省地貌类型和剖面位置 |
Tab. 1 Comparison of statistical values among the ICESat, SRTM1 DEM and ASTER GDEM V2表1 ICESat、SRTM1 DEM和ASTER GDEM V2的统计数据的比较 |
| 统计参数 | 数量/个 | 最小值/m | 最大值/m | 平均值/m | 标准偏差/m |
|---|---|---|---|---|---|
| ICESat/GLA14 | 343 254 | 247.2 | 2641.2 | 1167.0 | 374.0 |
| SRTM1 DEM | 343 254 | 215.0 | 2645.1 | 1167.2 | 374.0 |
| ASTER GDEM V2 | 343 254 | 214.4 | 2655.6 | 1167.1 | 375.0 |
Tab. 2 Error distribution of SRTM1 DEM and ASTER GDEM V2 based on slope (m)表2 基于坡度的SRTM1 DEM和ASTER GDEM V2的误差分布(m) |
| 统计参数 | ≤3° | 3~8° | 8~15° | 15~5° | ≥25° | 全部 | |
|---|---|---|---|---|---|---|---|
| SRTM1 DEM | 平均误差 | 0.4 | 0.5 | 0.0 | -0.1 | 1.0 | 0.2 |
| 绝对误差均值 | 1.4 | 2.7 | 4.3 | 5.3 | 7.6 | 4.0 | |
| 标准偏差 | 2.1 | 3.9 | 5.8 | 7.2 | 10.3 | 6.0 | |
| 均方根误差 | 2.2 | 3.9 | 5.8 | 7.2 | 10.4 | 6.1 | |
| ASTER GDEM V2 | 平均误差 | -0.2 | -0.6 | -0.4 | 0.4 | 2.6 | 0.1 |
| 绝对误差均值 | 4.5 | 5.9 | 7.7 | 9.1 | 11.7 | 7.8 | |
| 标准偏差 | 6.1 | 8.0 | 10.2 | 11.9 | 14.8 | 10.7 | |
| 均方根误差 | 6.1 | 8.0 | 10.2 | 12.0 | 15.0 | 10.7 |
Tab. 3 Error distribution of SRTM1 DEM and ASTER GDEM V2 based on Land use type (m)表3 基于土地利用类型的山西省SRTM1 DEM和ASTER GDEM V2的误差分布(m) |
| 统计参数 | 旱地 | 水田 | 草地 | 林地 | 水域 | 居民用地 | 未利用地 | |
|---|---|---|---|---|---|---|---|---|
| SRTM1 DEM | 平均误差 | 0.1 | 0.2 | -0.1 | 0.7 | 1.0 | -0.0 | 1.0 |
| 绝对误差均值 | 2.6 | 1.3 | 4.9 | 5.4 | 2.8 | 2.2 | 2.0 | |
| 标准偏差 | 4.2 | 1.7 | 6.8 | 7.6 | 4.5 | 3.5 | 4.8 | |
| 均方根误差 | 4.2 | 1.7 | 6.8 | 7.6 | 4.7 | 3.5 | 4.9 | |
| ASTER GDEM V2 | 平均误差 | -1.1 | 3.2 | 0.9 | 1.2 | 0.8 | -0.5 | -0.6 |
| 绝对误差均值 | 6.6 | 7.1 | 8.5 | 9.4 | 8.7 | 5.1 | 5.8 | |
| 标准偏差 | 9.0 | 10.0 | 11.3 | 12.4 | 12.2 | 6.9 | 8.5 | |
| 均方根误差 | 9.0 | 10.5 | 11.3 | 12.5 | 12.2 | 6.9 | 8.5 |
Tab. 4 Error distribution of SRTM1 DEM and ASTER GDEM V2 based on landform type (m)表4 基于地貌类型的山西省SRTM1 DEM和ASTER GDEM V2的误差分布(m) |
| 统计参数 | 平原 | 台地 | 丘陵 | 小起伏山地 | 中起伏山地 | 大起伏山地 | |
|---|---|---|---|---|---|---|---|
| SRTM1 DEM | 平均误差 | 0.5 | 0.0 | -0.3 | -0.2 | 0.6 | 0.9 |
| 绝对误差均值 | 2.0 | 2.9 | 4.5 | 4.4 | 5.6 | 6.3 | |
| 标准偏差 | 3.4 | 4.8 | 6.3 | 6.1 | 7.7 | 8.9 | |
| 均方根误差 | 3.5 | 4.8 | 6.3 | 6.1 | 7.7 | 8.9 | |
| ASTER GDEM V2 | 平均误差 | -0.5 | -0.9 | -0.6 | -0.2 | 1.6 | 2.7 |
| 绝对误差均值 | 6.2 | 7.1 | 7.5 | 7.8 | 9.6 | 11.1 | |
| 标准偏差 | 8.6 | 9.9 | 10.0 | 10.4 | 12.6 | 14.2 | |
| 均方根误差 | 8.6 | 10.0 | 10.0 | 10.4 | 12.7 | 14.4 |
4.3 SRTM和ASTER GDEM的地形剖面分析 |
Fig. 4 Error frequency distribution of SRTM and ASTER GDEM图4 SRTM和ASTER GDEM的误差频率分布 |
Fig. 5 The topographic profiles of SRTM1 DEM and ASTER GDEM V2图5 山西省SRTM1 DEM和ASTER GDEM V2的地形剖面图 |
The authors have declared that no competing interests exist.
| [1] |
[
|
| [2] |
[
|
| [3] |
[
|
| [4] |
|
| [5] |
|
| [6] |
|
| [7] |
|
| [8] |
|
| [9] |
[
|
| [10] |
|
| [11] |
|
| [12] |
[
|
| [13] |
[
|
| [14] |
[
|
| [15] |
|
| [16] |
|
| [17] |
[
|
| [18] |
[
|
| [19] |
|
| [20] |
|
| [21] |
[
|
| [22] |
中华人民共和国地貌图集编辑委员会.中华人民共和国地貌图集(1:1 000 000)[M].北京:科学出版社,2009.
[ The Geomorphologic Atlas of the People's Republic of China Editor Committee. The geomorphologic atlas of the People's Republic of China (1:1 000 000) [M]. Beijing: Science Press, 2009. ]
|
| [23] |
|
| [24] |
[
|
| [25] |
|
| [26] |
|
| [27] |
[
|
/
| 〈 |
|
〉 |