CONTENTS

Analysis of Classification Methods and Activity Characteristics of Urban Population based on Social Media Data

  • ZHOU Yan , 1, 2 ,
  • LI Yanxi , 1, * ,
  • HUANG Yueying 1 ,
  • GENG Erhui 1
Expand
  • 1. School of Resources and Environment, University of Electronic Science and Technology of China, Chengdu 611731, China
  • 2. Big Data Research Center, University of Electronic Science and Technology of China, Chengdu 611731, China
*Corresponding author: LI Yanxi, E-mail:

Received date: 2017-04-30

  Request revised date: 2017-07-20

  Online published: 2017-10-09

Copyright

《地球信息科学学报》编辑部 所有

Abstract

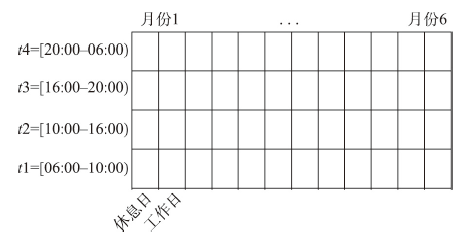
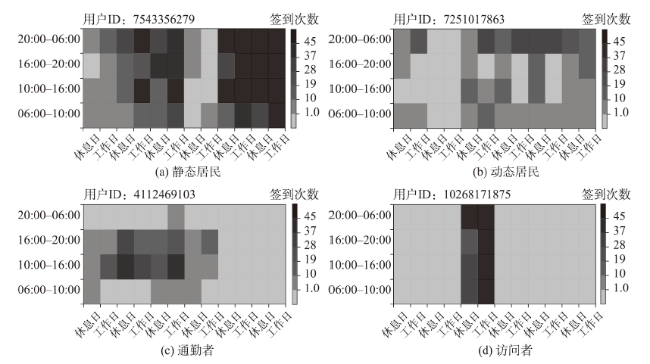
With the rapid development of spatial information technology, the concept of Pan-spatial Information System has been proposed. It extends the scope of spatial information system from the traditional mapping space to the space, interior space, microscopic space and other measurable space. Location data is one of the important research objects of Pan-spatial Information System and it has become a way of studying people's social life and urban dynamics. In this paper, we propose a new crowd classification method based on check-in data which is different from the traditional method based on socioeconomic attributes. Firstly, using the time series of check-in data, we build a matrix model. Then, we analyze the temporal characteristics of residents’ check-in activities. The analytical process starts from spatial-temporal profiles, learns the different behaviors, and returns annotated profiles. In the analytical process, we use the K-means clustering algorithm and K-NN algorithm to learn how to annotate profiles with a city user category (resident, dynamic resident, commuter, or visitor). Finally, according to the classification results of the population, we analyze the temporal and spatial behavior of different city user category and find their differences and potential regularity of spatial behavior. Our method can be applied to a new research perspective for characterizing the composition and characteristics of the urban population and studying urban spatiotemporal structure.

Cite this article

ZHOU Yan , LI Yanxi , HUANG Yueying , GENG Erhui . Analysis of Classification Methods and Activity Characteristics of Urban Population based on Social Media Data[J]. Journal of Geo-information Science, 2017 , 19(9) : 1238 -1244 . DOI: 10.3724/SP.J.1047.2017.01238

1 引言

随着空间信息技术的快速发展,全空间信息系统的概念已经被提出来,即将空间信息系统的范畴从传统测绘空间扩展到宇宙空间、室内空间、微观空间等可量测空间[1-2]。城市作为全空间信息系统的研究范畴,城市居民是其重要的研究对象。通过对城市人群进行分类,有利于研究特定人群的时空行为特征和城市时空结构,为进一步了解城市居民日常活动的时空结构、出行行为、通勤和休闲行为等提供新的视角。相较于传统出行日志难以获取大规模的出行信息,时空大数据在样本量方面具有更强的说服力。因此,随着时空大数据数据源的日趋多样和数据处理方法的不断成熟,时空大数据分析在城市地理学研究领域中备受关注,例如基于手机或出租车GPS定位数据、手机信令数据等研究城市内部的交通特征、交通热点分布状况、交通流量的时空特征、居民出行特征和人口流动等[3-7]
本文通过分析位置签到数据集的时间序列,构造时序矩阵,然后根据用户签到行为的特征规律对城市人群进行分类,基于分类结果,研究不同类型人群的时空行为特征,从而为表征城市人群的组成结构及特征,研究城市时空间结构提供新视角。

2 时序矩阵分析与城市人群分类

2.1 位置签到数据的时序矩阵构造

社交媒体数据中的位置签到数据不仅包含了地理信息,还记录了用户的签到时间,可以将时间序列以适当的时间间隔进行划分,构造出便于定量分析的位置签到数据时序矩阵。鉴于位置签到数据自身的稀疏性特点,本文将1年以每2个月为单位进行时间序列划分;其次,考虑到人群签到行为在不同时间具有不同的时空特性,本文将每个月的时间序列划分为休息日和工作日;对于一天而言,考虑到不同时间段对人群签到行为的影响,又可以将其划分为多个具有代表性的时间段,如早高峰时段、工作时段、晚高峰时段和非工作休闲时段等,因此,本文中将一天划分为4个时间段(t1, t2, t3, t4)。根据时间序列的划分,可以构造出如图1所示的时间序列矩阵。以一年时间为例,其时序矩阵为一个4行12列的矩阵,其中4行代表有4个时间段,12列代表有将12个月按每2个月划分为6个组,而每个组又分为休息日与工作日。每个格网所包含的数字代表该用户在该时间窗口的签到次数,0代表无签到记录。
Fig. 1 The construction method of time series matrix

图1 时序矩阵构造方法

2.2 城市人群分类

基于社交媒体数据中的大规模位置签到数据,可以通过构造位置签到数据的时序矩阵发现城市人群签到行为在时间序列上具有的潜在规律,根据其规律性可以将城市人群分为4类:
(1)静态居民:指居住和工作都在城市A的城市人群。他们的时序矩阵表现为大部分格网所包含的数字非0,即在大部分时间窗口都具有签到 记录。
(2)动态居民:指居住在城市A,但在城市B工作(学习)的城市人群。这类用户在城市A的签到行为主要发生在休息时间段,而在城市B却主要发生在工作(学习)时间段。
(3)通勤者:指在城市A工作,却居住在城市B的城市人群。与动态居民相反,他们在城市A的签到行为往往发生在工作(学习)时间段,而在休息时间段的签到次数较少。
(4)访问者:指某个时间段滞留在城市A,但工作和居住的地方都不在城市A的城市人群。这类用户的时序矩阵表现为在某几个时间列中具有非0数字,而在其它时间列中数字基本为0。

2.3 基于时序矩阵的探索性分析与评价

根据2.2节提出的城市人群分类标准,基于用户签到行为的时间序列位置信息数据对用户 进行分类。本文提出的分类过程主要包括以下2个步骤:
(1)采用K-means(本文K=300)算法,通过比较每组数据的欧氏距离,对时序矩阵的每个时间段进行聚类,而每个时间段的聚类结果将共同构成用户时序矩阵的聚类结果;
(2)根据4类城市人群各自具有的特征,采用人工标记方法,分别对每类人群中具有代表性的时序矩阵进行标记。然后采用K-NN(K=1)算法对数据集进行分析,得到每个时序矩阵的分类结果。
经过上述2个分类过程,将每个用户的时序矩阵划分到4类城市人群中,本文将通过F1值(F1-Measure),即精确值和召回率的调和均值评价其分类结果的质量。F1值的计算公式如式(1)所示。
F 1 = 2 PR P + R (1)
式中: P = TP TP + FP 为精确率,即预测正确的正例数据(TP)占预测为正例数据(TP+FP)的比例; R = TP TP + FN 为召回率,即预测正确的正例数据(TP)占实际为正例数据(TP+FN)的比例。

3 实验与分析

本文采用2014年1月至2015年2月深圳和香港2个地区的新浪微博兴趣点(Point of Interest,POI)及签到数据集,该数据集由第二届城市数据大赛的主办方深圳大学空间信息智能感知与服务深圳市重点实验室提供并进行了初步整理。签到数据集包含POI的ID、用户ID、用户所在地、签到时间共4个数据项,POI数据集包含POI的ID、名称、地址、类别、经度、纬度共6个数据项。

3.1 数据预处理

首先对POI数据集进行坐标转换及纠偏处理,去除不属于深圳或香港地区的POI数据,然后将POI的经纬度数据项匹配到签到数据集中,根据行政区划边界将整个签到数据集重新划分为深圳和香港2个签到数据集。最后对原签到数据的数据项进行拆分,数据包含字段:POI的ID、用户ID、用户所在地、签到时间、星期、时间点、经纬度。

3.2 签到数据集的时序矩阵分析

根据2.1及2.3节提出的方法,分别对深圳和香港2个签到数据集进行分析,得到每个用户的分类类别,随机选取每类城市人群中的某个用户,得到其时序矩阵(图2),而每类人群的时序矩阵特征与2.2节中描述的不同类型人群的签到活动特征相符合。
Fig. 2 Examples of time series matrix of each type of urban population categories

图2 每类城市人口类别的时序矩阵示例

为了验证2.1节所提出的时序矩阵构造方法的鲁棒性和稳定性与月份组合数量之间的关系,本文首先将2个签到数据集以每1个月、每2个月、每3个月和每4个月为单位进行划分(组合数大于4时,对于研究城市人口活动时空间结构的意义较小),采用2.3节提出的分类及评价方法对数据集进行分析比较,其结果如图3所示。图3表明,不管是对于单独的城市人群类别,还是对于整个城市人群,当月份组合数为2的时候,其F1值最高,即以每2个月为单位构造的时序矩阵最为合理。
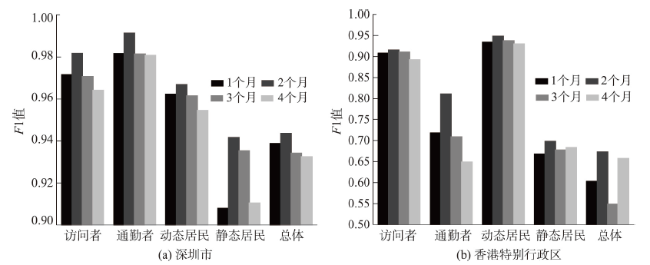
Fig. 3 Individual check-in profiles’ categories and classification quality: the result of the semi-automatic labeling over the reduced time windows of one, two, three and four months, respectively

图3 月份组合数为1、2、3、4的城市人口类别及总体的分类结果质量比较

3.3 城市人群的时空间行为特征分析

根据3.2节得到的城市人群分类结果,本文以深圳市为例,进一步研究分析其不同类型人群的时空间行为特征,从而发现不同类型人群时空间行为的差异性与潜在的规律性。
(1)不同类型人群活动时间规律
依据2.1节划分的时间段,分析不同类型人群活动在工作日、休息日中随时间的变化规律以及相互间的活动差异。从签到数据的时间分布规律来看,相较于其它类型人群,无论是工作日还是休息日,静态居民的签到活动都存在随时间明显变化的规律,并且签到频率随月份变化起伏较小(图4(a))。与之相反,访问者的签到活动与时间的对应关系较弱,签到频率起伏较大,并且主要集中在5、8、9、11和12月份中(图(4(d)))。对于通勤者来说,由于他们具有在A城市工作但不居住在A城市的特点,所以这类人群的签到活动主要集中在10:00-16:00,而在20:00-06:00的签到记录较少(图4(c))。总体来看,不同类型人群活动的时间分布规律在一定程度上反映了他们各自的签到行为特征,说明本文所提出的这种城市人群分类方法具有一定的可靠性。
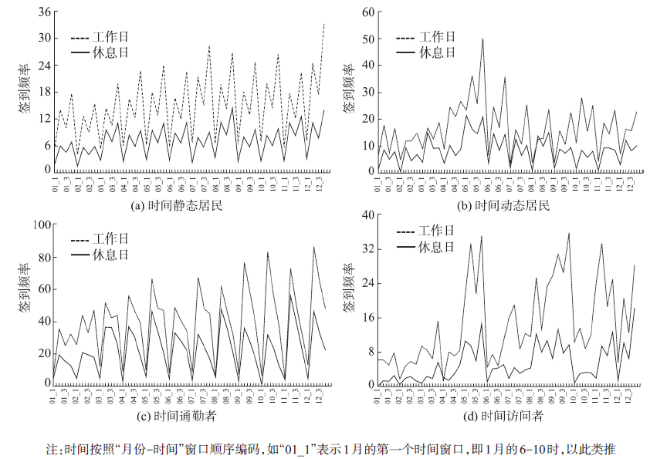
Fig. 4 The check-in law of change of different types of people in different time period

图4 不同类型人群在不同时间段签到变化规律

(2)不同类型人群活动空间分布特征
签到记录中除了包含签到时间、坐标外,还包含了文本信息,通过研究分析用户签到的文本数据与轨迹数据,可以发现用户签到的兴趣点以及兴趣点之间的潜在关系。为了提高文本分析精度,本文首先对签到记录中的文本数据进行数据清洗,去除一部分噪音数据,然后采用文本挖掘中经典的TF-IDF算法,分别找出每类人群经常访问的20个地点,并提取包含这20个地点的用户签到轨迹网络,最后采用社区发现算法中的模块度算法对轨迹网络进行分析,得到兴趣点的聚类结果(图5)。
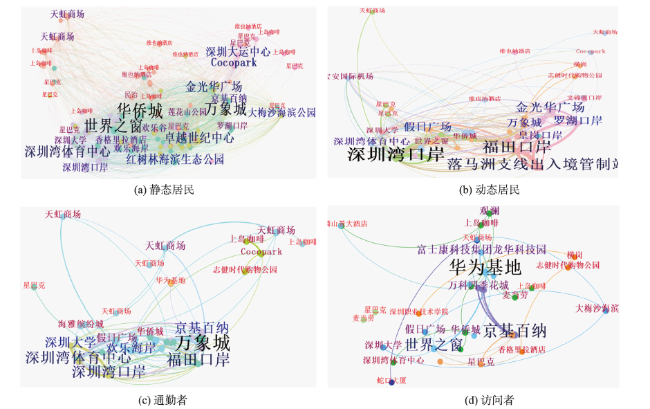
Fig. 5 Community discovery of check-in trajectory networks of different types of people

图5 不同类型人群签到轨迹网络的社区发现结果

根据图5(a)所示,由于静态居民是深圳市的常住居民,因此他们的活动轨迹网络呈现出复杂性和跨区域性的特点,其签到兴趣点主要分布在华侨城、万象城、世界之窗、深圳湾体育中心、卓越世纪中心,并且根据社区发现的分析结果可以得到由深圳湾体育中心、深圳大学、世界之窗、华侨城、金光华广场、京基百纳、万象城、卓越世纪中心、红树林海滨生态公园、欢乐海岸、欢乐谷以及深圳湾口岸所组成的频繁签到轨迹网络。
通过对比分析图5(b)和图5(c),可以发现动态居民与通勤者的签到兴趣点大多都集中在深圳湾口岸、福田口岸、罗湖口岸等一些出入境交通枢纽处,这主要是因为动态居民和通勤者在一定程度上具有相似的签到活动特征,即每天往返于2个城市。除了出入境交通枢纽外,万象城、假日广场、深圳湾体育中心和华侨城也成为了动态居民和通勤者的共同签到兴趣点。访问者由于具有较为明确的旅游出行目的,因此相较于静态居民呈现出的比较复杂的签到轨迹网络。
图5(d)所反映出的访问者的签到轨迹网络较为简单。同时,除了世界之窗、京基百纳、假日广场和大梅沙海滨公园等热门的商业中心、旅游景区外,华为基地、富士康科技集团和深圳大学也成为了访问者的签到兴趣点,这说明除了旅游度假外,学术、商务活动或公派出差也是访问者出访深圳的主要原因。对比分析4类人群的签到兴趣点可以发现,除了一些面积范围较大的商业中心、旅游景区以及边境口岸等兴趣点以外,一些分布较广的餐饮店、酒店和商场等由于位于城市的热力区,也成为不同类型城市人群的共同签到兴趣点,如星巴克咖啡、上岛咖啡、维也纳大酒店和天虹商场等。
图5还可以发现,经过网络社区发现分析后,城市人群签到兴趣点的聚类结果在地理空间分布上呈现出一定的地理相关性与空间异质性,例如在每类人群的兴趣点聚类结果中深圳湾体育中心、世界之窗、欢乐谷、京基百纳和华侨城这5个距离较近的地点都被划分在同一个类别中,这也说明了人们更愿意在离自己当前位置距离较近的范围内活动。而有一些地点虽然空间分布较远,但由于它们具有较为相似的社会功能属性,因此也被划为同一个类别,例如大梅沙海滨公园与世界之窗,虽然它们相距较远,但也被划分在了同一个类别中,与此类似的还有深圳湾口岸与福田口岸。

4 结论

基于社交媒体数据中的位置服务大数据,为城市时空结构的研究提供了一种新的数据源,而新的数据和方法与时间地理学相结合是城市时空间结构研究最主要的发展趋势。为了探索不同类型人群之间的时空间行为特征,本文研究分析了城市人群活动时间规律和空间分布特征,发现在时间维度上,不同类型人群由于具有不同的签到活动特征,其签到数据的时间分布具有一定的规律性和差异性,而从空间维度上来看,签到兴趣点的分布特征也具有相似性和差异性,并且这些兴趣点的聚类结果在地理空间分布上呈现出一定的地理相关性和空间异质性。本文提出了一种以位置签到数据的时间序列为数据源,通过分析用户签到行为的特征规律以构建时序矩阵,结合数据挖掘方法将城市人群分为静态居民、动态居民、通勤者和访问者进行分类识别的方法,这种识别方法不同于传统的以社会经济属性为依据的人群划分方法,能较为客观地表征城市人群的组成结构及特征,对合理规划与管理城市空间具有积极作用,也可以为研究分析不同类型人群的活动特征提供新的研究视角参考。值得说明的是,出于保护用户隐私考虑,现有对外发布的签到数据绝大部分不包含用户年龄、性别及职业等信息,而这些信息的缺失对于城市人群的分类结果会产生一定的影响,如由于职业的差异性,部分居民可能白天休息、晚上上班,因此在进行人群分类的时候,原本属于通勤者的居民有可能会被误分为动态居民,从而影响分类结果的精度。未来将考虑结合其他多源数据,改进基于社交媒体数据的城市人群进行分类方法,提高城市人群分类精度。

The authors have declared that no competing interests exist.

[1]
周成虎. 全空间地理信息系统展望[J].地理科学进展,2015,34(2):129-131.地理信息系统作为一门空间科学,以其独特的空间观点和空间思维,从空间相互联系和相互作用出发,揭示各种事物与现象的空间分布特征和动态变化规律。本文从地理信息系统所研究的空间对象出发,对地理信息系统发展新方向提出思考:①从地球空间拓展到宇宙空间,需要构建宇心坐标系和宇宙GIS、月球GIS等;②从室外空间延伸到室内空间,需要发展室内GIS,并拓展到水下空间和地下空间;③从宏观到微观空间,可以发展面向游戏的体育GIS、面向生命健康管理的人体GIS等;④面向大数据时代,发展大数据空间解析的理论和方法,贡献于大数据科学的发展。

DOI

[Zhou C H.Prospects on pan-spatial information system[J]. Progress in Geography, 2015,34(2):129-131. ]

[2]
华一新. 全空间信息系统的核心问题和关键技术[J].测绘科学技术学报,2016,33(4):331-335.分析了空间信息系统的研究现状和存在问题,阐明了全空间信息系统的基本概念和基本特征;提出了基于多粒度时空对象构建全空间信息系统的技术路线,明确了需要研究解决的科学问题和关键技术;提出了全空间信息系统与智能设施管理的主要研究内容,指出预期的研究效益。

DOI

[Hua Y X.The core problems and key technologies of pan-spatial information system[J]. Journal of Geomatics Science and Technology, 2016,33(4):331-335. ]

[3]
Scholz R W, Lu Y.Detection of dynamic activity patterns at a collective level from large-volume trajectory data[J]. International Journal of Geographical Information Science, 2014,28(5):946-963.Recent developments in pervasive location acquisition technologies provide the technical support for massive collection of trajectory data. Activity locations identified from trajectory data can be used to evaluate space-time activity patterns. However, the studies that explore activity patterns at collective levels often fail to address the temporal aspect. The traditional spatial statistics, which are commonly used for spatial pattern analysis, are limited in describing space-time interactions. This paper proposes a method to detect the dynamics of space-time development of urban activity patterns that are embedded in large volume trajectory data. Taxi cabs' trajectory data in the city of San Francisco were analyzed to identify activity instances, activity hot spots, and space-time dynamics of activity hot spots. The urban activity hot spots, evolving through different stages and across the city, provide a comprehensive depiction of the space-time activity patterns in the urban landscape. The dynamic patterns of the activity hot spots can be used to retrieve historical events and to predict future activity hot spots, which may be valuable for transportation and public safety management.

DOI

[4]
Ferreira N, Poco J, Vo H T, et al.Visual exploration of big spatio-temporal urban data: A study of new york city taxi trips[J]. IEEE Transactions on Visualization and Computer Graphics, 2013,19(12):2149-2158.As increasing volumes of urban data are captured and become available, new opportunities arise for data-driven analysis that can lead to improvements in the lives of citizens through evidence-based decision making and policies. In this paper, we focus on a particularly important urban data set: taxi trips. Taxis are valuable sensors and information associated with taxi trips can provide unprecedented insight into many different aspects of city life, from economic activity and human behavior to mobility patterns. But analyzing these data presents many challenges. The data are complex, containing geographical and temporal components in addition to multiple variables associated with each trip. Consequently, it is hard to specify exploratory queries and to perform comparative analyses (e.g., compare different regions over time). This problem is compounded due to the size of the data-there are on average 500,000 taxi trips each day in NYC. We propose a new model that allows users to visually query taxi trips. Besides standard analytics queries, the model supports origin-destination queries that enable the study of mobility across the city. We show that this model is able to express a wide range of spatio-temporal queries, and it is also flexible in that not only can queries be composed but also different aggregations and visual representations can be applied, allowing users to explore and compare results. We have built a scalable system that implements this model which supports interactive response times; makes use of an adaptive level-of-detail rendering strategy to generate clutter-free visualization for large results; and shows hidden details to the users in a summary through the use of overlay heat maps. We present a series of case studies motivated by traffic engineers and economists that show how our model and system enable domain experts to perform tasks that were previously unattainable for them.

DOI PMID

[5]
Calabrese F, Colonna M, Lovisolo P, et al.Real-time urban monitoring using cell phones: A case study in Rome[J]. IEEE Transactions on Intelligent Transportation Systems, 2011,12(1):141-151.This paper describes a new real-time urban monitoring system. The system uses the Localizing and Handling Network Event Systems (LocHNESs) platform developed by Telecom Italia for the real-time evaluation of urban dynamics based on the anonymous monitoring of mobile cellular networks. In addition, data are supplemented based on the instantaneous positioning of buses and taxis to provide information about urban mobility in real time, ranging from traffic conditions to the movements of pedestrians throughout the city. This system was exhibited at the Tenth International Architecture Exhibition of the Venice Biennale. It marks the unprecedented monitoring of a large urban area, which covered most of the city of Rome, in real time using a variety of sensing systems and will hopefully open the way to a new paradigm of understanding and optimizing urban dynamics.

DOI

[6]
eagle N, pentland A, lazer D. Inferring friendship network structure by using mobile phone data[J]. Proceedings of the National Academy of Sciences, 2009,106(36):15274-15278.Data collected from mobile phones have the potential to provide insight into the relational dynamics of individuals. This paper compares observational data from mobile phones with standard self-report survey data. We find that the information from these two data sources is overlapping but distinct. For example, self-reports of physical proximity deviate from mobile phone records depending on the recency and salience of the interactions. We also demonstrate that it is possible to accurately infer 95% of friendships based on the observational data alone, where friend dyads demonstrate distinctive temporal and spatial patterns in their physical proximity and calling patterns. These behavioral patterns, in turn, allow the prediction of individual-level outcomes such as job satisfaction.

DOI PMID

[7]
Gonzalez M C, Hidalgo C A, Barabasi A-L.Understanding individual human mobility patterns[J]. Nature, 2008,453(7196):779-782.Abstract Despite their importance for urban planning, traffic forecasting and the spread of biological and mobile viruses, our understanding of the basic laws governing human motion remains limited owing to the lack of tools to monitor the time-resolved location of individuals. Here we study the trajectory of 100,000 anonymized mobile phone users whose position is tracked for a six-month period. We find that, in contrast with the random trajectories predicted by the prevailing L vy flight and random walk models, human trajectories show a high degree of temporal and spatial regularity, each individual being characterized by a time-independent characteristic travel distance and a significant probability to return to a few highly frequented locations. After correcting for differences in travel distances and the inherent anisotropy of each trajectory, the individual travel patterns collapse into a single spatial probability distribution, indicating that, despite the diversity of their travel history, humans follow simple reproducible patterns. This inherent similarity in travel patterns could impact all phenomena driven by human mobility, from epidemic prevention to emergency response, urban planning and agent-based modelling.

DOI PMID

[8]
古杰,齐兰兰,周素红,等.国内外城市时空间结构研究的渊源及述评[J].世界地理研究,2016,25(3):69-79.

[Gu J, Qi L L, Zhou S H, et al.Origins and review of urban time-space structure studies[J]. World Regional Studies, 2016,25(3):69-79. ]

[9]
王波,甄峰,张浩,等.基于签到数据的城市活动时空间动态变化及区划研究[J].地理科学,2015,35(2):151-160.lt;p>借助新浪微博,引入位置服务大数据,以南京市为例,从时间、空间、活动3个方面分析城市活动空间的动态变化,并在掌握变化规律的基础上进一步划分城市活动区域.研究发现:传统的作息规律仍然支配着人们的签到活动,时间与活动内容间的对应关系仍然存在;居民活动在工作日、休息日与节假日,以及主城与外围地区存在差异;城市活动空间在一天内经历了相对分散-集聚-进一步集聚-分散-相对集聚的动态变化;城市活动区域可以划分为就业活动区、居住活动区、休闲活动区、夜生活活动区,及综合活动区;活动功能区呈现出混合化与边界模糊化的特征.</p>

[ Wang B, Zhen F, Zhang H, et al.The dynamic changes of urban space-time activity and activity zoning based on check-in data in sina web[J]. Scientia Geographica Sinica, 2015,35(2):151-160. ]

[10]
Gabrielli L, Furletti B, Trasarti R, et al.City users' classification with mobile phone data[C]. Proceedings of the Big Data (Big Data), 2015 IEEE International Conference, 2015.

[11]
Furletti B, Gabrielli L, Garofalo G, et al.Use of mobile phone data to estimate mobility flows. Measuring urban population and inter-city mobility using big data in an integrated approach[C]. Proceedings of the 47th Meeting of the Italian Statistical Society, F, 2014.

[12]
兰宗敏,冯健.城中村流动人口日常活动时空间结构—基于北京若干典型城中村的调查[J].地理科学,2012,32(4):409-417.在对北京5个城中村进行24 h活动日志实证调查的基础上,发现城中村流动人口在工作日和休息日的时间利用分别可以划分为6类,每一类的时间利用特征都与社会环境及该类人群的属性特征密切相关,其中工作、娱乐、家务等活动起主导作用。就城中村流动人口而言,不同类别人群工作日和休息日活动的时空间结构与其时间利用特征紧密联系,同样也受到社会环境的制约。生活活动路径展示出居民的日常活动正越来越表现出个性化、多样化和差异性的特征,是多种因素共同作用的结果。宏观环境、生活空间以及自身特征3个层次的影响因素综合作用于居民的个体行为,导致城中村流动人口活动时空间结构展现出独特的特征。基于微观个体的日常活动研究可以为掌握城市人群生活空间结构、制定城市规划等提供重要参考。

DOI

[Lan Z M, Feng J.The spatio-temporal structure of migrant’s daily activities of village in city: case of typical villages in city of Beijing, China[J]. Scientia Geographica Sinica, 2012,32(4):409-417. ]

[13]
Liu Y, Sui Z, Kang C, et al.Uncovering patterns of inter-urban trip and spatial interaction from social media check-in data[J]. PLoS One, 2014,9(1):e86026.The article revisits spatial interaction and distance decay from the perspective of human mobility patterns and spatially-embedded networks based on an empirical data set. We extract nationwide inter-urban movements in China from a check-in data set that covers half a million individuals within 370 cities to analyze the underlying patterns of trips and spatial interactions. By fitting the gravity model, we find that the observed spatial interactions are governed by a power law distance decay effect. The obtained gravity model also closely reproduces the exponential trip displacement distribution. The movement of an individual, however, may not obey the same distance decay effect, leading to an ecological fallacy. We also construct a spatial network where the edge weights denote the interaction strengths. The communities detected from the network are spatially cohesive and roughly consistent with province boundaries. We attribute this pattern to different distance decay parameters between intra-province and inter-province trips.

DOI PMID

[14]
Furletti B, Gabrielli L, Renso C, et al.Analysis of GSM calls data for understanding user mobility behavior[C]. Proceedings of the Big Data, 2013 IEEE International Conference on, F 6-9 Oct, 2013.

[15]
Fortunato S.Community detection in graphs[J]. Physics reports, 2010,486(3):75-174.

[16]
Monreale A, Rinzivillo S, Pratesi F, et al.Privacy-by-design in big data analytics and social mining[J]. EPJ Data Science, 2014,3(1):1.Privacy is ever-growing concern in our society and is becoming a fundamental aspect to take into account when one wants to use, publish and analyze data involving human personal sensitive information. Unfortunately, it is increasingly hard to transform the data in a way that it protects sensitive information: we live in the era of big data characterized by unprecedented opportunities to sense, store and analyze social data describing human activities in great detail and resolution. As a result, privacy preservation simply cannot be accomplished by de-identification alone. In this paper, we propose the privacy-by-design paradigm to develop technological frameworks for countering the threats of undesirable, unlawful effects of privacy violation, without obstructing the knowledge discovery opportunities of social mining and big data analytical technologies. Our main idea is to inscribe privacy protection into the knowledge discovery technology by design, so that the analysis incorporates the relevant privacy requirements from the start.

DOI

[17]
Cho E, Myers S A, Leskovec J. Friendship and mobility: user movement in location-based social networks[C]. Proceedings of of the 17th ACM SIGKDD international conference on Knowledge discovery and data mining,F, 2011,ACM.

[18]
Blei D M, A Y, jordan M I.Latent dirichlet allocation[J]. Journal of machine learning research, 2003,3(1):993-1022.

Outlines

/