CONTENTS

Generation of Variable-Scale Route Maps with Consideration of Distortion Reduction for Small Display Sizes

  • WANG Liying ,
  • TI Peng , * ,
  • YU Chonghu ,
  • ZHAO Dongxu ,
  • HOU Xiaotong
Expand
  • Faculty of Geosciences and Environmental Engineering, State-province Joint Engineering Laboratory of Spatial Information Technology for High-speed Railway Safety, Southwest Jiaotong University, Chengdu 611756, China
*Corresponding author: TI Peng, E-mail:

Received date: 2017-05-12

  Request revised date: 2017-07-15

  Online published: 2017-10-09

Copyright

《地球信息科学学报》编辑部 所有

Abstract

Currently route maps are often displayed on mobile devices for the route selection. However, for such devices, a major problem is their small display sizes. In this study, a new method on adaptive generation of variable scale maps for small display sizes was proposed and aimed to improve the clarity of the whole map. This method consists of two steps, i.e. estimating the density of global distribution on maps and conducting variable scale transformation based on the estimated density values. Compared with current variable scale methods, this method considered the space for representation of the landmarks and text symbols, and the reduction of overall distortions arising from map deformation. The experimental results indicated that the new method is able to adaptively generate the variable scale maps for different small display sizes and provide a map overview with an improved clarity as well as well-preserved map recognition compared with original shapes.

Cite this article

WANG Liying , TI Peng , YU Chonghu , ZHAO Dongxu , HOU Xiaotong . Generation of Variable-Scale Route Maps with Consideration of Distortion Reduction for Small Display Sizes[J]. Journal of Geo-information Science, 2017 , 19(9) : 1245 -1252 . DOI: 10.3724/SP.J.1047.2017.01245
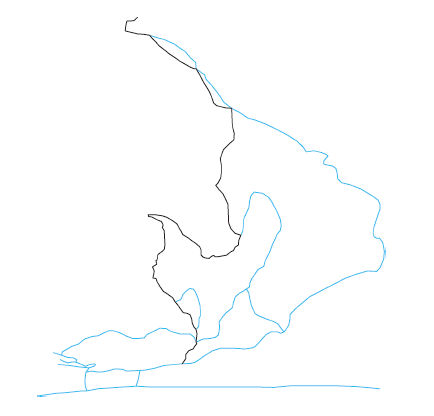
1 引言

周成虎在2015年提出了全空间信息系统的概念,指出建立多元、多尺度、多语义、多模态等特征的大数据表达模型,形成数据的空间协同表达[1]。而作为空间信息主要的表达工具之一的地图目前已被广泛应用于各类移动设备以方便人们日常活动,例如规划户外运动和景区旅游路线[2]。然而移动设备的主要问题是显示屏幕较小,当展现较大范围且较丰富的地图信息时地图清晰度将会被降低。现有提出的改善地图清晰度方法主要可以分为两类。 保持地图比例尺不变,主要的技术手段包括:多比例尺表达,即对同一区域使用不同比例尺地图进行切换或者采用不同窗口显示不同比例尺地图[3];制图综合算法[4-5];订制表达[6](personalization),即仅显示与任务相关的地图内容。 主要通过采用变比例尺转换提高显示的清晰度,即相对增大兴趣区域。相对于第一类方法,变比例尺转换由于对地图不同区域采用了连续式的比例尺变化,克服了多尺度表达中不同比例尺地图关联时 产生的匹配对应困难,并尽可能多的清楚显示关注的细节信息,从而更好地利用了小屏幕有限的显示空间[7]
华一新指出研究多粒度时空对象的符号化机制与自适应表达方法是全空间信息系统的核心问题[8]。面向规划旅游路线时,小屏幕地图中较大范围内的群集地标符号和注记符号的表达需研究关系和群集实体符号化机制,实现群集地标符号的注记符号认知无损的变尺度表达,本文研究的变尺度表达主要是采用连续的变比例尺表达。变比例尺地图是通过增加用户在地图上关注对象的清晰度,从而提高对所需地图信息的识别能力和效率,而忽略精确的空间位置和路线长度。事实上对于很多地图应用,例如路线规划、地图导航等,精确的几何信息对于地图用户并不是非常重要[9]。基于不同的关注对象,现有的变比例尺转换方法可以分为局部关注和全局关注两类。在局部关注中[10-14],对于指定的关注区域将被放大以改善该区域的清晰度,对于其他非指定区域的地图清晰度或者被忽略或者通过减少地图显示内容的方法进行改善。还有一些方法以选择的路线为关注对象[15-16],通过放大已选择的路线及相关地图信息(例如道路名、地标等)达到在较小的屏幕上清晰显示整个路线的目的,这类方法常用于路线导航。在第二类方法中,考虑到空间密度分布通常是高度不均匀的[17],当较大地图区域显示在较小屏幕上时,可以通过尽可能缩小地图中空白或者稀疏区域的方式,使地图要素密度分布更加均匀化,以改善地图整体清晰度。该类型的变比例尺地图可服务于用户决策的制定,例如在移动设备上显示旅游景区较详细和清晰的概览地图,从而有助于游客更好和更快的规划游览路线,本文主要关注于第二类方法。然而现有该类针对网状地图的方法[18-19]存在的问题是,未考虑地图中地标与注记符号的显示空间,并且缺乏对地图变形的控制。事实上过度的变形容易导致地图识别能力的降低[20],针对这2个方面的问题,本文提出顾及地标与注记符号显示空间和降低地图变形的变比例尺转换方法。此外,由于当前使用的移动设备显示屏幕尺寸式样繁多,本文研究中也考虑了根据给定显示尺寸生成变比例尺地图。

2 变比例尺路线图生成方法

对于全局关注的变比例尺转换是当地图显示在较小屏幕上时,采用使密度分布尽可能均匀的方式从而提高地图整体清晰度,因此首先需要估计地图的密度分布。需要注意的是当地图缩小时使用全局关注的变比例尺转换主要依靠压缩稀疏和空白区域以改善清晰度,然而密集区域中的空白部分若被过度压缩将导致清晰度降低,因此本文中的密度分布估计中,对于某一个区域的密度估计也应考虑其周围区域的密度情况。此外密度估计也应考虑注记符号,方便基于密度值的变比例尺转换方法的设计。基于地图不同区域的密度值进行变尺度转换是一个不适定问题,并没有唯一解,因此本文将变尺度转换问题通过数学优化法建立数学模型解决,通过给定的约束条件和目标方程得出最优解。此外在变比例尺转换中还应尽可能控制地图变形以提高地图识别能力。基于以上思想,本方法主要包含2个步骤: 密度分布估计; 基于密度分布的变比例尺变换。

2.1 顾及注记符号的密度分布估计

估计网状地图密度分布的常见方法有2种: 基于网状地图中的节点和内点进行密度估计,例如中心度[18],然而该方法无法正确估计包含密集线而较少点区域的密度[21] 将地图通过均匀格网进行划分,基于每个格网单元估计密度[19,22-23]。此方法克服了2种方法的缺陷,同时均匀格网也便于使用[24],因此本研究采用均匀网格估计地图密度,其表达式如下:
D = N A (1)
式中: A 表示一个格网单元的面积; N 表示在格网单元 A 中统计单元的数量; D 表示格网单元 A 的密度值。
对于网状地图,密度估计通常使用线密度进行, N 表示在格网单元 A 中总线长。然而由于本研究需要顾及地标与注记符号的显示空间,因此在密度估计中不应将地标与注记符号在地图中所占空间视为空白区域,对于这个问题可以通过2种方法来解决: 仍然是基于格网进行线密度估计,如果格网单元内包含地标与注记符号,可以人工增加该格网单元的密度值。 与点密度估计思想一致,需要基于栅格形式的电子地图进行密度估计,统计单元为非空白像元,即式(1)中 N 表示在格网单元 A 中非空白像元的数量。相对于第 种方法,该方法需要统计非空白像元的个数,需要时间较长,但是自动化程度高,不需要人工干预,因此被本文采纳。
需要注意的是,基于格网进行密度估计所得到的只是区域密度值,并且估计结果依赖于格网划分大小。而对于本研究中所提到的密度分布应反映整幅图宏观的密度变化,判断某一个格网单元是否为密集区域不仅应参考其本身的密度值,还应顾及其周围区域的密度情况,这样才能避免2个密集区域间的空白区域被过度压缩而导致清晰度降低。因此需要在估计某一单元的密度同时,综合考虑其本身及周围单元的密度,常见可用方法有核密度估计[25]和平滑滤波。由于核密度估计是以点为核心进行的,而平滑滤波通常适用于栅格影像,本文使用均匀格网进行密度统计,因此选择平滑滤波方法。

2.2 基于密度分布的变比例尺变换

将根据2.1节所得到的密度估计结果,基于数学优化思想建立数学模型进行格网变形,此外需要在格网变形中增加对变形的控制,尽可能减少变形对地图识别的影响,之后基于变形格网通过内插方法得到变比例尺路线结果图。
在格网变形中,格网单元的质心将被作为控制点,同时格网单元的密度值将被赋予所对应的格网质心。每个控制点 X i , Y i R i C 有3个变量,即变换后坐标 x i , y i R 和未知的比例尺因子 S i R + ,其中 C 是控制点编号的集合, R 是实数, R + 是正实数。
由于结果图与显示尺寸大小 ( u min , v min ) ( u max , v max ) 要求保持一致,因此每个控制点对应的约束条件如下:
u min x i u max v min y i v max (2)
第二个约束条件目的是赋予密集区域较大的比例尺因子从而实现该区域面积的增大。此外考虑到不同方向上的变形可能不同,比例尺因子将分别在xy方向上定义:
S ix u x D i S iy u y D i (3)
式中: D i 是对应于控制点 i 的密度值; u x u y 是常数用于控制变形效果。随着 u x u y 的增大,密集区域面积增大的幅度将增加, S ix 是在x方向的比例尺因子, S iy 是在y方向的比例尺因子。
由于不同的控制点所对应的密度值是有差异的,对于两个相连的控制点不可能完全按照各自的密度值进行坐标变换,除非密度值相同。因此在这种情况下,允许存在小的偏差 d x ij d y ij
d x ij = S ix ( X i - X j ) - ( x i - x j ) d y ij = S iy ( Y i - Y j ) - ( y i - y j ) (4)
偏差的平方和 e 1 :
式中: Adj ( i ) 是与控制点 i 的相连的控制点。
为了降低格网过度变形对地图识别的影响,应尽可能控制相同行和列的相邻控制点在xy方向上变化:
式中: k 1 是与控制点i有相同 X 初始值的连接点; k 2 是与控制点i有相同 Y 初始值的连接点。
最终的目标方程为:
Minimize e 1 + w e 2 (7)
上述约束条件与目标方程在形式上符合数学优化法中常见的凸二次规划,因此可以获得有效 解[26]。目标方程中 w 为权值,可以进行形变控制,即 w 值越大表示最终结果中地图变形越小,但同时也减少了感兴趣区域放大程度。
基于密度分布的格网变形后,下一步是基于该变形格网进行地图重构从而实现地图的变比例尺转换,散点内插技术(scattered data interpolation)经常被使用达到该目的[19,27]。Franke[28]比较了29种典型的内插方法,其中Hardy[29]提出的多元二次曲面内插(Multiquadric Interpolation)在平滑性、算法复杂度、结果的美观性和易用性方面均优于其他方法,因此本文使用该方法实现网状地图重构。具体实现步骤为: 首先根据格网控制点在原始位置和变形转换后位置之间的差值计算出多元二次曲面内插的参数值; 根据得到的参数值计算网状地图中节点和内点的位移量从而得到它们新的位置坐标。

3 实验分析

本文采用峨眉旅游路线图(图1)为实验数据以验证本文中提出的变比例尺转换方法的有效性。其相其相应的格网变形结果如图2(a)、(b)所示,分别生成的两种不同尺寸的变比例尺地图如图3(a)和图3(b)所示。目标方程中 ω 值为1,表示感兴趣区域放大程度和变形控制程度同等重要。实验计算机的中央处理器为3.2 GHz和内存为24 G,对于图1道路网络数据(358个点和30条弧段)生成时间4.3 s,其中密度估计需要3 s,基于估计的密度值进行变比例尺转换需要1.3 s,说明本文所提方法有较高的运算效率。对方法的评估主要考察变比例尺结果图的认知度和清晰度。变比例尺结果的认知度评估是从整体图形对比识别和单根路径识别效率2个方面进行,并不考虑可以辅助认知的地标和注记符号。而由于本文方法在改善概览清晰度中考虑了为注记符号提供显示空间,因此在清晰度评估中使用了增加注记符号后的路线图。
Fig. 1 E'Mei Mountain tourist map

图1 峨眉山旅游路线图

对于整体图形认知评估采取了问卷方式,邀请20名不同教育背景的志愿者(9名男性和11名女性)通过视觉对比变比例尺结果图与原形地图(图1),根据识别的难易程度划分5个等级,对应分数分别为1、2、3、4、5分,其中,1分为非常难识别,2分为难识别,3分为可以识别,4分为易识别,5分为极易识别。在问卷中地图以高清打印版本提供给志愿者。对于整体图形认知度问卷结果的平均分数分别为4.7和4.5(图3(a)、(b))。对于单条路径识别效率评估,首先在原形地图上选择较长的路径(见图1中粗线),然后志愿者在两幅变比例尺结果图(图3(a)、(b))以及相同尺寸的两幅等比例尺缩小结果图(图3(c)、(d))上画出相应路径,最终结果分别为10.3 s和12.4 s(图3(a)、(b)),9.9 s和12.8 s (图3(c)、(d)),实验结果表明本文所提出的方法生成的变比例尺结果图基本不影响地图识别。
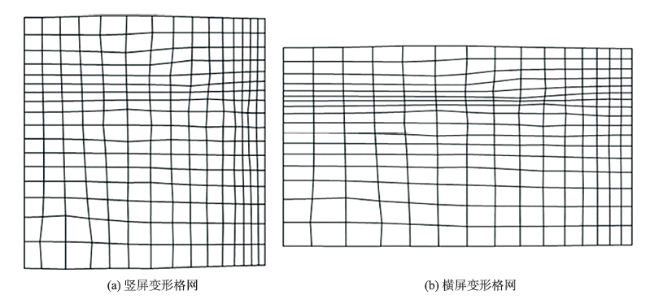
Fig. 2 Distorted grid of variable scale results of E'Mei Mountain tourist map

图2 峨眉山旅游路线图变比例尺缩小格网图

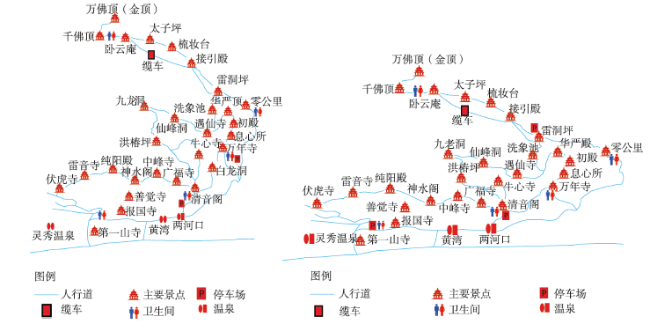
Fig. 3 Variable scale and uniformly scaling results of E'Mei Mountain tourist map

图3 峨眉山旅游路线图变比例尺缩小与等比例尺转换结果

在概览清晰度改善的评估中,注记符号被分 别加入变比例尺缩小和等比例尺转换结果图 中(图4(a)、(b),图5(a)、(b)),由于本文并不探讨地标与注记符号的配置,四幅结果图中的地标与注记符号均为半自动化配置,即首先根据对应点位自动放置,然后人工调节其位置尽可能避免重叠。通过对比图4图5中变比例尺和等比例尺转换结果,可以看出变比例尺结果图能为地标和注记符号提供了较为充足的显示空间;而等比例尺缩小的结果表明在地图密集区域注记符号的显示空间明显不足,过于拥挤甚至互相压叠,从而验证了本文所提方法对于较小显示空间能够有效改善地图清晰度的优点。
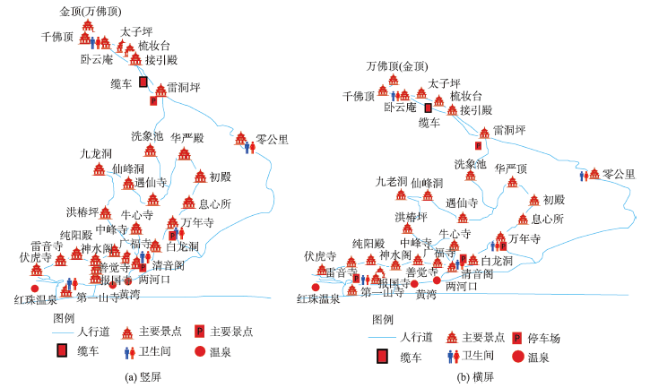
Fig. 4 The results of variable scaling of E'Mei Mountain tourist map with labels

图4 增加注记的峨眉山旅游路线图变比例尺缩小结果

Fig. 5 The results of uniformly scaling of E'Mei Mountain tourist map with labels

图5 增加注记的峨眉山旅游路线图等比例尺缩小结果

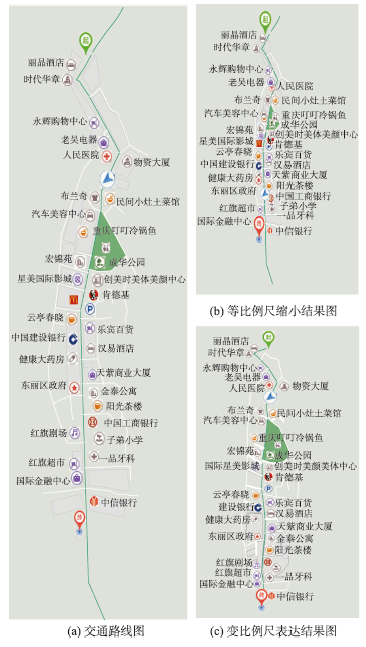
Fig. 6 The original route map, uniformly down-scaling map and variable scale map

图6 交通路线图、等比例尺缩小及变比例尺表达

本文又采用了道路网数据进行方法验证,图6(a)为地图原始形状,图6(b)和(c)分别为等比例尺缩小结果图和使用本文方法生成的变比例尺结果图,并按照5寸屏幕显示大小,其中粗线为一条行驶路径。目标方程中 w 值为1,图6(c)生成时间2.1 s,图6(b)的生成的等比例尺缩小结果图只是图形的等比例尺缩小,是直接拖动改变图形大小的,所以在此不考虑其生成时间。此外为了提高地图认知效率,每个路口配置两个地标符号及相应注记。可以看出,图6(b)在等比例尺缩小后,基本无法支持地图的清晰识别。本文所提方法生成的变比例尺结果图6(c)可以极大改善移动设备小屏幕显示的清晰度,充分利用小屏幕显示空间,并且在路径导航过程中始终为地图用户提供概览,从而增强了路径识别的空间感和认知度。该类变比例尺地图也可为乘坐公交车的用户提供路线认知,因为公交车上通常只提供下一站的站名信息,并且在没有上下车乘客的情况下,很可能不停站。而乘坐不熟悉路线的乘客经常担心是否到站或者还有多久到站,特别在晚上无法看清周围环境信息,例如路牌、站牌,因此在地图上始终看到起始点和周围地标能够帮助乘客不断地确认自己的空间位置,从而提高了地图服务能力。

4 总结

本文提出了面向较小显示空间的路线图变比例尺转换方法。首先基于格网对地图密度分布进行估计,然后基于密度通过优化建模进行格网变形,最终使用散点内插方法进行网状地图重构从而实现地图变比例尺转换。该方法顾及地标和注记符号的显示空间并且对地图变形进行控制。实验结果表明,相对于等比例尺变换结果图,该方法所生成的变比例尺结果图清晰度得到明显改善,从而较为充分的利用小屏幕显示空间,同时也较好保持了良好的地图识别,另外方法的运算效率也较高。
本文方法可以在一定程度上克服小屏幕显示空间不足的问题,从而提高了的识别能力和效率,希望能够推动移动地图制图方法的发展。对于道路地图的变比例尺表达,由于道路表达长度与其实际长度会产生偏差,通常人们规划路线是以道路实际长度为基础,认为实际长度与通行时间长短相一致,因此可能会产生认知误导。今后,研究将在变尺度道路地图上深入研究交通运行时间信息可视化表达,如通过设定道路本身的色彩、形状或者宽窄来表达交通通行时间或通达度[30-31],以及通过附加blod单位时间元[31]、通行时间等值线[30]等方法。事实上,道路实际长度也并不一定与真实通行时间长短成比例,还要考虑交通拥挤、道路宽度等因素,因此,在继承变比例尺地图优点的基础上,如何通过适宜的可视化表达方法高效准确地反映通行时间是将来研究的重点。

The authors have declared that no competing interests exist.

[1]
周成虎. 全空间地理信息系统展望[J].地理科学进展,2015,34(2):129-131.地理信息系统作为一门空间科学,以其独特的空间观点和空间思维,从空间相互联系和相互作用出发,揭示各种事物与现象的空间分布特征和动态变化规律。本文从地理信息系统所研究的空间对象出发,对地理信息系统发展新方向提出思考:①从地球空间拓展到宇宙空间,需要构建宇心坐标系和宇宙GIS、月球GIS等;②从室外空间延伸到室内空间,需要发展室内GIS,并拓展到水下空间和地下空间;③从宏观到微观空间,可以发展面向游戏的体育GIS、面向生命健康管理的人体GIS等;④面向大数据时代,发展大数据空间解析的理论和方法,贡献于大数据科学的发展。

DOI

[Zhou C H.Prospects on pan-spatial mapping and geographic information science and technology[J]. Process in Geography, 2015,34(2):129-131. ]

[2]
Cotcoran P, Mooney P, Bertolotto M.Interactive cartographic route descriptions[J]. Geoinformatica, 2014,18:1-26.

[3]
Karnick P, Cline D, Jeschke S, et al.Route visualization using detail lenses[J]. IEEE Transactions on Visualization and Computer Graphics, 2010,16(2):235-247.We present a method designed to address some limitations of typical route map displays of driving directions. The main goal of our system is to generate a printable version of a route map that shows the overview and detail views of the route within a single, consistent visual frame. Our proposed visualization provides a more intuitive spatial context than a simple list of turns. We present a novel multifocus technique to achieve this goal, where the foci are defined by points of interest (POI) along the route. A detail lens that encapsulates the POI at a finer geospatial scale is created for each focus. The lenses are laid out on the map to avoid occlusion with the route and each other, and to optimally utilize the free space around the route. We define a set of layout metrics to evaluate the quality of a lens layout for a given route map visualization. We compare standard lens layout methods to our proposed method and demonstrate the effectiveness of our method in generating aesthetically pleasing layouts. Finally, we perform a user study to evaluate the effectiveness of our layout choices.

DOI PMID

[4]
Li Z L.Algorithmic foundation of multi-scale spatial representation [M]. Boca Raton: CRC Press, 2006.

[5]
徐柱,刘彩凤,张红,等.基于路划网络功能评价的道路选取方法[J].测绘学报,2012,41(5):769-776.提出以路划为选取单元以路划网络功能为选取指标的道路选取方法,路划网络功能的衡量指标综合 考虑了中心度、连接度、长度等因素,由网络分析获得;选取的道路通过基于图论的逐步搜索保持连通性和规模最小;采用多种结构形态的实际城市局部路网、整体 路网进行试验,结果表明该方法能较好地保持路网的整体结构、局部典型结构和道路连通性,适用于各种形态的路网,较常规的基于路划长度的选取方法具有明显优 势。

[Xu Z, Liu C F, Zhang H, et al.Road selection based on evaluation of stroke network functionality[J]. ActaGeodaetica et Cartographica Sinica, 2012,41(5):769-776. ]

[6]
Wilson D, Bertolotto M, Weakliam J.Personalizing map content to improve task completion efficiency[J]. International Journal of Geographical Information Science, 2010,24(5):741-760.Significant interaction challenges arise in both developing and using interactive map applications. Users encounter problems of information overload in using interactive maps to complete tasks. This is further exacerbated by device limitations and interaction constraints in increasingly popular mobile platforms. Application developers must then address restrictions related to screen size and limited bandwidth in order to effectively display maps on mobile devices. In order to address issues of user information overload and application efficiency in interactive map applications, we have developed a novel approach for delivering personalized vector maps. Ongoing task interactions between users and maps are monitored and captured implicitly in order to infer individual and group preferences related to specific map feature content. Personalized interactive maps that contain spatial feature content tailored specifically to users' individual preferences are then generated. Our approach addresses spatial information overload by providing only the map information necessary and sufficient to suit user interaction preferences, thus simplifying the completion of tasks performed with interactive maps. In turn, tailoring map content to specific user preferences considerably reduces the size of vector data sets necessary to transmit and render maps on mobile devices. We have developed a geographic information system prototype, MAPPER (MAP PERsonalization), that implements our approach. Experimental evaluations show that the use of personalized maps helps users complete their tasks more efficiently and can reduce information overload.

DOI

[7]
Reichenbacher T.Mobile cartography: Adaptive visualisation of geographic information on mobile devices[D]. Germany: Technische Universität München, 2004.

[8]
华一新. 全空间信息系统的核心问题和关键技术[J].测绘科学技术学,2016,33(4):331-335.分析了空间信息系统的研究现状和存在问题,阐明了全空间信息系统的基本概念和基本特征;提出了基于多粒度时空对象构建全空间信息系统的技术路线,明确了需要研究解决的科学问题和关键技术;提出了全空间信息系统与智能设施管理的主要研究内容,指出预期的研究效益。

DOI

[Hua Y X.The key issues and technologies of pan-spatial information system[J]. Journal of Geomatics Science and Technology, 2016,33(4):331-335. ]

[9]
Barkowsky T, Freksa C.Cognitive requirements on making and interpreting maps. Spatial information theory: A theoretical basis for GIS, 347-361, Berlin: Springer, 1997.

[10]
艾廷华,梁蕊.导航电子地图的变比例尺可视化[J].武汉大学学报·信息科学版,2007,32(2):127-130.

[Ai T H, Liang R.Variable-scale visualization in navigation electronic map[J]. Geomatics and Information Science of Wuhan University, 2007,32(2):127-130. ]

[11]
Harrie L, Sarjakoski L T, Lehto L.A variable-scale map for small-display cartography[C]. Proceedings of the Joint International Symposium on Geo-Spatial Theory, Ottawa: Processing and Applications, Canada, 2002.

[12]
Haunert J, Sering L.Drawing road networks with focus regions[J]. IEEE Transactions on Visualization and Computer Graphics, 2011,17(12):2555-2562.Mobile users of maps typically need detailed information about their surroundings plus some context information about remote places. In order to avoid that the map partly gets too dense, cartographers have designed mapping functions that enlarge a user-defined focus region - such functions are sometimes called fish-eye projections. The extra map space occupied by the enlarged focus region is compensated by distorting other parts of the map. We argue that, in a map showing a network of roads relevant to the user, distortion should preferably take place in those areas where the network is sparse. Therefore, we do not apply a predefined mapping function. Instead, we consider the road network as a graph whose edges are the road segments. We compute a new spatial mapping with a graph-based optimization approach, minimizing the square sum of distortions at edges. Our optimization method is based on a convex quadratic program (CQP); CQPs can be solved in polynomial time. Important requirements on the output map are expressed as linear inequalities. In particular, we show how to forbid edge crossings. We have implemented our method in a prototype tool. For instances of different sizes, our method generated output maps that were far less distorted than those generated with a predefined fish-eye projection. Future work is needed to automate the selection of roads relevant to the user. Furthermore, we aim at fast heuristics for application in real-time systems.

DOI PMID

[13]
Kadmon N, Shlomi E.A poly-focal projection for statistical surface[J]. The Cartographic Journal, 1978,15(1):36-41.Abstract The evolution of a continuous projection for portraying the area of territorial units in proportion to a thematic variable has, in the past, eluded the cartographer. The present paper—resulting from postgraduate research in cartography by the second author under the supervision of the first—describes the development of such a projection and some of the possible applications.

DOI

[14]
Li Q Q.Variable-scale representation of road networks on small mobile devices[J]. Computers & Geosciences, 2009,35(11):2185-2190.A method is proposed for the adaptive multi-scale representation of road networks for location-based service applications. The method is able to automatically set a feasible scale according to geographic scope, the complexity of the road network, and the distance to the viewer. Moreover, the method achieves multi-scale representations of road networks on a display screen. The key steps of the method and the initial experimental studies undertaken to evaluate its feasibility are described.

DOI

[15]
Kopf J, Agrawala M, Bargeron D, et al.Automatic generation of destination maps[J]. ACM Transactions on Graphics, 2010,29(6):1581-1582.Destination maps are navigational aids designed to show anyone within a region how to reach a location (the destination). Hand-designed destination maps include only the most important roads in the region and are non-uniformly scaled to ensure that all of the important roads from the highways to the residential streets are visible. We present the first automated system for creating such destination maps based on the design principles used by mapmakers. Our system includes novel algorithms for selecting the important roads based on mental representations of road networks, and for laying out the roads based on a non-linear optimization procedure. The final layouts are labeled and rendered in a variety of styles ranging from informal to more formal map styles. The system has been used to generate over 57,000 destination maps by thousands of users. We report feedback from both a formal and informal user study, as well as provide quantitative measures of success.

DOI

[16]
Agrawala M, Stolte C.Rendering effective route maps: Improving usability through generalization[C]. Proceeding s of the 28th annual conference on computer graphics and interactive techniques (SIGGRAPH’01), Los Angeles, CA. New York: ACM, 2001,241-249.

[17]
Bak P, Schaefer M, Stoffel A, et al.Density equalizing distortion of large geographic point sets[J]. Cartography and Geographic Information Science, 2009,36(3):237-250.Visualizing large geo-demographical datasets using pixel-based techniques involves mapping the geospatial dimensions of a data point to screen coordinates and appropriately encoding its statistical value by color. The analysis of such data presents a great challenge. General tasks involve clustering, categorization, and searching for patterns of interest for sociological or economic research. Available visual encodings and screen space limitations lead to over-plotting and hiding of patterns and clusters in densely populated areas, while sparsely populated areas waste space and draw the attention away from the areas of interest. In this paper, two new approaches (RadialScale and AngularScale) are introduced to create density-equalized maps, while preserving recognizable features and neighborhoods in the visualization. These approaches build the core of a multi-scaling technique based on local features of the data described as local minima and maxima of point density. Scaling is conducted several times around these features, which leads to more homogeneous distortions. Results are illustrated using several real-world datasets. Our evaluation shows that the proposed techniques outperform traditional techniques as regard the homogeneity of the resulting data distributions and therefore build a more appropriate basis for analytic purposes.

DOI

[18]
Merrick D, Gudmundsson J.Increasing the readability of graph drawings with centrality-based scaling[C]. Tokyo: Proceeding of Asia-Pacific Symposium Information Visualization, 2006:67-76.

[19]
Li Z L, Ti P.Adaptive generation of variable-scale network maps for small displays based on line density distribution[J]. Geo-Informatica, 2015,19(2),277-295.This paper presents an integrated strategy for adaptive generation of variable-scale network maps for different small displays. It is based on the line density distribution and comprised of three steps, i.e. (a) to estimate the line density by a grid-based method, (b) to adaptively generate variable-scale maps based on density distribution for given display sizes and (c) to improve the map readability by map generalization. The proposed strategy has been tested by using two real-life network datasets, with a statistical analysis and a perceptual evaluation. Experimental results show that this strategy is able to better exploit the limited map space so as to significantly improve map clarity and readability and at the same time to preserve map recognition ability compared to its original shape.

DOI

[20]
Lin S S, Lin C H, Hu Y J, et al.Drawing road networks with mental maps[J]. IEEE Transactions on Visualization and Computer Graphics, 2014,20(9):1241-1252.Tourist and destination maps are thematic maps designed to represent specific themes in maps. The road network topologies in these maps are generally more important than the geometric accuracy of roads. A road network warping method is proposed to facilitate map generation and improve theme representation in maps. The basic idea is deforming a road network to meet a user-specified mental map while an optimization process is performed to propagate distortions originating from road network warping. To generate a map, the proposed method includes algorithms for estimating road significance and for deforming a road network according to various geometric and aesthetic constraints. The proposed method can produce an iconic mark of a theme from a road network and meet a user-specified mental map. Therefore, the resulting map can serve as a tourist or destination map that not only provides visual aids for route planning and navigation tasks, but also visually emphasizes the presentation of a theme in a map for the purpose of advertising. In the experiments, the demonstrations of map generations show that our method enables map generation systems to generate deformed tourist and destination maps efficiently.

DOI PMID

[21]
Frishman Y, Tal,A.Uncluttering graph layouts using anisotropic diffusion and mass transport[J]. IEEE Transaction on Visualization and Computer Graphics, 2009,15(5):777-788.Many graph layouts include very dense areas, making the layout difficult to understand. In this paper, we propose a technique for modifying an existing layout in order to reduce the clutter in dense areas. A physically inspired evolution process based on a modified heat equation is used to create an improved layout density image, making better use of available screen space. Using results from optimal mass transport problems, a warp to the improved density image is computed. The graph nodes are displaced according to the warp. The warp maintains the overall structure of the graph, thus limiting disturbances to the mental map, while reducing the clutter in dense areas of the layout. The complexity of the algorithm depends mainly on the resolution of the image visualizing the graph and is linear in the size of the graph. This allows scaling the computation according to required running times. It is demonstrated how the algorithm can be significantly accelerated using a graphics processing unit (GPU), resulting in the ability to handle large graphs in a matter of seconds. Results on several layout algorithms and applications are demonstrated.

DOI PMID

[22]
Borchert J R.The twin cities unbanized areas: Past, Present, and Future[J]. Geographical Review, 1961,51:47-70.The article spotlights fashion designer and Lily et Cie proprietor Rita Watnick. Watnick has designed her second ready-to-wear collection. Her collection includes pink dresses in feathers and silk faille. She reveals that she wants to do dresses similar to what Karl Lagerfeld does for Chanel haute couture.

DOI

[23]
Matti W.Gridsquare ntwork as a reference system for t- he analysis of small area data[J]. Acta Geographica Lovaniensia, 1972,10:63-147.

[24]
Jansen M, Van Kreveld M.Evaluating the consistency of cartographic generalization[C]. Proceeding of 8th International Symposium on Spatial Data Handling, Vancouver, Canada, 1998: 668-678.

[25]
Gatrell A, Baley T, Diggle P, et al.Spatial point pattern analysis and its application in geographical epidemiology[J]. Transaction s of the Institute of British Geographers, 1996,21:74-256.This paper reviews a number of methods for the exploration and modelling of spatial point patterns with particular reference to geographical epidemiology (the geographical incidence of disease). Such methods go well beyond the conventional 'nearest-neighbour' and 'quadrat' analyses which have little to offer in an epidemiological context because they fail to allow for spatial variation in population density. Correction for this is essential if the aim is to assess the evidence for 'clustering' of cases of disease. We examine methods for exploring spatial variation in disease risk, spatial and space-time clustering, and we consider methods for modelling the raised incidence of disease around suspected point sources of pollution. All methods are illustrated by reference to recent case studies including child cancer incidence, Burkitt's lymphoma, cancer of the larynx and childhood asthma. An Appendix considers a range of possible software environments within which to apply these methods. The links to modern geographical information systems are discussed.

DOI

[26]
Boyd S, Vandenberghe L.Convex optimization[M]. Cambridge: Cambridge University Press, 2004.

[27]
Ti P, Li Z L.Generation of schematic network maps with automated detection and enlargement of congested areas[J]. International Journal of Geographical Information Science, 2014,28(3):521-540.Nowadays, the design of the London Tube map (as a kind of schematic map) has been popularly adopted for transport network maps worldwide because of its great clarity of representation. In such types of map, the shape of the network is simplified and the topology between lines is preserved while the congested areas are enlarged to a desirable scale. Efforts have also been made to automate the production of such maps. However, to our best knowledge, no existing methods have explicitly taken into consideration the automated enlargement of congested areas. As such an enlargement is vital to the improvement of clarity, this paper proposes a new automated method to generate schematic network maps, consisting of (a) automated detection of congested areas, (b) automated enlargement of congested areas to a desirable scale and (c) automated generation of the schematic representation of the deformed network maps using a stroke-based approach. The new method has been tested with two real-life network data sets, i.e. the London Tube and Hong Kong metro data sets, and evaluated by fractal analysis and experimental studies. The results of the evaluation indicate that the new method is able to automatically generate the schematic maps with improved clarity and aesthetics.

DOI

[28]
Franke R.Scattered data interpolation: test of some methods[J]. Mathematics of Computation, 1982,38:181-200.This paper is concerned with the evaluation of methods for scattered data interpolation and some of the results of the tests when applied to a number of methods. The process involves evaluation of the methods in terms of timing, storage, accuracy, visual pleasantness of the surface, and ease of implementation. To indicate the flavor of the type of results obtained, we give a summary table and representative perspective plots of several surfaces.

DOI

[29]
Hardy R L.Multiquadric equations of topography and other irregular surfaces[J]. Journal of Geophysical Research, 1971,176:1905-1915.A new analytical method of representing irregular surfaces that involves the summation of equations of quadric surfaces having unknown coefficients is described. The quadric surfaces are located at significant points throughout the region to be mapped. Procedures are given for solving multiquadric equations of topography that are based on coordinate data. Contoured multiquadric surfaces are compared with topography and other irregular surfaces from which the multiquadric equation was derived.

DOI

[30]
Haverkort H.Embedding cues about travel time in schematic maps[C]//Schematic Mapping Workshop, 2014.

[31]
J.Stevens and K.Goldsberry.Fixed-interval segmentation for travel time estimations in traffic maps. Presentation at Ann. Meeting Assoc. of American Geographers(AAG) ,2012.

Outlines

/