Gridding Methods of City Permanent Population Based on Night Light Data and Spatial Regression Models

  • LI Xiang , 1, 2 ,
  • CHEN Zhenjie , 1, 2, * ,
  • WU Jiexuan 1, 2 ,
  • WANG Wenxiang 1, 2 ,
  • QU Lean 1, 2 ,
  • ZHOU Chen 1, 2 ,
  • HAN Xiaofeng 3
Expand
  • 1. Jiangsu Provincial Key Laboratory of Geographic Information Science and Technology, Nanjing 210023, China
  • 2. Department of Geographic Information Science, Nanjing University, Nanjing 210023, China
  • 3. Bureau of land and resources of Nanjing, Nanjing 210005, China
*Corresponding author: CHEN Zhenjie, E-mail:

Received date: 2017-02-24

  Request revised date: 2017-07-26

  Online published: 2017-10-20

Copyright

《地球信息科学学报》编辑部 所有

Abstract

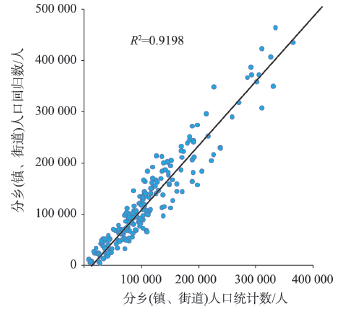
It is important to acquire the amount and the spatial distribution features of permanent population accurately, which can be used to clarify the development of social state. Thus, it would enhance the capacity of population management. Currently, population census data is mainly collected in administrative regions, making it difficult to describe the spatial distribution features of population in cities. Moreover, the precision decreases when using night light data to regress population, and it is clearly affected by roads, public service facilities and the lights of the cities. Therefore, it is necessary to improve the precision of population regression. This study takes Shanghai as the study area because it is one of the national center cities and faced with huge population pressure along with the rapid urbanization processes. Two types of data sources are involved in the study, including the National Polar-orbiting Partnership Visible Infrared Imaging Radiometer Suite (NPP -VIIRS) night light data and township-level permanent population census data. We extracted the night light data in commercial and residential land in order to mitigate the influence of roads and the lights of the city. Results showed that the correlation coefficient between summation of night light data and amount of permanent population was improved from 0.7032 to 0.8026. Further, we used a spatial regression model to derive the permanent population of Shanghai in 2013, and found that the relative error is 10.57%. Finally, we corrected the results in partition. Experimental results of high precision can be achieved when spatial regression model was used to regress permanent population. Moreover, the gridding results of permanent population can make up the shortcoming of low spatial resolution of traditional statistical data, and describe the circle feature and real distribution of permanent population with more details.

Cite this article

LI Xiang , CHEN Zhenjie , WU Jiexuan , WANG Wenxiang , QU Lean , ZHOU Chen , HAN Xiaofeng . Gridding Methods of City Permanent Population Based on Night Light Data and Spatial Regression Models[J]. Journal of Geo-information Science, 2017 , 19(10) : 1298 -1305 . DOI: 10.3724/SP.J.1047.2017.01298

1 引言

人口是城市发展的重要因素,科学、有效地管理人口对提升城市品质、合理制定政策意义重大[1]。近年来,中国城市化步伐加快,大量人口涌入城市。随着人口的持续增长,城市人口、资源、环境之间的矛盾越来越突出,影响到城市的可持续发展[2]。现有的常住人口数据主要来自于公安部门的人口登记资料或人口普查数据[3]。这些资料往往更新不及时、难以反映人口的实际空间分布,不能有效地揭示城市内部人口分布的空间差异性。因此,迫切需要实时、动态地获取常住人口的数量及其空间分布特征。
目前,借助土地利用、遥感影像等数据进行人口格网化的研究越来越受到关注[4]。Khomarudin等[5]利用人口统计数据和土地利用数据对人口进行了格网化处理,估算受海啸灾害影响的人数;Gallego等[6]利用统计数据与Landsat影像数据模拟了2000年欧盟人口的空间格局;廖顺宝等[7]利用土地利用数据和地形数据模拟了西藏地区2003年人口分布情况。这些研究为人口格网化提供了思路和方法的借鉴,但研究尺度多为国家或省域。因此,实验结果误差较大,且无法反映精细尺度上的人口分布情况。
夜间灯光数据能够探测到城市、小规模居民区、车流等产生的不同强度的光亮[8],是监测人类活动的有效数据源。夜间灯光数据能够用亮度表征人类活动强度的高低,可以作为多种社会、经济指标的代理变量[9-14]。NPP-VIIRS夜间灯光数据是第二代夜间灯光数据产品,自2012年开始发布,和第一代夜间灯光数据DMSP-OLS (Defense Meteorological Satellite Program’s Operational Linescan System)数据相比,NPP-VIIRS夜间灯光数据的空间分辨率、时间分辨率、辐射分辨率均有了较大的提升,更加适合用于人类经济社会活动的研究[13]。NPP-VIIRS夜间灯光数据已被用于城市建成区提取[15]、GDP的估算[16]、货运量的估算[17]、用电量的估算[18]等方面研究。以往研究主要利用DMSP-OLS夜间灯光数据对人口估算:高义等[19]利用DMSP-OLS夜间灯光数据估算2010年中国沿海地区人口数量; 陈晴等[20]比较了土地利用数据和DMSP-OLS夜间灯光数据对黄河三角洲高效生态经济区2010年人口数模拟的结果,发现土地利用数据的结果精度更高。以上研究多以省、市行政区为单元,根据行政单元内的人口总数与所有像元的灯光亮度累计值建立线性回归模型,忽略了人口分布的空间集聚特征。而且在城市内部,受公共服务设施、城市亮化灯光的影响,夜间灯光数据亮度累计值与人口数的相关性有所降低。如何提高夜间灯光数据对人口数的回归精度,并在更小尺度上对人口数进行回归,值得探究。
本文以上海市为研究区,使用数据质量更高的NPP-VIIRS夜间灯光数据,结合商业和居住区空间分布,利用空间回归模型对常住人口进行分乡(镇、街道)回归,并对回归结果进行分乡(镇、街道)修正,得到了精细空间尺度的常住人口分布结果。在此基础上,分析上海市常住人口分布的圈层特征和空间差异性,为新型城镇化建设提供决策支持。

2 研究区概况与数据源

2.1 研究区概况

上海地处长江入海口,隔东海和日本九州岛相望,西南、西北与浙江省、江苏省相接,是中国的经济、金融、贸易、航运、会展中心,也是世界上规模最大的都会区之一。2013年上海总面积6340 km2,辖16个区,226个乡(镇、街道)[21]。上海经济十分发达,2013年上海GDP达到21 818亿元人民币,占中国GDP总量3.66%[22],居中国城市第一位,亚洲城市第二位,仅次于日本东京[22]。2013年,上海市常住人口数达到2415.15万人,常住人口密度为3809.15人/ km2,在中国城市中排名第二[23]。巨大的人口基数与人口密度使上海市人口管理面临巨大压力。

2.2 数据源

本文涉及的数据包括夜间灯光数据、矢量数据和统计数据,数据时间均为2013年,数据来源及主要参数如表1所示。夜间灯光数据包括NPP-VIIRS夜间灯光数据和DMSP-OLS夜间灯光数据,如图1图2所示。这2种数据均来自于美国国家地球物理数据中心(National Geophysical Data Center, NGDC)(http://ngdc.noaa.gov/eog/)。DMSP-OLS夜间灯光数据已将火山、油气燃烧、野火等发出的噪声亮度过滤[24]。因此,为了使实验结果尽可能精确,本文利用DMSP-OLS夜间灯光数据对NPP-VIIRS夜间灯光数据进行去噪声处理。常住人口统计数据采用上海市统计局公开的上海市各区(县)的年鉴,细化到乡(镇、街道)。此外,为了得到商业和居住区上的灯光数据,收集了2013年上海市土地利用调查数据,土地利用调查数据比例尺为1:150 000,土地利用类型包括居住用地、商业用地、交通用地、耕地、林地、草地、水域等。
Tab. 1 Data source and main parameters

表1 数据来源及主要参数

类型 名称 来源 分辨率/m 比例尺
夜间灯光
数据
月际NPP-VIIRS
夜间灯光数据
NGDC 约500 -
年际DMSP-OLS
夜间灯光数据
NGDC 约1000 -
矢量数据 上海市乡镇级
行政区划
上海市民政局 - 1:150 000
上海市土地利用
调查数据
上海市国土局 - 1:150 000
统计数据 上海市乡镇级常住
人口统计数据
上海市统计局 - -
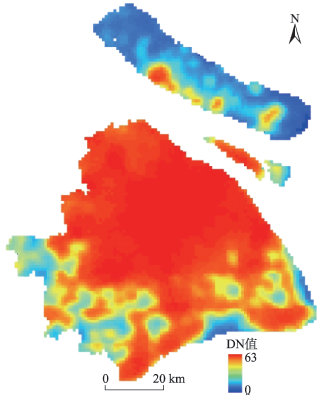
Fig. 1 NPP-VIIRS night light data of Shanghai in 2013

图1 2013年上海市NPP-VIIRS夜间灯光数据

Fig. 2 DMSP-OLS night light data of Shanghai in 2013

图2 2013年上海市DMSP-OLS夜间灯光数据

3 研究方法

3.1 数据预处理

数据预处理包括夜间灯光数据重采样、噪声 去除。
(1)夜间灯光数据重采样。在全球夜间灯光数据的基础上,利用上海行政区划先裁剪出2013年上海市的DMSP-OLS夜间灯光数据,然后裁剪出2013年每月的上海市NPP-VIIRS夜间灯光数据,通过求取12个月的平均值,得到上海市2013年NPP-VIIRS夜间灯光数据的年均值。NPP-VIIRS夜间灯光数据的原始空间分辨率约为500 m×500 m,DMSP-OLS夜间灯光数据原始空间分辨率约为1000 m×1000 m。为了与土地利用调查等数据更好地匹配,将它们的坐标系统统一为北京1954坐标系,投影系统为高斯克吕格投影,且均重采样为250 m×250 m。
(2)噪声去除。本文采用施开放等[17]提出的方法进行噪声去除。DMSP-OLS夜间灯光数据已经将野火、火山等噪声亮度去除,且DMSP-OLS夜间灯光数据具有亮度溢出的缺点。因此,可以认为NPP-VIIRS夜间灯光数据绝大部分的亮度区会在DMSP-OLS夜间灯光数据中保留[25]。本文噪声去除有2步:① 将2013年DMSP-OLS夜间灯光数据中像元值为0的区域提取出作为掩膜,以此过滤2013年上海市NPP-VIIRS夜间灯光数据年均值中的噪声像元;② 将NPP-VIIRS夜间灯光数据中负值像元的像元值设为0。

3.2 常住人口空间回归模型构建

空间回归模型的一般形式[26]如式(1)所示。
Y = ρ W 1 + βX + μ μ = λ W 2 + ε (1)
式中:Y为行政单元的常住人口统计数;X是行政单元内的灯光亮度累计值;为X的空间回归系数;W1W2分别是人口、残差的空间权重矩阵;β为灯光亮度累计值的空间回归系数;μ为残差项;λ为残差项的空间回归系数;ε为随机误差。
根据、以及的取值情况,可以构建出不同类型的空间回归模型[26]:① 当,时,得到普通线性回归模型(Ordinary Linear Regression Model, OLRM),表示模型中没有空间效应。② 当,,,得到一阶空间回归模型。③ 当,,时,得到空间滞后模型(Spatial Lag Model, SLM)。④ 当,,时,得到空间误差模型(Spatial Error Model, SEM)。由于空间滞后模型与空间误差模型的非零空间回归系数比一阶空间回归模型多,能更充分地利用回归对象的空间聚集特征进行回归[26],因此,本文的空间回归模型只考虑空间滞后模型和空间误差模型。
本文选择8邻域的邻接方式构建空间权重矩阵,因为它能全面反映行政单元之间的空间邻接关系,即当单元ij间具有共同边界或共享一个顶点时,认为二者邻接,其权重Wij=1,否则Wij=0[27]
基于乡(镇、街道)的常住人口回归结束后,将格网单元的灯光亮度值代入X,并将回归系数代入回归模型中,便可求得格网单元上的常住人口的回归值。

3.3 精度检验与结果修正

通过计算回归结果和统计数据的相对误差检验精度,计算公式为:
γ = POP ¯ - POP POP × 100 % (2)
式中:为相对误差;是上海市2013年常住人口的回归结果;为上海市2013年常住人口的统计数。
对于常住人口回归结果采用分乡(镇、街道)的修正方式,构建各乡(镇、街道)的修正系数,对各格网单元的回归结果进行调整,使得各乡(镇、街道)回归的人口总数与实际统计常住人口数完全吻合,由此便得到了修正后上海市范围内250 m×250 m格网单元的常住人口数。修正公式如下:
p ji ' = p ji × c j c j = PO P j / POP j ¯ (3)
式中: p ji ' 表示第j个乡(镇、街道)第i个格网单元修正后的常住人口数;为回归得到的第j个乡(镇、街道)第i个格网单元的常住人口数;为第j个乡(镇、街道)的修正系数;为第j个乡(镇、街道)的常住人口统计数; POP j ¯ 为第j个乡(镇、街道)的常住人口回归数。

4 结果分析

4.1 常住人口数与夜间灯光累计值相关性分析

土地利用的空间格局能够客观地反映人口的空间分布特征,常住人口一般聚集在特定类型的用地区域[28]。因此,研究提取出商业和居住用地的夜间灯光数据,对比常住人口数与商业和居住区夜间灯光累计值、全域夜间灯光累计值的相关性。
基于上海市土地利用调查数据,按照上海市乡镇级行政界线,提取出各乡(镇、街道)的商业和居住区的夜间灯光数据,结果如图4所示。由图3、4可知,常住人口数与商业和居住区的NPP-VIIRS灯光累计值对上海市的区分力度大致相当。再进行相关性分析知,常住人口数与商业和居住区NPP-VIIRS灯光累计值皮尔逊相关系数为0.8026;而与全域灯光累计值的相关系数为0.7032。说明通过提取商业和居住区的灯光数据,可以在一定程度上减少路灯、城市亮化区等的影响,增强人口数与夜间灯光亮度累计值的相关性,从而改善回归效果。
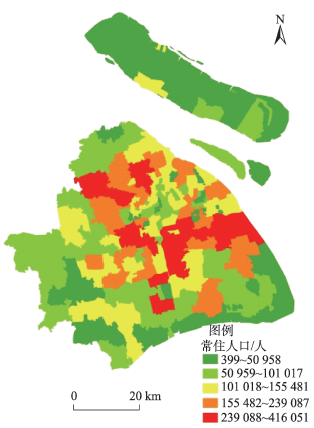
Fig. 3 Size of permanent population of all towns in Shanghai in 2013

图3 2013年上海市各乡(镇、街道)常住人口数

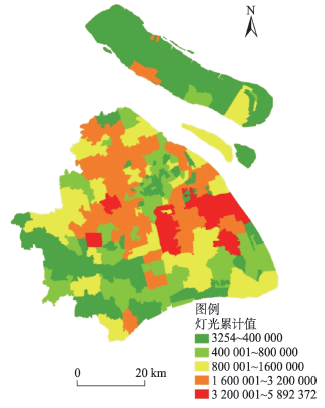
Fig. 4 Summation of NPP-VIIRS night light data in commercial and residential land of all towns in Shanghai in 2013

图4 2013年上海市各乡(镇、街道)商业和居住区NPP-VIIRS夜间灯光数据累计值

4.2 空间回归模型优度比较

常住人口数与商业和居住区的NPP-VIIRS灯光累计值具有良好的相关性。因此,研究采用商业和居住区上的灯光累计值作为自变量,常住人口数作为因变量,进行空间回归模型的比较,选择最优空间回归模型。
经过回归分析,OLS、SLM、SEM模型的回归结果见表2。对空间回归模型优度的评价指标有: ① 相关性R2;② 自然对数似然函数值(Log Likelihood, LogL);③ 赤池信息准则(Akake Information Criterion, AIC);④ 施瓦茨准则(Schwartz Criterion, SC)。其中,R2的取值范围是[0,1],R2越接近1,表明模型的回归效果越好。此外,LogL值越大,同时AIC和SC值越小,表明空间回归模型的回归效果越好[29]。对于最优空间回归模型的选择,在普通最小二乘线性回归模型(Ordinary Least Squares, OLS)的基础上,还需判断拉格朗日乘数(Lagrange Multiplier, LM)和稳健拉格朗日乘数(Robust Lagrange Multiplier, R-LM)的显著性,二者的值越大,说明模型的回归效果越好[30]
表2可看出,SEM的R2、LogL值较SLM更大,且二者的P值均为0.00,通过检验;SEM的AIC、SC值更小;同时,SEM的LM和RLM值均高于SLM的相应值,表明SEM的回归结果更好。综合比较回归模型,选择空间误差模型对上海市常住人口进行空间回归。
Tab. 2 Goodness comparison among OLS, SLM and SEM

表2 OLS、SLM与SEM模型优度比较

模型比较 OLS SLM SEM
R2 0.8026 0.8064 0.8154
LogL -2741.15 -2730.49 -2721.11
P - 0.00 0.00
AIC 5486.30 5466.97 5446.23
SC 5493.15 5477.24 5453.07
LM - 22.81 50.12
RLM - 0.80 28.11

4.3 常住人口空间回归结果精度检验

利用最优空间回归模型得到的2013年上海市常住人口数为2670.49万人,与全市常住人口统计总数2415.15回归结果精度检验。
利用最优空间万人相比,多255.34万人,相对误差为10.57%,回归结果与统计数据较接近。此外,对各乡(镇、街道)常住人口回归数与各乡(镇、街道)人口统计数进行相关性分析,如图5所示。从图中可以看出,分乡(镇、街道)的回归数与人口统计数据二者间具有显著的线性关系,R2达到0.9198。
Fig. 5 Test of the results in township level

图5 分乡镇回归结果检验

由于回归模型的误差影响,各乡(镇、街道)的回归人口数与实际统计数会有一定偏差。因此,参照式(3),构建各乡(镇、街道)的修正系数,然后将各乡(镇、街道)内的所有格网单元的回归人口数分别乘以相应的修正系数,使得最终各乡(镇、街道)回归的常住人口数与统计的常住人口数一致,以此得到修正后的250 m×250 m格网单元内的常住人口数。

4.4 常住人口空间分布特征

上海市2013年分乡(镇、街道)常住人口数和常住人口密度如图3、6所示。常住人口数图仅能在行政区尺度上反映乡(镇、街道)的常住人口数量的多少,而常住人口密度图能一定程度上反映人口聚集程度的高低,且能大致表现出人口分布的圈层特征。
将常住人口格网化结果(图7)与常住人口密度对比,可以看出:① 上海远郊区域灯光亮度值较低,人口比较稀少,这与实际情况相符;② 上海市中心城区人口密集,随着离中心城区距离越远,人口密度逐渐减小,各乡(镇、街道)内部的人口密度变化随之体现;③ 格网化结果能够详细展现出常住人口分布的圈层结构特点。
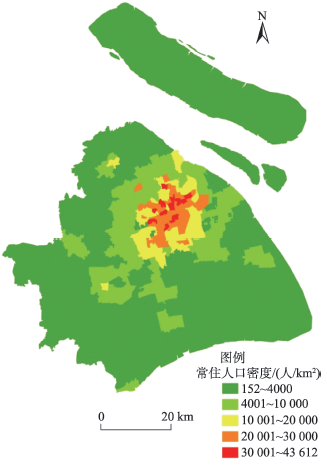
Fig. 6 Permanent population density in township level of Shanghai in 2013

图6 2013年上海市乡镇级常住人口密度

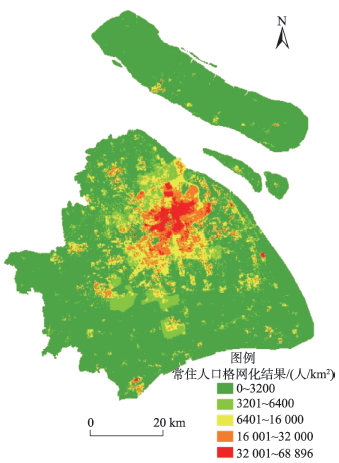
Fig. 7 Permanent population gridding results of Shanghai in 2013

图7 2013年上海市常住人口格网化结果

根据格网化结果,上海市常住人口具有明显的圈层分布特征。上海市中心城区包含了上海市大部分商业、服务业及居住用地,基础设施完善,经济社会活动频繁,是公共资源的聚集地,对人口吸引力大,人口密度较高。除一些公园、植物园外(如静安区大灵石公园、徐汇区的上海植物园等),这些区域人口密度均在6400人/ km2上,最高可达到 68 896人/ km2。上海远郊区域主要为农林用地区,人类活动强度较弱,人口密度较低,格网单元内的人口密度一般在6400人/ km2以下。此外,外围乡(镇、街道)也有零星的人口聚集区,主要为乡(镇、街道)中心区域,表明每个乡(镇、街道)的中心区域具有一定的人口和经济集聚能力。

5 结论与讨论

本文利用NPP-VIIRS夜间灯光数据作为代理变量,结合统计数据与空间回归模型对上海市2013年常住人口进行空间格网化,弥补了传统统计数据空间分辨率低、空间分布特征不明显等缺点。主要结论如下:
(1)基于NPP-VIIRS夜间灯光数据,构建空间回归模型,可以精细估算乡镇级尺度上的常住人口数。常住人口分布一般存在显著空间集聚特征,本文选择空间回归模型对上海市常住人口进行回归,并对回归模型进行了优选,最优空间回归模型的回归结果与统计数据的相对误差为10.75%。与常用的线性回归模型相比,空间回归模型的回归结果精度更高。
(2)商业和居住用地是人类活动最为频繁的土地利用类型,同时也承载了城市中的绝大部分人口。因此,使用商业和居住区内的灯光数据进行空间回归,可以在一定程度上减少路灯、城市亮化区等的影响,增强人口数与夜间灯光数据亮度累计值的相关性,从而改善回归效果。为了进一步提高回归结果的精度,本文采用分乡(镇、街道)修正的方法,使回归结果和常住人口统计数据完全一致。
(3)上海市常住人口空间分布具有明显圈层特征。根据格网化结果,2013年上海市常住人口分布以中心城区最为密集,人口密度最高可达68 896人/km2,离中心城区越远,人口密度较低。外围乡(镇、街道)的中心区域,也有零星的人口聚集区。
NPP-VIIRS夜间灯光数据为研究人类活动提供了新的、更精细的数据源,但其数据质量受城市亮化灯光等干扰光源影响较大,不同期数据一致性较差。在未来的研究中,可以考虑结合高分辨率遥感影像等多源数据,探索校正、提高NPP-VIIRS夜间灯光数据质量的方法。

The authors have declared that no competing interests exist.

[1]
Sutton P.Modeling population density with night-time satellite imagery and GIS[J]. Computers, Environment and Urban Systems, 1997,21(3):227-244.Night-time satellite imagery, as provided by the Defense Meteorological Satellite Program's Operational Linescan System (DMSP OLS), shows promise as a proxy measurement of urban extent. Earlier efforts have shown that the areas of contiguous saturated DMSP OLS images show strong correlations with the total population living in those areas. This paper describes efforts at modeling the population density within the urban areas identified within the continental United States. These efforts build upon the previous efforts of Clark, Berry, Nordbeck, Tobler and others to describe the variation of population density within cities. The method described herein differs from the aforementioned theories because it operates from the edges of the urban areas rather than attempting to identify a “center” of the urban cluster. By measuring distance from the edge rather than the distance from the center this method allows for the “multiple nuclei” of urban clustering that have clearly manifested as a result of the conurbation of urban centers within the U.S.A. This paper describes the methods used to allocate population to one, two, three, five, and ten square kilometer pixels for the continental U.S.A. Several urban population decay functions are applied and evaluated. In addition, an empirical urban population density decay function is derived for all the urban clusters defined by the DMSP imagery.

DOI

[2]
Ma T, Zhou C, Pei T, et al.Quantitative estimation of urbanization dynamics using time series of DMSP nighttime light data: A comparative case study from China's cities[J]. Remote Sensing of Environment, 2012,124:99-107.Urbanization process involving increased population size, spatially extended land cover and intensified economic activity plays a substantial role in anthropogenic environment changes. Remotely sensed nighttime lights datasets derived from the Defense Meteorological Satellite Program's Operational Linescan System (DMSP/OLS) provide a consistent measure for characterizing trends in urban sprawl over time (Sutton, 2003). The utility of DMSP/OLS imagery for monitoring dynamics in human settlement and economic activity at regional to global scales has been widely verified in previous studies through statistical correlations between nighttime light brightness and demographic and economic variables ( and ). The quantitative relationship between long-term nighttime light signals and urbanization variables, required for extensive application of DMSP/OLS data for estimating and projecting the trajectory of urban development, however, are not well addressed for individual cities at a local scale. We here present analysis results concerning quantitative responses of stable nighttime lights derived from time series of DMSP/OLS imagery to changes in urbanization variables during 1994鈥2009 for more than 200 prefectural-level cities and municipalities in China. To identify the best-fitting model for nighttime lights-based measurement of urbanization processes with different development patterns, we comparatively use three regression models: linear, power-law and exponential functions to quantify the long-term relationships between nighttime weighted light area and four urbanization variables: population, gross domestic product (GDP), built-up area and electric power consumption. Our results suggest that nighttime light brightness could be an explanatory indicator for estimating urbanization dynamics at the city level. Various quantitative relationships between urban nighttime lights and urbanization variables may indicate diverse responses of DMSP/OLS nighttime light signals to anthropogenic dynamics in urbanization process in terms of demographic and economic variables. At the city level, growth in weighted lit area may take either a linear, concave (exponential) or convex (power law) form responsive to expanding human population and economic activities during urbanization. Therefore, in practice, quantitative models for using DMSP/OLS data to estimate urbanization dynamics should vary with different patterns of urban development, particularly for cities experiencing rapid urban growth at a local scale.

DOI

[3]
严士清. 新中国户籍制度演变历程与改革路径研究[D].上海:华东师范大学,2012.

[ Yan S Q, On the Evolution and the Reforming Paths of Chinese Household Registration System[D]. Shanghai: East China Normal University, 2012. ]

[4]
陈振拓. 服务于地震应急的人口数据格网化方法研究——以云南省为例[D].北京:中国地震局地质研究所,2012.

[ Chen Z T.Study on the grid transformation of population data for the service of earthquake emergency: A case study in Yunnan Province[D]. Beijing: Institute of Geology, China Earthquake Administration, 2012. ]

[5]
Khomarudin M, Strunz G, Ludwig R, et al.Hazard analysis and estimation of people exposure as contribution to tsunami risk assessment in the west coast of Sumatra, the south coast of Java and Bali[J]. Zeitschrift für Geomorphologie, Supplementary Issues, 2010,54(3):337-356.The Indian Ocean Tsunami 2004 dramatically showed the catastrophic consequences when destructive tsunami waves are striking coastal areas. Moreover, it became clear that there is an urgent need for tsunami early warning systems to be set up together with appropriate awareness raising and preparedness activities. In response to this catastrophic event and under the coordination by the UNESCO Intergovernmental Oceanographic Commission the Indian Ocean countries are jointly working on the development, implementation and operation of a tsunami early warning system and the realization of disaster risk assessment and preparedness activities.A crucial component in disaster risk management is the availability of reliable information on the population distribution in the tsunami hazard zones in order to mitigate the impact of natural disasters. The mapping of tsunami hazard zones and the estimation of people exposure will help the government to improve the evacuation planning and to decrease the amount of people at risk.This paper presents research results developed in the framework of the German-Indonesian Tsunami Early Warning System project focussing on the west coast of Sumatra, the south coast of Java, and Bali. The methodology for the determination of the hazard zones is based on a multi-scenario approach. For the estimation of the population distribution a method is applied that combines statistical data with land use information in order to disaggregate the census data proportionally. This approach provides estimates for day- and night-time population in the hazard zones. The hazard and exposure maps are provided for the whole coastal regions and, in more detail, for the study areas Padang, Cilacap and Kuta. Moreover, essential key parameters of this analysis are integrated in the Decision Support System of the Indonesian Tsunami Early Warning Centre.

DOI

[6]
Gallego F.A population density grid of the European Union[J]. Population and Environment, 2010,31(6):60-473.This paper describes four methods used to produce dasymetric population density grids combining population data per commune with CORINE Land Cover, a map available for all countries of the European Union. An accuracy assessment has been carried out for five countries for which a very reliable 1-km population density grid exists; the improvement, compared with the choropleth map per commune, ranges between 20% for the weakest result in Finland and 62% for the best result in the Netherlands. The best results are obtained with a method using logit regression to integrate information from the point survey LUCAS (Land Use/Cover Area frame Survey); however, performance differences between methods are moderate. The dasymetric grid is distributed free of charge by the European Environment Agency, for non-commercial use.

DOI

[7]
廖顺宝,李泽辉.基于人口分布与土地利用关系的人口数据空间化研究——以西藏自治区为例[J].自然资源学报,2003,18(6):659-665.土地是人与自然相互作用的产物,人口分布与土地利用具有非常密切的关系。根据1999年全国市县统计人口数据与各市县土地利用类型指数的相关性分析,发现各市县平均人口密度与各市县各类土地利用指数的复相关系数为0.82,在西藏、青海和海南3省区,复相关系数均达到0.99。以西藏自治区为例,根据市县人口密度与土地利用指数及数字高程的相关关系建立了人口数据空间化模型,并计算出西藏自治区1km×1km分辨率的栅格人口数据。在被选作验证区的3县37个乡镇中,用模型计算出的各乡镇人口密度与各乡镇的实际人口密度的相关系数为0.88。因此,土地利用信息是进行市县级人口统计数据空间化的重要参数,利用土地利用与人口分布之间客观存在的关系可以进行市县级人口统计数据的空间化。

DOI

[ Liao S B, Li Z H.Study on spatialization of population census data based on relationship between population distribution and land use-Taking Tibet as an example[J]. Journal of Natural Resources, 2003,18(6):660-667. ]

[8]
Elvidge C, Cinzano P, Pettit D, et al.The nightsat mission concept[J]. International Journal of Remote Sensing, 2007,28(12):2645-2670.Nightsat is a concept for a satellite system capable of global observation of the location, extent and brightness of night‐time lights at a spatial resolution suitable for the delineation of primary features within human settlements. Based on requirements from several fields of scientific inquiry, Nightsat should be capable of producing a complete cloud‐free global map of lights on an annual basis. We have used a combination of high‐resolution field spectra of outdoor lighting, moderate resolution colour photography of cities at night from the International Space Station, and high‐resolution airborne camera imagery acquired at night to define a range of spatial, spectral, and detection limit options for a future Nightsat mission. The primary findings of our study are that Nightsat should collect data from a near‐synchronous orbit in the early evening with 50 to 10002m spatial resolution and have detection limits of 2.5E61802Watts02cm612sr61108m611 or better. Although panchromatic low‐light imaging data would be useful, multispectral low‐light imaging data would provide valuable information on the type or character of lighting; potentially stronger predictors of variables such as ambient population density and economic activity; and valuable information to predict response of other species to artificial night lighting. The Nightsat mission concept is unique in its focus on observing a human activity, in contrast to traditional Earth observing systems that focus on natural systems.

DOI

[9]
Shi K, Chen Y, Yu B, et al.Modeling spatiotemporal CO2 (carbon dioxide) emission dynamics in China from DMSP-OLS nighttime stable light data using panel data analysis[J]. Applied Energy, 2016,168:523-533.China’s rapid industrialization and urbanization have resulted in a great deal of CO 2 (carbon dioxide) emissions, which is closely related to its sustainable development and the long term stability of global climate. This study proposes panel data analysis to model spatiotemporal CO 2 emission dynamics at a higher resolution in China by integrating the Defense Meteorological Satellite Program’s Operational Linescan System (DMSP-OLS) nighttime stable light (NSL) data with statistic data of CO 2 emissions. Spatiotemporal CO 2 emission dynamics were assessed from national scale down to regional and urban agglomeration scales. The evaluation showed that there was a true positive correlation between NSL data and statistic CO 2 emissions in China at the provincial level from 1997 to 2012, which could be suitable for estimating CO 2 emissions at 102km resolution. The spatiotemporal CO 2 emission dynamics between different regions varied greatly. The high-growth type and high-grade of CO 2 emissions were mainly distributed in the Eastern region, Shandong Peninsula and Middle south of Liaoning, with clearly lower concentrations in the Western region, Central region and Sichuan–Chongqing. The results of this study will enhance the understanding of spatiotemporal variations of CO 2 emissions in China. They will provide a scientific basis for policy-making on viable CO 2 emission mitigation policies.

DOI

[10]
Wu J, Wang Z, Li W, et al.Exploring factors affecting the relationship between light consumption and GDP based on DMSP/OLS nighttime satellite imagery[J]. Remote Sensing of Environment, 2013,134:111-119.We consider night light as a type of consumer goods and propose a model for factors affecting the relationship between night lights and GDP. It is then decomposed into agricultural and non-agricultural productions. Further, the model is modified to determine how the factors affect residents' propensity to consume lights. Models are tested with time-fixed regression on a set of 15-year panel data of 169 countries globally and regionally. We find that light consumption propensity is affected by GDP per capita, latitude, spatial distribution of human activities and gross saving rate, and that light consumption per capita has an inverted-U relationship with GDP per capita.

DOI

[11]
Yu B, Shu S, Liu H, et al.Object-based spatial cluster analysis of urban landscape pattern using nighttime light satellite images: A case study of China[J]. International Journal of Geographical Information Science, 2014,28(11):2328-2355.Previous studies have demonstrated urban built-up areas can be derived from nighttime light satellite (DMSP-OLS) images at the national or continent scale. This paper presents a novel object-based method for detecting and characterizing urban spatial clusters from nighttime light satellite images automatically. First, urban built-up areas, derived from the regionally adaptive thresholding of DMSP-OLS nighttime light data, are represented as discrete urban objects. These urban objects are treated as basic spatial units and quantified in terms of geometric and shape attributes and their spatial relationships. Next, a spatial cluster analysis is applied to these basic urban objects to form a higher level of spatial units 鈥 urban spatial clusters. The Minimum Spanning Tree (MST) is used to represent spatial proximity relationships among urban objects. An algorithm based on competing propagation of objects is proposed to construct the MST of urban objects. Unlike previous studies, the distance between urban objects (i.e., the boundaries of urban built-up areas) is adopted to quantify the edge weight in MST. A Gestalt Theory-based method is employed to partition the MST of urban objects into urban spatial clusters. The derived urban spatial clusters are geographically delineated through mathematical morphology operation and construction of minimum convex hull. A series of landscape ecologic and statistical attributes are defined and calculated to characterize these clusters. Our method has been successfully applied to the analysis of urban landscape of China at the national level, and a series of urban clusters have been delimited and quantified.

DOI

[12]
Lu H, Liu G.Spatial effects of carbon dioxide emissions from residential energy consumption: A county-level study using enhanced nocturnal lighting[J]. Applied Energy, 2014,131:297-306.As the world’s largest developing country and greenhouse gas emitter, China’s residential energy consumption (REC) is now responsible for over 11% of the country’s total energy consumption. In this paper, we present a novel method that utilizes spatially distributed information from the Defense Meteorological Satellite Program’s Operational Linescan System (DMSP–OLS) and human activity index (HAI) to test the hypothesis that counties with similar carbon dioxide emissions from REC are more spatially clustered than would be expected by chance. Our results revealed a high degree of county-level clustering in the distribution of emissions per capita. However, further analysis showed that high-emission counties tended to be surrounded by counties with relatively low per capita GDP levels. Therefore, our results contrasted with other evidence that REC emissions were closely related to GDP levels. Accordingly, we stress the need for the consideration of other factors in determining emission patterns, such as residential consumption patterns (e.g., consumer choices, behavior, knowledge, and information diffusion).

DOI

[13]
Chen Z, Yu B, Hu Y, et al.Estimating house vacancy rate in metropolitan areas using NPP-VIIRS nighttime light composite data[J]. IEEE Journal of Selected Topics in Applied Earth Observations and Remote Sensing, 2015,8(5):2188-2197.House vacancy rate (HVR) is an important index in assessing the healthiness of residential real estate market. Investigating HVR by field survey requires a lot of human and economic resources. The nighttime light (NTL) data, derived from Suomi National Polar-orbiting Partnership, can detect the artificial light from the Earth surface, and have been used to study social-economic activities. This paper proposes a method for estimating the HVR in metropolitan areas using NPP-VIIRS NTL composite data. This method combines NTL composite data with land cover information to extract the light intensity in urbanized areas. Then, we estimate the light intensity values for nonvacancy areas, and use such values to calculate the HVR in corresponding regions. Fifteen metropolitan areas in the United States have been selected for this study, and the estimated HVR values are validated using corresponding statistical data. The experimental results show a strong correlation between our derived HVR values and the statistical data. We also visualize the estimated HVR on maps, and discover that the spatial distribution of HVR is influenced by natural situations as well as the degree of urban development.

DOI

[14]
Elvidge C, Sutton P, Ghosh T, et al.A global poverty map derived from satellite data[J]. Computers & Geosciences, 2009,35(8):1652-1660.A global poverty map has been produced at 30 arcsec resolution using a poverty index calculated by dividing population count (LandScan 2004) by the brightness of satellite observed lighting (DMSP nighttime lights). Inputs to the LandScan product include satellite-derived land cover and topography, plus human settlement outlines derived from high-resolution imagery. The poverty estimates have been calibrated using national level poverty data from the World Development Indicators (WDI) 2006 edition. The total estimate of the numbers of individuals living in poverty is 2.2 billion, slightly under the WDI estimate of 2.6 billion. We have demonstrated a new class of poverty map that should improve over time through the inclusion of new reference data for calibration of poverty estimates and as improvements are made in the satellite observation of human activities related to economic activity and technology access.

DOI

[15]
Shi K, Huang C, Yu B, et al.Evaluation of NPP-VIIRS night-time light composite data for extracting built-up urban areas[J]. Remote Sensing Letters, 2014,5(4):358-366.The first global night-time light composite data from the Visible Infrared Imaging Radiometer Suite (VIIRS) day鈥搉ight band carried by the Suomi National Polar-orbiting Partnership (NPP) satellite were released recently. So far, few studies have been conducted to assess the ability of NPP-VIIRS night-time light composite data to extract built-up urban areas. This letter aims to evaluate the potential of this new-generation night-time light data for extracting urban areas and compares the results with Defense Meteorological Satellite Program鈥揙perational Linescan System (DMSP-OLS) data through a case study of 12 cities in China. The built-up urban areas of 12 cities are extracted from NPP-VIIRS and DMSP-OLS data by using statistical data from government as reference. The urban areas classified from Landsat 8 data are used as ground truth to evaluate the spatial accuracy. The results show the built-up urban areas extracted from NPP-VIIRS data have higher spatial accuracies than those from DMSP-OLS data for all the 12 cities. These improvements are due to the relatively high spatial resolution and wide radiometric detection range of NPP-VIIRS data. This study reveals that NPP-VIIRS night-time light composite data would provide a powerful tool for urban built-up area extraction at national or regional scale.

DOI

[16]
Li X, Xu H, Chen X, et al.Potential of NPP-VIIRS nighttime light imagery for modeling the regional economy of China[J]. Remote Sensing, 2013,5(6):3057-3081.Historically, the Defense Meteorological Satellite Program鈥檚 Operational Linescan System (DMSP-OLS) was the unique satellite sensor used to collect the nighttime light, which is an efficient means to map the global economic activities. Since it was launched in October 2011, the Visible Infrared Imaging Radiometer Suite (VIIRS) sensor on the Suomi National Polar-orbiting Partnership (NPP) Satellite has become a new satellite used to monitor nighttime light. This study performed the first evaluation on the NPP-VIIRS nighttime light imagery in modeling economy, analyzing 31 provincial regions and 393 county regions in China. For each region, the total nighttime light (TNL) and gross regional product (GRP) around the year of 2010 were derived, and a linear regression model was applied on the data. Through the regression, the TNL from NPP-VIIRS were found to exhibit R2 values of 0.8699 and 0.8544 with the provincial GRP and county GRP, respectively, which are significantly stronger than the relationship between the TNL from DMSP-OLS (F16 and F18 satellites) and GRP. Using the regression models, the GRP was predicted from the TNL for each region, and we found that the NPP-VIIRS data is more predictable for the GRP than those of the DMSP-OLS data. This study demonstrates that the recently released NPP-VIIRS nighttime light imagery has a stronger capacity in modeling regional economy than those of the DMSP-OLS data. These findings provide a foundation to model the global and regional economy with the recently availability of the NPP-VIIRS data, especially in the regions where economic census data is difficult to access.

DOI

[17]
Shi K, Yu B, Hu Y, et al.Modeling and mapping total freight traffic in China using NPP-VIIRS nighttime light composite data[J]. GIScience & Remote Sensing, 2015,52(3):274-289.In early 2013, the first global Suomi National Polar-orbiting Partnership (NPP) visible infrared imaging radiometer suite (VIIRS) nighttime light composite data were released. Up to present, few studies have been conducted to evaluate the ability of NPP-VIIRS data to estimate the amount of freight traffic. This paper provides an exploratory evaluation on the NPP-VIIRS data for estimating the total freight traffic (TFT) in China, in comparison with the results derived from the Defense Meteorological Satellite Program-Operational Linescan System (DMSP-OLS) nighttime stable light composite data. We first corrected the original NPP-VIIRS data by employing a simple method to remove the outliers. The total nighttime light (TNL) which is measured by the sum value of all pixels from the nighttime light composite data was then regressed on TFT at the provincial level of China. Finally, the spatial distribution patterns of TFT were produced from the corrected NPP-VIIRS and DMSP-OLS data, respectively, and validated by the TFT statistics of 244 prefectures. The results have demonstrated that the corrected NPP-VIIRS data are more suitable for modeling TFT in China than the DMSP-OLS data.

DOI

[18]
Shi K, Yu B, Huang Y, et al.Evaluating the ability of NPP-VIIRS nighttime light data to estimate the gross domestic product and the electric power consumption of China at multiple scales: A comparison with DMSP-OLS data[J]. Remote Sensing, 2014,6(2):1705-1724.The nighttime light data records artificial light on the Earth’s surface and can be used to estimate the spatial distribution of the gross domestic product (GDP) and the electric power consumption (EPC). In early 2013, the first global NPP-VIIRS nighttime light data were released by the Earth Observation Group of National Oceanic and Atmospheric Administration’s National Geophysical Data Center (NOAA/NGDC). As new-generation data, NPP-VIIRS data have a higher spatial resolution and a wider radiometric detection range than the traditional DMSP-OLS nighttime light data. This study aims to investigate the potential of NPP-VIIRS data in modeling GDP and EPC at multiple scales through a case study of China. A series of preprocessing procedures are proposed to reduce the background noise of original data and to generate corrected NPP-VIIRS nighttime light images. Subsequently, linear regression is used to fit the correlation between the total nighttime light (TNL) (which is extracted from corrected NPP-VIIRS data and DMSP-OLS data) and the GDP and EPC (which is from the country’s statistical data) at provincial- and prefectural-level divisions of mainland China. The result of the linear regression shows that R2 values of TNL from NPP-VIIRS with GDP and EPC at multiple scales are all higher than those from DMSP-OLS data. This study reveals that the NPP-VIIRS data can be a powerful tool for modeling socioeconomic indicators; such as GDP and EPC.

DOI

[19]
高义,王辉,王培涛,等.基于人口普查与多源夜间灯光数据的海岸带人口空间化分析[J].资源科学,2013,35(12):2518-2525.

[ Gao Y, Wang H, Wang P T, et.al. Analysis of population spatialization for Chinese coastal zones based on census and multiple night light data[J]. Resources Science, 2013,35(12):2518-2525. ]

[20]
陈晴,侯西勇,吴莉.基于土地利用数据和夜间灯光数据的人口空间化模型对比分析——以黄河三角洲高效生态经济区为例[J].人文地理,2014(5):94-100.

[ Chen Q, Hou X Y, Wu, L.Comparison of population spatialization models based on land use data and DMSP/OLS data respectively: A case study in the efficient ecological economic zone of the Yellow River Delta[J]. Human Geography, 2014,5:94-101. ]

[21]
上海统计局.上海统计年鉴[M].北京:中国统计出版社,2015.

[ Statistics Bureau of Shanghai. Shanghai Statistical Yearbook[M]. Beijing: China Statistics Press, 2015. ]

[22]
中国国家统计局.中国统计年鉴[M]. 北京:中国统计出版社,2015.

[Statistics Bureau of China. China Statistical Yearbook[M]. Beijing: China Statistics Press, 2015. ]

[23]
中国国家统计局.中国城市统计年鉴[M].北京:中国统计出版社,2015.

[Statistics Bureau of China. China City Statistical Yearbook[M]. Beijing: China Statistics Press, 2015. ]

[24]
Elvidge C, Baugh K, Dietz J, et al.Radiance calibration of DMSP low-light imaging data of human settlements[J]. Remote Sensing of Environment, 1999,68(1):77-88.Nocturnal lighting is a primary method for enabling human activity. Outdoor lighting is used extensively worldwide in residential, commercial, industrial, public facilities, and roadways. A radiance calibrated nighttime lights image of the United States has been assembled from Defense Meteorological Satellite Program (DMSP) Operational Linescan System (OLS). The satellite observation of the location and intensity of nocturnal lighting provide a unique view of humanities presence and can be used as a spatial indicator for other variables that are more difficult to observe at a global scale. Examples include the modeling of population density and energy related greenhouse gas emissions.

DOI

[25]
Zhuo L, Zheng J, Zhang X, et al.An improved method of night-time light saturation reduction based on EVI[J]. International Journal of Remote Sensing, 2015,36(16):4114-4130.Defense Meteorological Satellite Program (DMSP) Operational Linescan System (OLS) night-time light (NTL) data have been widely applied to studies on anthropogenic activities and their interactions with the environment. Due to limitations of the OLS sensor, DMSP NTL data suffer from a saturation problem in central urban areas, which further affects studies based on nocturnal lights. Recently, the vegetation-adjusted NTL urban index (VANUI) has been developed based on the inverse correlation of vegetation and urban surfaces. Despite its simple implementation and ability to effectively increase variations in NTL data, VANUI does not perform well in certain rapidly growing cities. In this study, we propose a new index, denoted enhanced vegetation index (EVI)-adjusted NTL index (EANTLI), that was developed by reforming the VANUI algorithm and utilizing the EVI. Comparisons with radiance-calibrated NTL (RCNTL) and the new Visible Infrared Imager Radiometer Suite (VIIRS) data for 15 cities worldwide show that EANTLI reduces saturation in urban cores and mitigates the blooming effect in suburban areas. EANTLI鈥檚 similarity to RCNTL and VIIRS is consistently higher than VANUI鈥檚 similarity to RCNTL and VIIRS in both spatial distribution and latitudinal transects. EANTLI also yields better results in the estimation of electric power consumption of 166 Chinese prefecture-level cities. In conclusion, EANTLI can effectively reduce NTL saturation in urban centres, thus presenting great potential for wide-range applications.

DOI

[26]
Knegt H J, Langevelde F, Coughenour M B, et al.Spatial autocorrelation and the scaling of species-environment relationships[J]. Ecology, 2010,91(8):2455-2465.Issues of residual spatial autocorrelation (RSA) and spatial scale are critical to the study of species-environment relationships, because RSA invalidates many statistical procedures, while the scale of analysis affects the quantification of these relationships. Although these issues independently are widely covered in the literature, only sparse attention is given to their integration. This paper focuses on the interplay between RSA and the spatial scaling of species-environment relationships. Using a hypothetical species in an artificial landscape, we show that a mismatch between the scale of analysis and the scale of a species' response to its environment leads to a decrease in the portion of variation explained by environmental predictors. Moreover, it results in RSA and biased regression coefficients. This bias stems from error-predictor dependencies due to the scale mismatch, the magnitude of which depends on the interaction between the scale of landscape heterogeneity and the scale of a species' response to this heterogeneity. We show that explicitly considering scale effects on RSA can reveal the characteristic scale of a species' response to its environment. This is important, because the estimation of species-environment relationships using spatial regression methods proves to be erroneous in case of a scale mismatch, leading to spurious conclusions when scaling issues are not explicitly considered. The findings presented here highlight the importance of examining the appropriateness of the spatial scales used in analyses, since scale mismatches affect the rigor of statistical analyses and thereby the ability to understand the processes underlying spatial patterning in ecological phenomena.

DOI PMID

[27]
Dormann C F, McPherson J M, Araújo M B, et al. Methods to account for spatial autocorrelation in the analysis of species distributional data: a review[J]. Ecography, 2007,30(5):609-628.

[28]
吴洁璇. 开放数据支持下的城市建设用地利用效率评价方法研究[D].南京:南京大学,2016.

[ Wu J X.Study on evaluation method of city construction land use efficiency support by open data[D]. Nanjing: Nanjing University, 2016. ]

[29]
Wu F J, Deng M, Liu W B.A novel representation of topological relations between spatial regions using metrics of point sets[J]. Chinese Journal of electronics, 2006,15(4):665-668.

[30]
吴玉鸣,李建霞.中国省域能源消费的空间计量经济分析[J].中国人口资源与环境,2008,18(3):93-98.能源消费对中国国民经济发展和人民生活水平的作用越来越重要.针对目前相关研究大多采用时间序列分析、很少进行截面数据分析及特别缺乏空间计量经济分析的现状,以省域为空间样本,应用空间计量经济学方法分析了2002-2005年中国省域的能源消费及其影响因素.结果发现,我国省域能源消费在空间上存在依赖性,能源消费行为受到本地能源消费和相邻省域的能源消费的共同影响,经济增长对省域能源消费的弹性系数显著为正,人口增长的正向作用也不容忽视,但是能源价格对能源消费未能起到应有的调节作用(弹性系数不显著为正),政府决策部门在制定能源消费政策和价格调控措施时,必须考虑到空间作用机制对能源消费的差异化作用.

DOI

[ Wu Y M, Li J X.Spatial econometric analysis of energy consumption of Chinese provinces[J]. Chinese Population, Resources and Environment, 2008,18(3):93-99. ]

Outlines

/